| Red | Green | Blue | |
| z | 17.64 | ||
| znorm | Inf | ||
| sky | -Inf | -Inf | -Inf |
| S/N | 25.5 | 43.0 | 43.5 |
| S/N(c) | 0.0 | 0.0 | 0.0 |
| SN(E/C) |

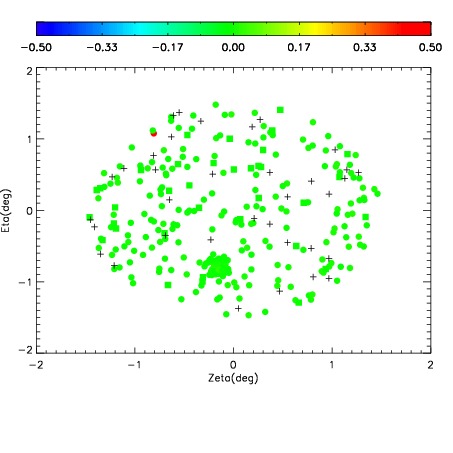
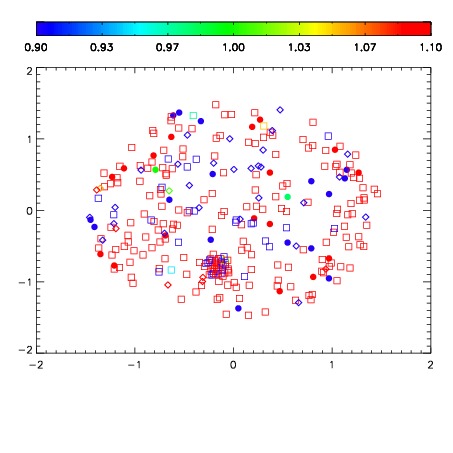
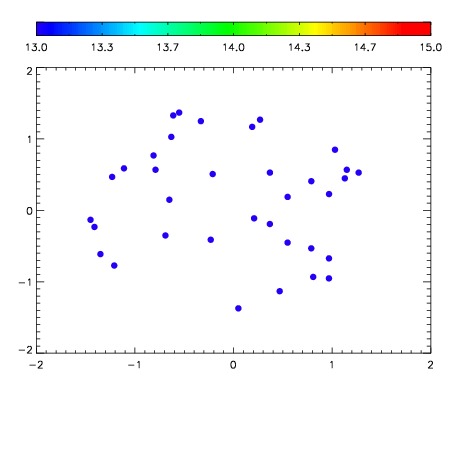

| Frame | Nreads | Zeropoints | Mag plots | Spatial mag deviation | Spatial sky 16325A emission deviations (filled: sky, open: star) | Spatial sky continuum emission | Spatial sky telluric CO2 absorption deviations (filled: H < 10) | |||||||||||||||||||||||
| 0 | 0 |
|
|
|
|
|
|
| IPAIR | NAME | SHIFT | NEWSHIFT | S/N | NAME | SHIFT | NEWSHIFT | S/N |
| 0 | 12520050 | 0.493929 | 0.00000 | 181.794 | 12520048 | -0.000529992 | 0.494459 | 187.373 |
| 1 | 12520049 | 0.492842 | 0.00108701 | 186.435 | 12520051 | -4.81285e-05 | 0.493977 | 197.091 |
| 2 | 12520046 | 0.489961 | 0.00396800 | 178.444 | 12520047 | -0.00153929 | 0.495468 | 184.814 |
| 3 | 12520045 | 0.489547 | 0.00438198 | 168.118 | 12520044 | 0.00000 | 0.493929 | 163.960 |