| Red | Green | Blue | |
| z | 17.64 | ||
| znorm | Inf | ||
| sky | -Inf | -Inf | -Inf |
| S/N | 27.4 | 45.9 | 48.5 |
| S/N(c) | 0.0 | 0.0 | 0.0 |
| SN(E/C) |
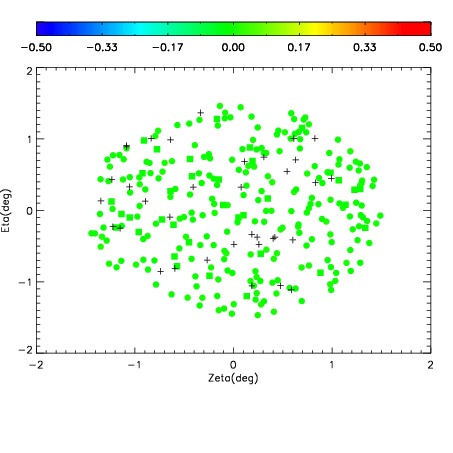
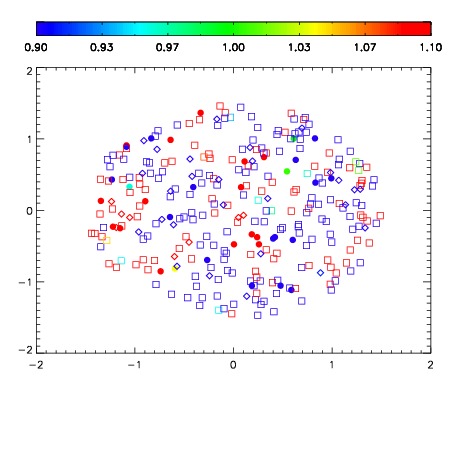
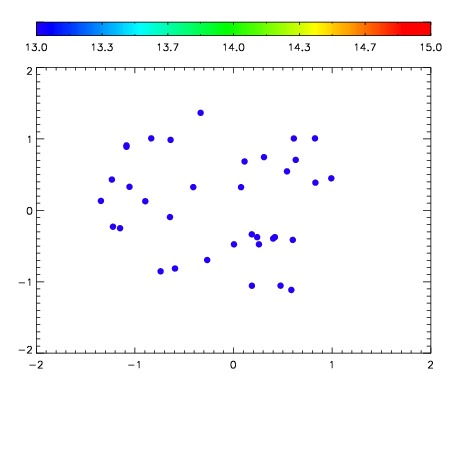

| Frame | Nreads | Zeropoints | Mag plots | Spatial mag deviation | Spatial sky 16325A emission deviations (filled: sky, open: star) | Spatial sky continuum emission | Spatial sky telluric CO2 absorption deviations (filled: H < 10) | |||||||||||||||||||||||
| 0 | 0 |
|
|
|
|
|
|
| IPAIR | NAME | SHIFT | NEWSHIFT | S/N | NAME | SHIFT | NEWSHIFT | S/N |
| 0 | 12630035 | 0.482214 | 0.00000 | 180.974 | 12630036 | -0.000965353 | 0.483179 | 182.248 |
| 1 | 12630034 | 0.482000 | 0.000214010 | 180.946 | 12630037 | -0.000906432 | 0.483120 | 180.317 |
| 2 | 12630038 | 0.480224 | 0.00198999 | 178.967 | 12630033 | 0.00000 | 0.482214 | 159.844 |
| 3 | 12630039 | 0.481737 | 0.000477016 | 72.3926 | 12630040 | -0.000380429 | 0.482594 | 144.776 |