| Red | Green | Blue | |
| z | 17.64 | ||
| znorm | Inf | ||
| sky | -Inf | -Inf | -Inf |
| S/N | 36.3 | 60.3 | 64.3 |
| S/N(c) | 0.0 | 0.0 | 0.0 |
| SN(E/C) |
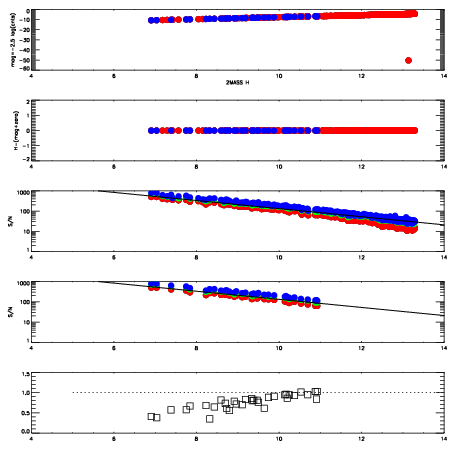
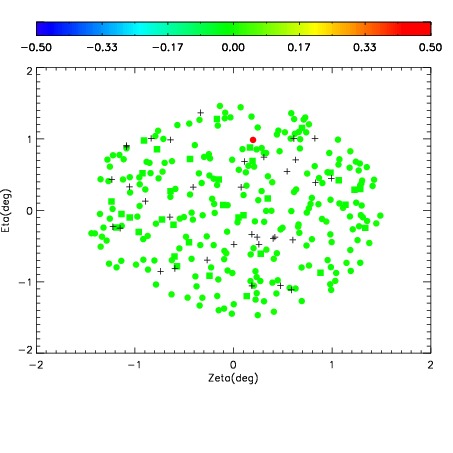
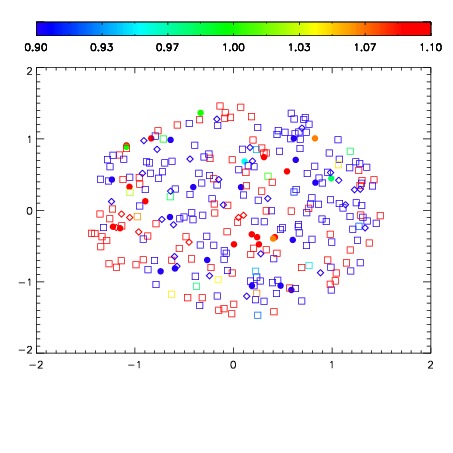

| Frame | Nreads | Zeropoints | Mag plots | Spatial mag deviation | Spatial sky 16325A emission deviations (filled: sky, open: star) | Spatial sky continuum emission | Spatial sky telluric CO2 absorption deviations (filled: H < 10) | |||||||||||||||||||||||
| 0 | 0 |
|
|
|
|
|
|
| IPAIR | NAME | SHIFT | NEWSHIFT | S/N | NAME | SHIFT | NEWSHIFT | S/N |
| 0 | 12690042 | 0.494412 | 0.00000 | 191.196 | 12690041 | 0.000430765 | 0.493981 | 194.001 |
| 1 | 12690038 | 0.492866 | 0.00154600 | 196.801 | 12690036 | -0.000603849 | 0.495016 | 194.555 |
| 2 | 12690039 | 0.493375 | 0.00103700 | 190.727 | 12690037 | -0.000515249 | 0.494927 | 193.510 |
| 3 | 12690035 | 0.492595 | 0.00181702 | 189.876 | 12690040 | 0.000355430 | 0.494057 | 192.870 |
| 4 | 12690034 | 0.492567 | 0.00184500 | 188.781 | 12690033 | 0.00000 | 0.494412 | 186.862 |