| Red | Green | Blue | |
| z | 17.64 | ||
| znorm | Inf | ||
| sky | -Inf | -Inf | -Inf |
| S/N | 20.8 | 37.5 | 45.3 |
| S/N(c) | 0.0 | 0.0 | 0.0 |
| SN(E/C) |

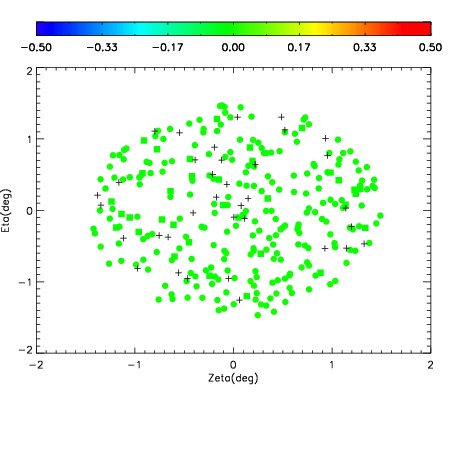
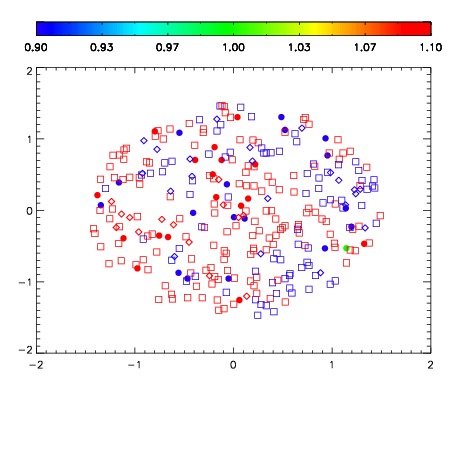


| Frame | Nreads | Zeropoints | Mag plots | Spatial mag deviation | Spatial sky 16325A emission deviations (filled: sky, open: star) | Spatial sky continuum emission | Spatial sky telluric CO2 absorption deviations (filled: H < 10) | |||||||||||||||||||||||
| 0 | 0 |
|
|
|
|
|
|
| IPAIR | NAME | SHIFT | NEWSHIFT | S/N | NAME | SHIFT | NEWSHIFT | S/N |
| 0 | 12730024 | 0.487652 | 0.00000 | 171.916 | 12730025 | -0.00213085 | 0.489783 | 168.888 |
| 1 | 12730027 | 0.485425 | 0.00222701 | 186.153 | 12730029 | -0.000194424 | 0.487846 | 179.607 |
| 2 | 12730028 | 0.485423 | 0.00222901 | 184.595 | 12730026 | -0.00255927 | 0.490211 | 178.573 |
| 3 | 12730023 | 0.487060 | 0.000591993 | 165.067 | 12730022 | 0.00000 | 0.487652 | 151.181 |