| Red | Green | Blue | |
| z | 17.64 | ||
| znorm | Inf | ||
| sky | -Inf | -Inf | -Inf |
| S/N | 18.6 | 35.0 | 38.2 |
| S/N(c) | 0.0 | 0.0 | 0.0 |
| SN(E/C) |
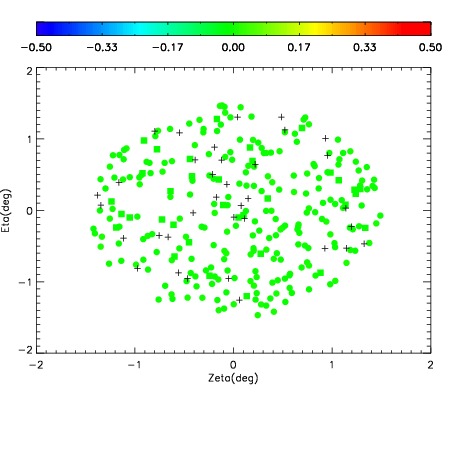
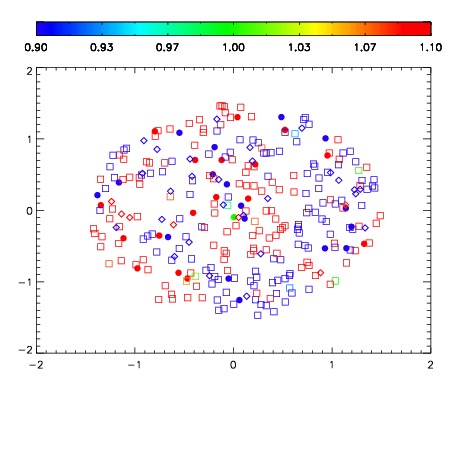
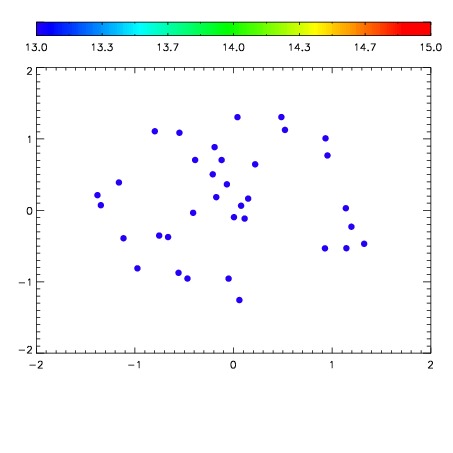

| Frame | Nreads | Zeropoints | Mag plots | Spatial mag deviation | Spatial sky 16325A emission deviations (filled: sky, open: star) | Spatial sky continuum emission | Spatial sky telluric CO2 absorption deviations (filled: H < 10) | |||||||||||||||||||||||
| 0 | 0 |
|
|
|
|
|
|
| IPAIR | NAME | SHIFT | NEWSHIFT | S/N | NAME | SHIFT | NEWSHIFT | S/N |
| 0 | 12680061 | 0.488107 | 0.00000 | 123.483 | 12680062 | -0.00167445 | 0.489781 | 89.0329 |
| 1 | 12680065 | 0.488021 | 8.60095e-05 | 187.057 | 12680066 | -0.00112515 | 0.489232 | 185.272 |
| 2 | 12680064 | 0.487567 | 0.000539988 | 173.290 | 12680063 | -0.00126698 | 0.489374 | 164.614 |
| 3 | 12680060 | 0.487208 | 0.000898987 | 88.0848 | 12680059 | 0.00000 | 0.488107 | 88.6253 |