| Red | Green | Blue | |
| z | 17.64 | ||
| znorm | Inf | ||
| sky | -Inf | -Inf | -Inf |
| S/N | 22.5 | 40.9 | 41.9 |
| S/N(c) | 0.0 | 0.0 | 0.0 |
| SN(E/C) |
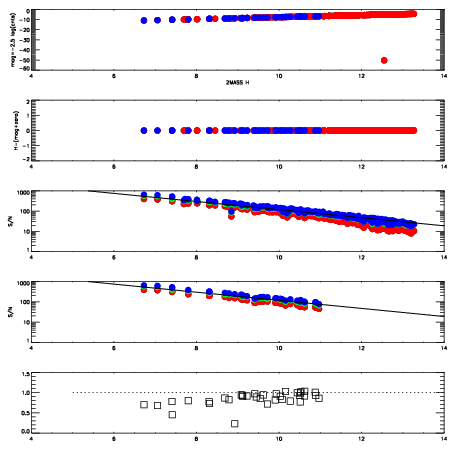
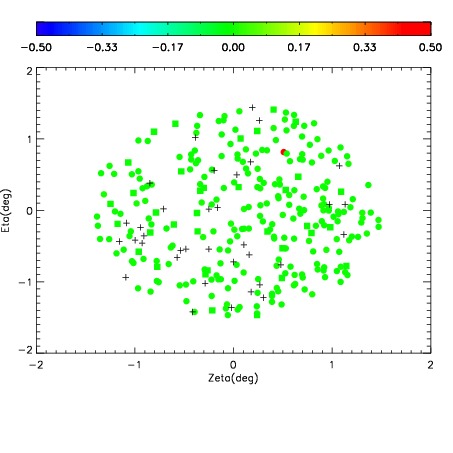
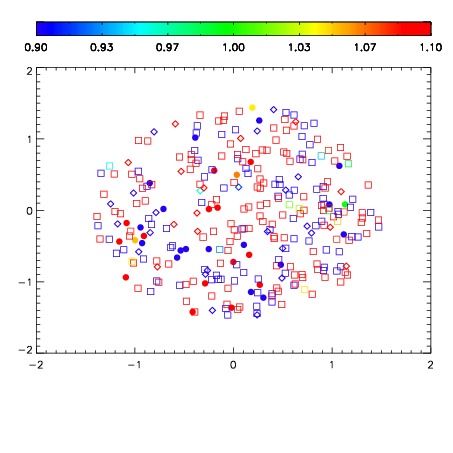
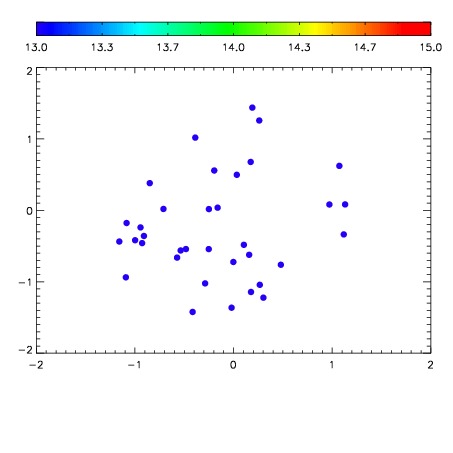

| Frame | Nreads | Zeropoints | Mag plots | Spatial mag deviation | Spatial sky 16325A emission deviations (filled: sky, open: star) | Spatial sky continuum emission | Spatial sky telluric CO2 absorption deviations (filled: H < 10) | |||||||||||||||||||||||
| 0 | 0 |
|
|
|
|
|
|
| IPAIR | NAME | SHIFT | NEWSHIFT | S/N | NAME | SHIFT | NEWSHIFT | S/N |
| 0 | 12170016 | 0.496273 | 0.00000 | 150.915 | 12170015 | 0.000477094 | 0.495796 | 149.909 |
| 1 | 12170012 | 0.495714 | 0.000559002 | 161.675 | 12170018 | 0.00166781 | 0.494605 | 160.180 |
| 2 | 12170013 | 0.496076 | 0.000197023 | 160.459 | 12170014 | 0.000320026 | 0.495953 | 155.374 |
| 3 | 12170017 | 0.495985 | 0.000288010 | 158.500 | 12170011 | 0.00000 | 0.496273 | 153.476 |