| Red | Green | Blue | |
| z | 17.64 | ||
| znorm | Inf | ||
| sky | -Inf | -Inf | -Inf |
| S/N | 23.2 | 39.3 | 42.4 |
| S/N(c) | 0.0 | 0.0 | 0.0 |
| SN(E/C) |

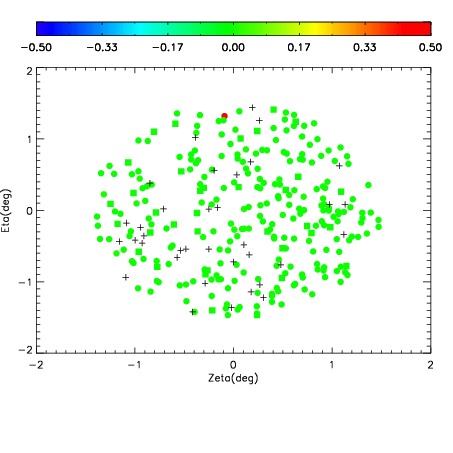
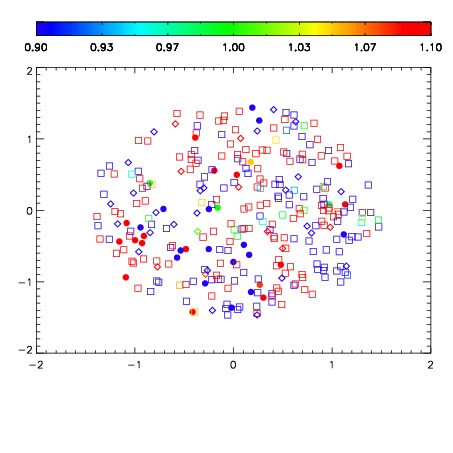

| Frame | Nreads | Zeropoints | Mag plots | Spatial mag deviation | Spatial sky 16325A emission deviations (filled: sky, open: star) | Spatial sky continuum emission | Spatial sky telluric CO2 absorption deviations (filled: H < 10) | |||||||||||||||||||||||
| 0 | 0 |
|
|
|
|
|
|
| IPAIR | NAME | SHIFT | NEWSHIFT | S/N | NAME | SHIFT | NEWSHIFT | S/N |
| 0 | 12630013 | 0.484323 | 0.00000 | 117.847 | 12630014 | 0.000125962 | 0.484197 | 105.915 |
| 1 | 12630016 | 0.483165 | 0.00115800 | 175.690 | 12630011 | 0.00000 | 0.484323 | 187.577 |
| 2 | 12630017 | 0.483492 | 0.000831008 | 171.972 | 12630018 | 0.000370539 | 0.483952 | 169.540 |
| 3 | 12630012 | 0.484227 | 9.59933e-05 | 126.757 | 12630015 | 5.87467e-05 | 0.484264 | 155.991 |