| Red | Green | Blue | |
| z | 17.64 | ||
| znorm | Inf | ||
| sky | -NaN | -Inf | -Inf |
| S/N | 26.7 | 46.6 | 51.8 |
| S/N(c) | 0.0 | 0.0 | 0.0 |
| SN(E/C) |


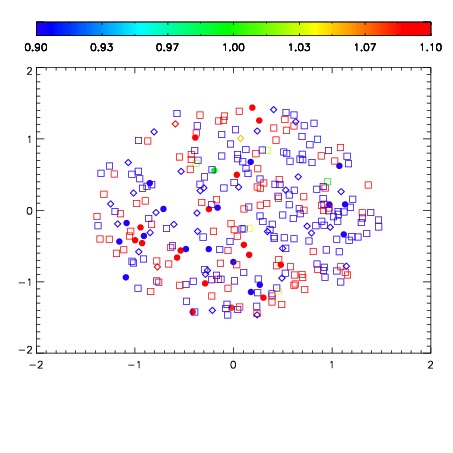
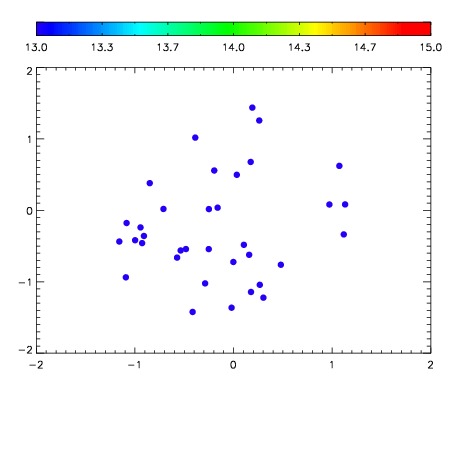

| Frame | Nreads | Zeropoints | Mag plots | Spatial mag deviation | Spatial sky 16325A emission deviations (filled: sky, open: star) | Spatial sky continuum emission | Spatial sky telluric CO2 absorption deviations (filled: H < 10) | |||||||||||||||||||||||
| 0 | 0 |
|
|
|
|
|
|
| IPAIR | NAME | SHIFT | NEWSHIFT | S/N | NAME | SHIFT | NEWSHIFT | S/N |
| 0 | 12690028 | 0.486335 | 0.00000 | 161.951 | 12690029 | -0.00777306 | 0.494108 | 181.500 |
| 1 | 12690024 | 0.482584 | 0.00375101 | 189.133 | 12690025 | -0.00324245 | 0.489577 | 196.895 |
| 2 | 12690027 | 0.485213 | 0.00112200 | 186.688 | 12690022 | 0.00000 | 0.486335 | 196.474 |
| 3 | 12690023 | 0.483582 | 0.00275302 | 159.851 | 12690026 | -0.00298012 | 0.489315 | 179.042 |