| Red | Green | Blue | |
| z | 17.64 | ||
| znorm | Inf | ||
| sky | -Inf | -Inf | -Inf |
| S/N | 22.6 | 39.8 | 42.2 |
| S/N(c) | 0.0 | 0.0 | 0.0 |
| SN(E/C) |
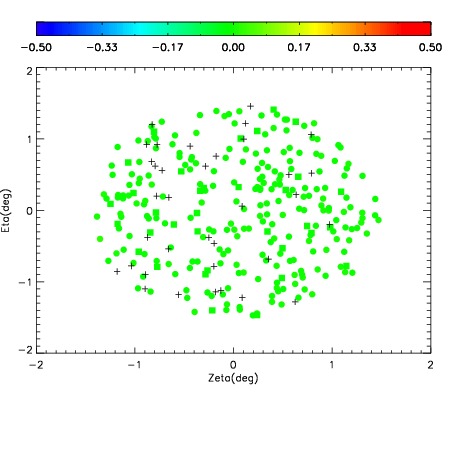
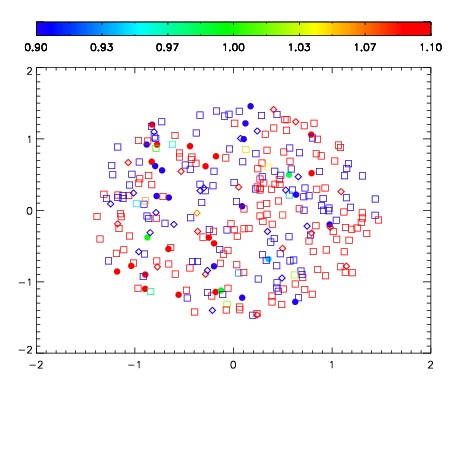
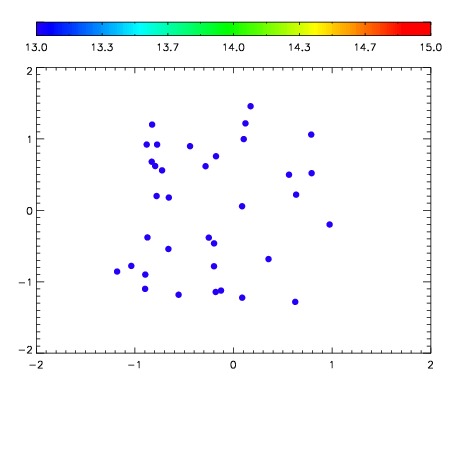

| Frame | Nreads | Zeropoints | Mag plots | Spatial mag deviation | Spatial sky 16325A emission deviations (filled: sky, open: star) | Spatial sky continuum emission | Spatial sky telluric CO2 absorption deviations (filled: H < 10) | |||||||||||||||||||||||
| 0 | 0 |
|
|
|
|
|
|
| IPAIR | NAME | SHIFT | NEWSHIFT | S/N | NAME | SHIFT | NEWSHIFT | S/N |
| 0 | 12190049 | 0.505011 | 0.00000 | 214.568 | 12190048 | 0.00197156 | 0.503039 | 220.954 |
| 1 | 12190050 | 0.504957 | 5.40018e-05 | 224.673 | 12190051 | -0.000640959 | 0.505652 | 223.269 |
| 2 | 12190046 | 0.504567 | 0.000443995 | 212.795 | 12190047 | 0.00134767 | 0.503663 | 214.456 |
| 3 | 12190045 | 0.503879 | 0.00113201 | 209.189 | 12190044 | 0.00000 | 0.505011 | 186.607 |