| Red | Green | Blue | |
| z | 17.64 | ||
| znorm | Inf | ||
| sky | -Inf | -Inf | -Inf |
| S/N | 28.1 | 47.6 | 50.0 |
| S/N(c) | 0.0 | 0.0 | 0.0 |
| SN(E/C) |
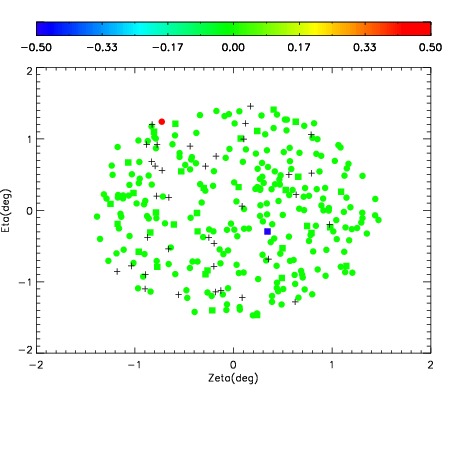
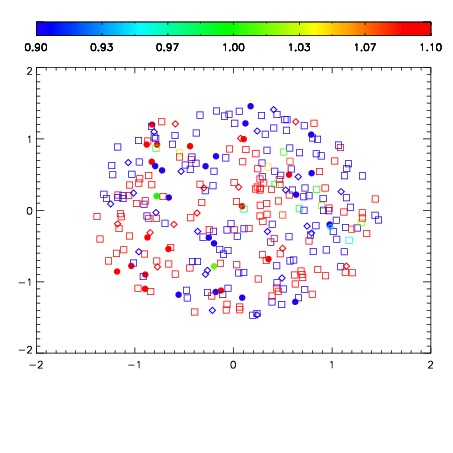
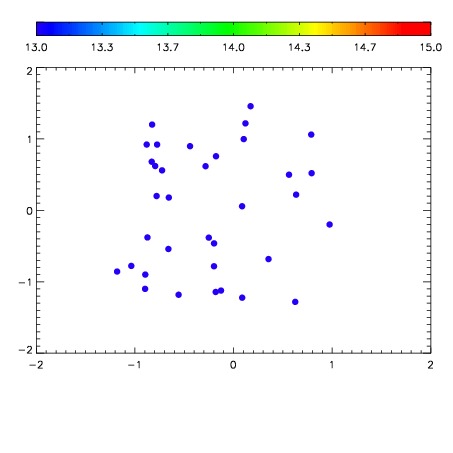

| Frame | Nreads | Zeropoints | Mag plots | Spatial mag deviation | Spatial sky 16325A emission deviations (filled: sky, open: star) | Spatial sky continuum emission | Spatial sky telluric CO2 absorption deviations (filled: H < 10) | |||||||||||||||||||||||
| 0 | 0 |
|
|
|
|
|
|
| IPAIR | NAME | SHIFT | NEWSHIFT | S/N | NAME | SHIFT | NEWSHIFT | S/N |
| 0 | 12370016 | 0.495061 | 0.00000 | 205.007 | 12370018 | 0.00392107 | 0.491140 | 207.251 |
| 1 | 12370012 | 0.493123 | 0.00193802 | 203.595 | 12370015 | 0.00513032 | 0.489931 | 202.646 |
| 2 | 12370013 | 0.493866 | 0.00119501 | 200.241 | 12370011 | 0.00000 | 0.495061 | 200.686 |
| 3 | 12370017 | 0.494925 | 0.000136018 | 199.967 | 12370014 | 0.00528870 | 0.489772 | 196.916 |