| Red | Green | Blue | |
| z | 17.64 | ||
| znorm | Inf | ||
| sky | -Inf | -Inf | -Inf |
| S/N | 28.9 | 50.5 | 53.8 |
| S/N(c) | 0.0 | 0.0 | 0.0 |
| SN(E/C) |
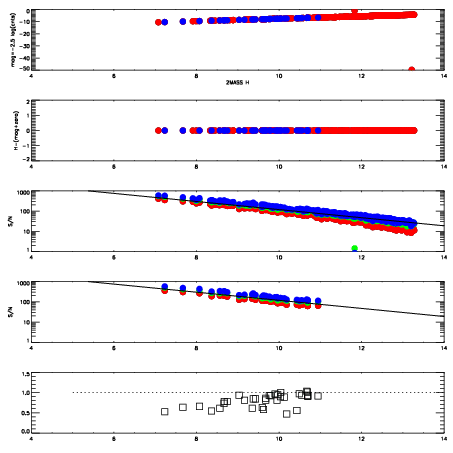
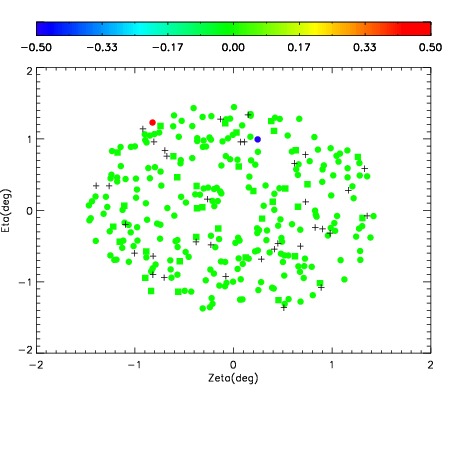
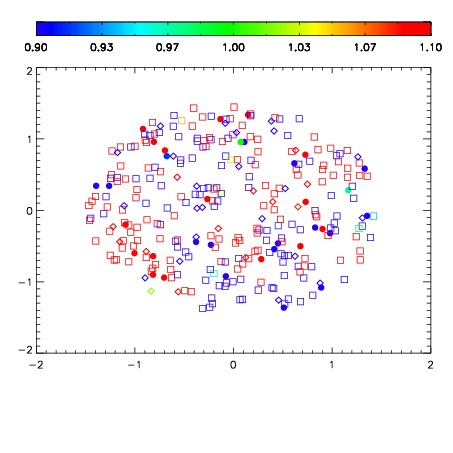
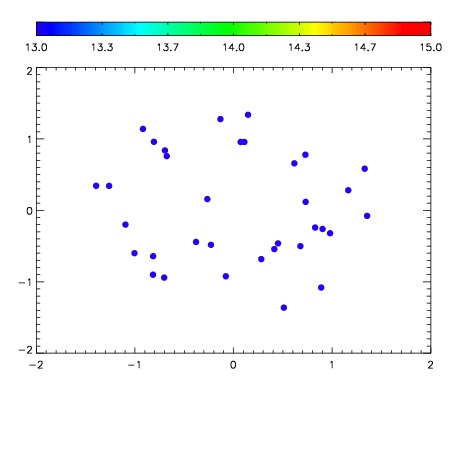

| Frame | Nreads | Zeropoints | Mag plots | Spatial mag deviation | Spatial sky 16325A emission deviations (filled: sky, open: star) | Spatial sky continuum emission | Spatial sky telluric CO2 absorption deviations (filled: H < 10) | |||||||||||||||||||||||
| 0 | 0 |
|
|
|
|
|
|
| IPAIR | NAME | SHIFT | NEWSHIFT | S/N | NAME | SHIFT | NEWSHIFT | S/N |
| 0 | 12680076 | 0.487662 | 0.00000 | 204.824 | 12680077 | -0.000777173 | 0.488439 | 195.539 |
| 1 | 12680071 | 0.485159 | 0.00250298 | 217.251 | 12680073 | -0.00192222 | 0.489584 | 212.765 |
| 2 | 12680072 | 0.486175 | 0.00148699 | 212.406 | 12680074 | -0.00211132 | 0.489773 | 210.078 |
| 3 | 12680075 | 0.486797 | 0.000864983 | 208.375 | 12680070 | 0.00000 | 0.487662 | 206.812 |