| Red | Green | Blue | |
| z | 17.64 | ||
| znorm | Inf | ||
| sky | -Inf | -Inf | -Inf |
| S/N | 31.9 | 52.7 | 59.0 |
| S/N(c) | 0.0 | 0.0 | 0.0 |
| SN(E/C) |
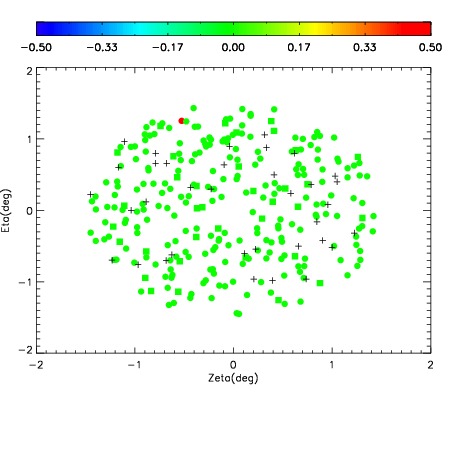
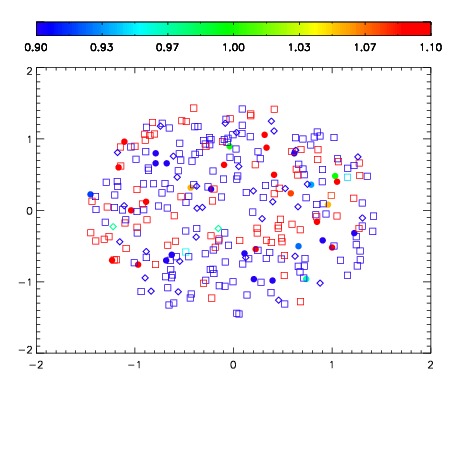
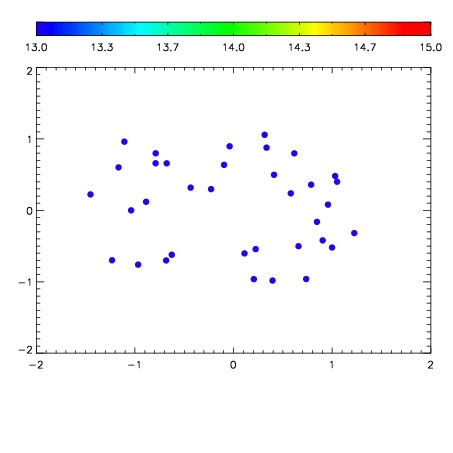

| Frame | Nreads | Zeropoints | Mag plots | Spatial mag deviation | Spatial sky 16325A emission deviations (filled: sky, open: star) | Spatial sky continuum emission | Spatial sky telluric CO2 absorption deviations (filled: H < 10) | |||||||||||||||||||||||
| 0 | 0 |
|
|
|
|
|
|
| IPAIR | NAME | SHIFT | NEWSHIFT | S/N | NAME | SHIFT | NEWSHIFT | S/N |
| 0 | 12560072 | 0.482928 | 0.00000 | 229.887 | 12560074 | -0.00333651 | 0.486265 | 225.457 |
| 1 | 12560075 | 0.481180 | 0.00174800 | 232.237 | 12560077 | 0.000150272 | 0.482778 | 231.278 |
| 2 | 12560076 | 0.481799 | 0.00112900 | 230.698 | 12560073 | -0.00268430 | 0.485612 | 225.825 |
| 3 | 12560071 | 0.482911 | 1.70171e-05 | 227.748 | 12560070 | 0.00000 | 0.482928 | 220.329 |