| Red | Green | Blue | |
| z | 17.64 | ||
| znorm | Inf | ||
| sky | -Inf | -Inf | -Inf |
| S/N | 18.1 | 33.9 | 38.9 |
| S/N(c) | 0.0 | 0.0 | 0.0 |
| SN(E/C) |
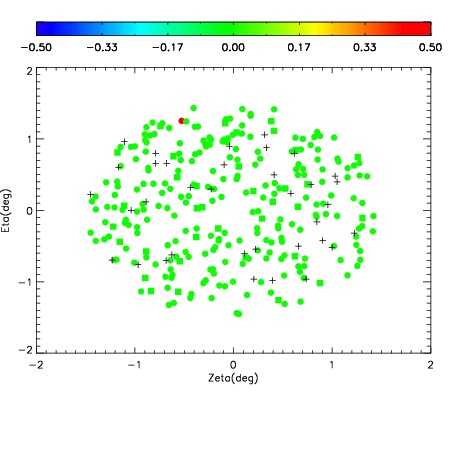
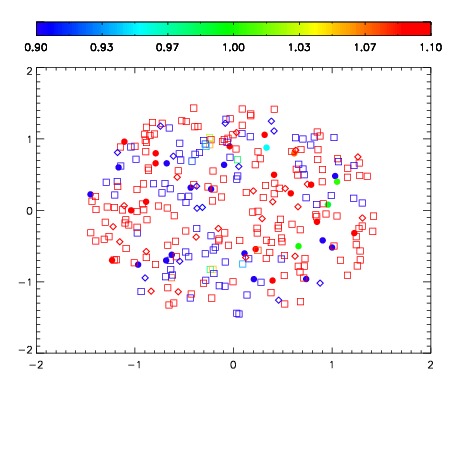
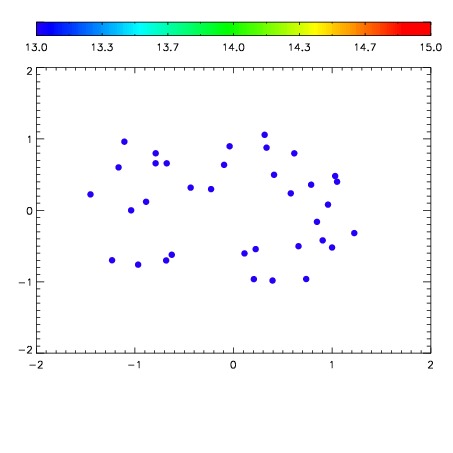

| Frame | Nreads | Zeropoints | Mag plots | Spatial mag deviation | Spatial sky 16325A emission deviations (filled: sky, open: star) | Spatial sky continuum emission | Spatial sky telluric CO2 absorption deviations (filled: H < 10) | |||||||||||||||||||||||
| 0 | 0 |
|
|
|
|
|
|
| IPAIR | NAME | SHIFT | NEWSHIFT | S/N | NAME | SHIFT | NEWSHIFT | S/N |
| 0 | 12660072 | 0.487733 | 0.00000 | 153.170 | 12660073 | -0.000381787 | 0.488115 | 150.348 |
| 1 | 12660076 | 0.487621 | 0.000111997 | 154.092 | 12660077 | 0.000456959 | 0.487276 | 158.740 |
| 2 | 12660071 | 0.486528 | 0.00120500 | 145.071 | 12660074 | -0.000830033 | 0.488563 | 141.465 |
| 3 | 12660075 | 0.486706 | 0.00102702 | 143.862 | 12660070 | 0.00000 | 0.487733 | 113.950 |