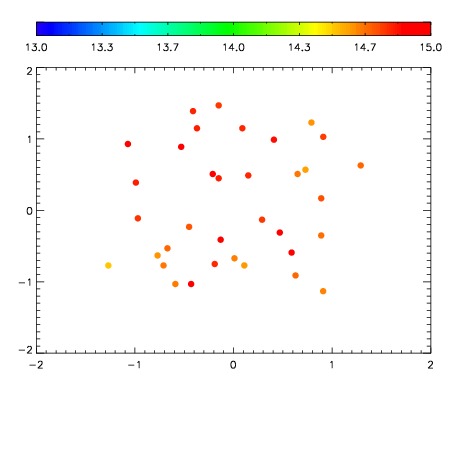
| Frame | Nreads | Zeropoints | Mag plots
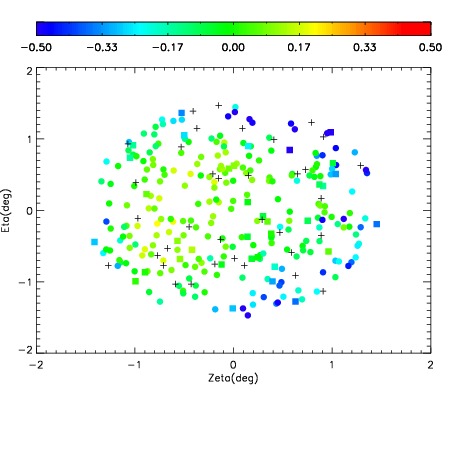
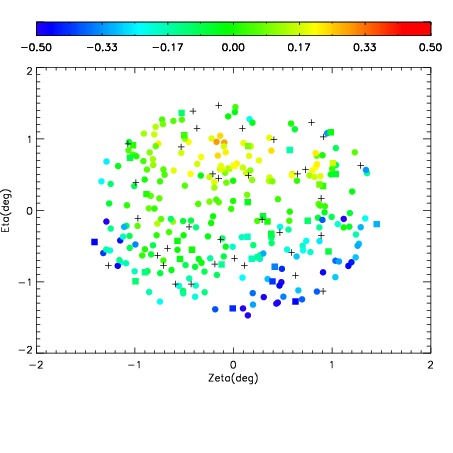
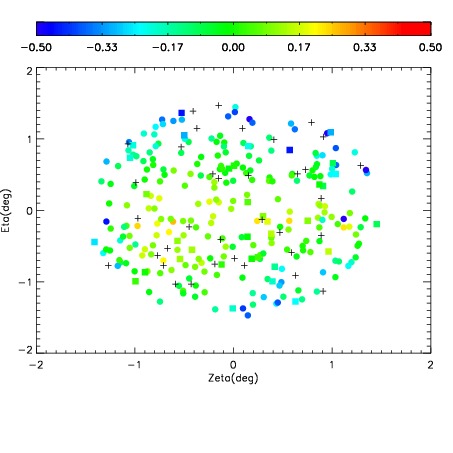
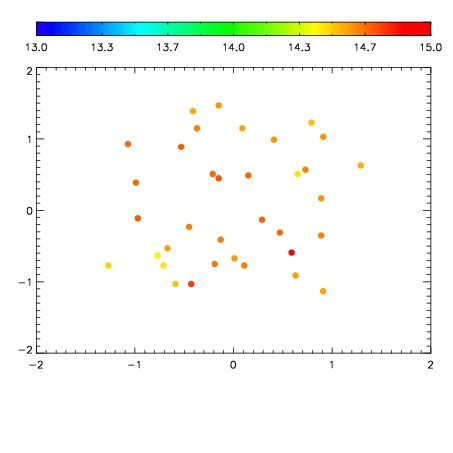
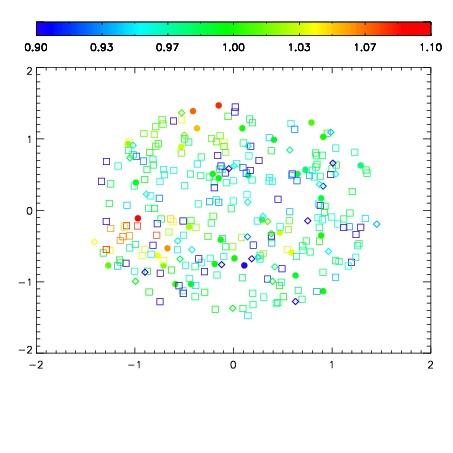
| Spatial mag deviation
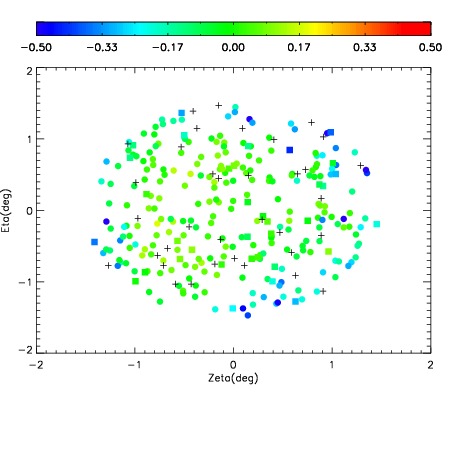
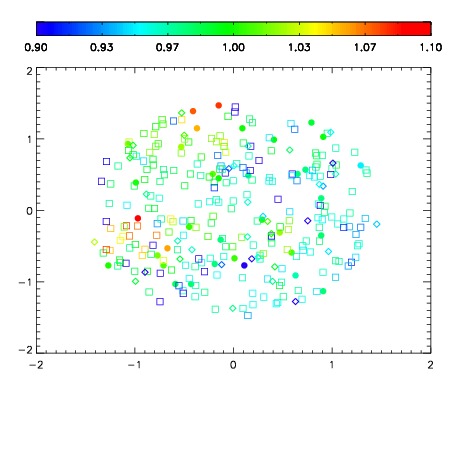
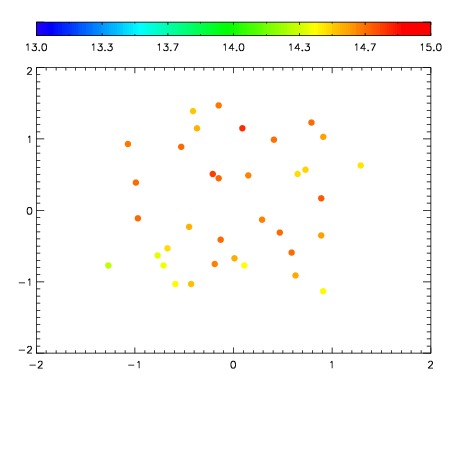
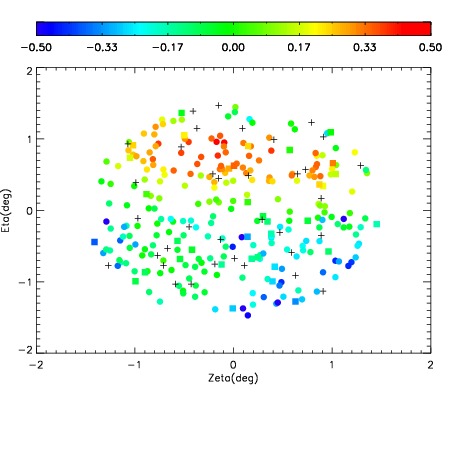
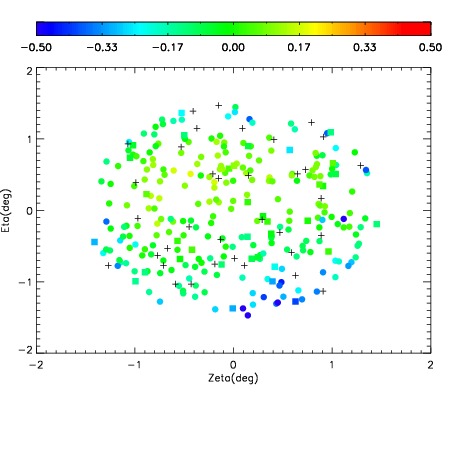
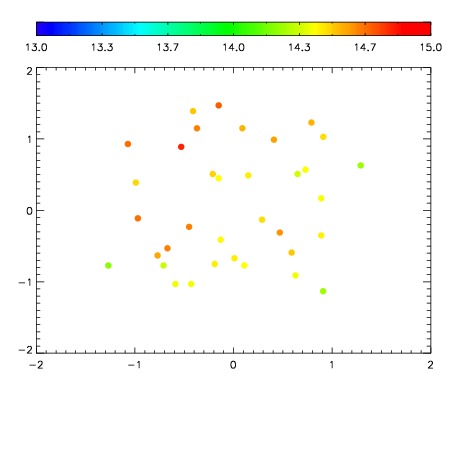
| Spatial sky 16325A emission deviations (filled: sky, open: star)
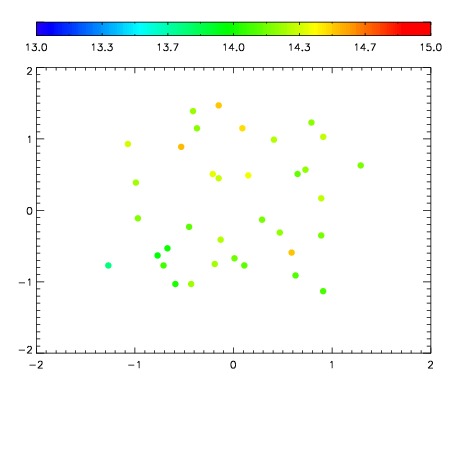
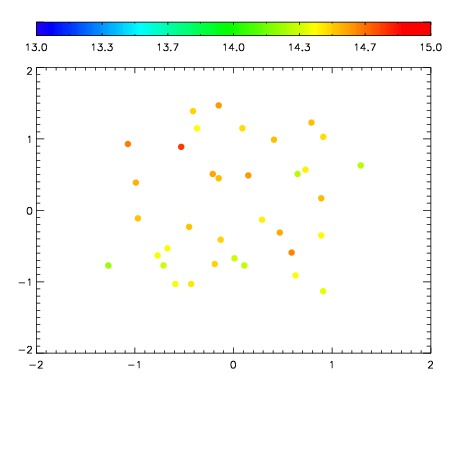
| Spatial sky continuum emission
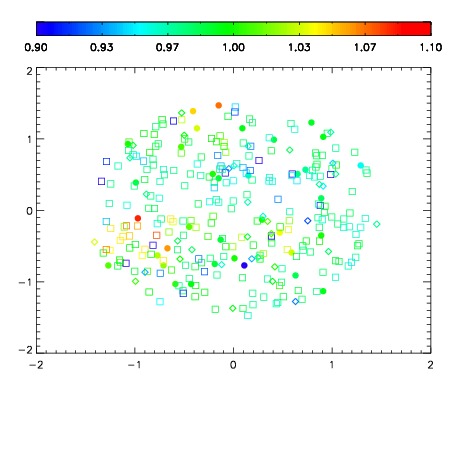
| Spatial sky telluric CO2 absorption deviations (filled: H < 10)
|
| 12710039
| 47
| | Red | Green | Blue
| | z | | 18.98
| | znorm | | 14.80
| | sky | 14.7 | 14.2 | 14.4
| | S/N | 13.7 | 23.0 | 26.5
| | S/N(c) | 12.0 | 21.5 | 25.0
| | SN(E/C) 0.46
|
| 
| 
| 
| 
| 
|
| 12710040
| 47
| | Red | Green | Blue
| | z | | 18.97
| | znorm | | 14.79
| | sky | 14.8 | 14.5 | 14.7
| | S/N | 13.8 | 23.1 | 25.2
| | S/N(c) | 11.6 | 21.4 | 23.8
| | SN(E/C) 0.47
|
| 
| 
| 
| 
| 
|
| 12710041
| 47
| | Red | Green | Blue
| | z | | 18.39
| | znorm | | 14.21
| | sky | 14.6 | 14.5 | 15.0
| | S/N | 8.7 | 15.7 | 18.8
| | S/N(c) | 7.4 | 14.5 | 17.2
| | SN(E/C) 0.54
|
| 
| 
| 
| 
| 
|
| 12710042
| 47
| | Red | Green | Blue
| | z | | 17.67
| | znorm | | 13.49
| | sky | 14.6 | 14.6 | 15.2
| | S/N | 5.0 | 10.3 | 14.5
| | S/N(c) | 4.4 | 9.7 | 13.1
| | SN(E/C) 0.64
|
| 
| 
| 
| 
| 
|
| 12710043
| 47
| | Red | Green | Blue
| | z | | 17.31
| | znorm | | 13.13
| | sky | 15.1 | 14.8 | 15.1
| | S/N | 3.6 | 7.7 | 10.7
| | S/N(c) | 3.1 | 7.0 | 9.6
| | SN(E/C) 0.69
|
| 
| 
| 
| 
| 
|
| 12710044
| 47
| | Red | Green | Blue
| | z | | 17.46
| | znorm | | 13.28
| | sky | 14.8 | 14.6 | 15.2
| | S/N | 4.5 | 9.5 | 12.4
| | S/N(c) | 4.0 | 8.6 | 11.2
| | SN(E/C) 0.67
|
| 
| 
| 
| 
| 
|
| 12710045
| 47
| | Red | Green | Blue
| | z | | 18.98
| | znorm | | 14.80
| | sky | 14.6 | 14.5 | 14.7
| | S/N | 13.6 | 23.5 | 25.8
| | S/N(c) | 11.6 | 21.5 | 24.3
| | SN(E/C) 0.41
|
| 
| 
| 
| 
| 
|
| 12710046
| 47
| | Red | Green | Blue
| | z | | 19.09
| | znorm | | 14.91
| | sky | 14.4 | 14.5 | 14.6
| | S/N | 14.6 | 24.4 | 26.8
| | S/N(c) | 12.8 | 22.7 | 25.4
| | SN(E/C) 0.38
|
| 
| 
| 
| 
| 
|

