| Red | Green | Blue | |
| z | 17.64 | ||
| znorm | Inf | ||
| sky | -Inf | -Inf | -Inf |
| S/N | 18.0 | 34.2 | 38.6 |
| S/N(c) | 0.0 | 0.0 | 0.0 |
| SN(E/C) |


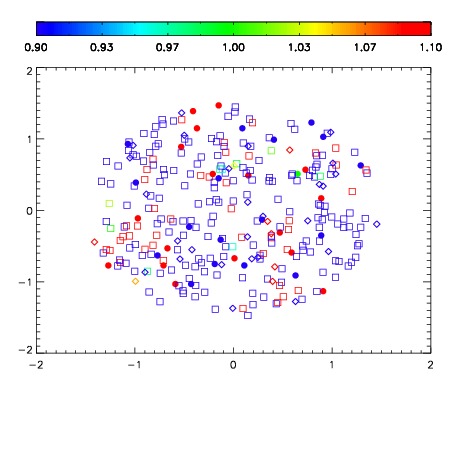
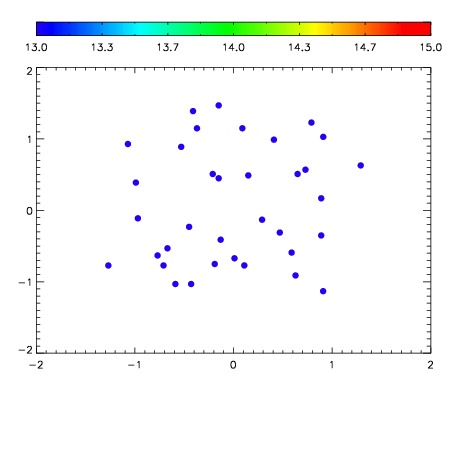

| Frame | Nreads | Zeropoints | Mag plots | Spatial mag deviation | Spatial sky 16325A emission deviations (filled: sky, open: star) | Spatial sky continuum emission | Spatial sky telluric CO2 absorption deviations (filled: H < 10) | |||||||||||||||||||||||
| 0 | 0 |
|
|
|
|
|
|
| IPAIR | NAME | SHIFT | NEWSHIFT | S/N | NAME | SHIFT | NEWSHIFT | S/N |
| 0 | 12710045 | 0.488734 | 0.00000 | 209.268 | 12710046 | -0.00150364 | 0.490238 | 213.604 |
| 1 | 12710040 | 0.487918 | 0.000816017 | 196.614 | 12710039 | 0.00000 | 0.488734 | 204.658 |
| 2 | 12710041 | 0.488368 | 0.000366002 | 147.502 | 12710042 | -0.000572901 | 0.489307 | 111.176 |
| 3 | 12710044 | 0.488489 | 0.000245005 | 104.848 | 12710043 | -0.000133320 | 0.488867 | 94.7957 |