| Red | Green | Blue | |
| z | 17.64 | ||
| znorm | Inf | ||
| sky | -Inf | -Inf | -Inf |
| S/N | 29.4 | 51.2 | 56.8 |
| S/N(c) | 0.0 | 0.0 | 0.0 |
| SN(E/C) |

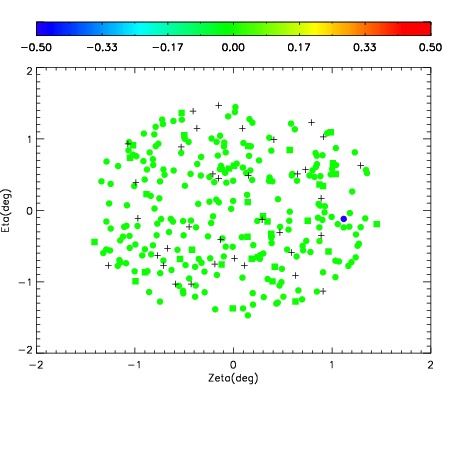
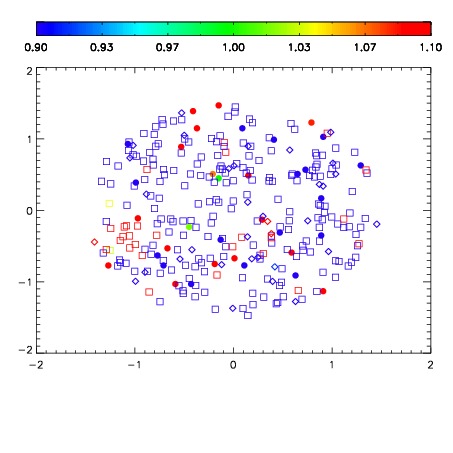


| Frame | Nreads | Zeropoints | Mag plots | Spatial mag deviation | Spatial sky 16325A emission deviations (filled: sky, open: star) | Spatial sky continuum emission | Spatial sky telluric CO2 absorption deviations (filled: H < 10) | |||||||||||||||||||||||
| 0 | 0 |
|
|
|
|
|
|
| IPAIR | NAME | SHIFT | NEWSHIFT | S/N | NAME | SHIFT | NEWSHIFT | S/N |
| 0 | 12730075 | 0.484269 | 0.00000 | 84.1367 | 12730074 | -0.000305548 | 0.484575 | 146.003 |
| 1 | 12730068 | 0.483440 | 0.000828981 | 229.463 | 12730069 | -0.000343618 | 0.484613 | 233.498 |
| 2 | 12730072 | 0.483465 | 0.000804007 | 226.852 | 12730070 | -0.000226743 | 0.484496 | 228.715 |
| 3 | 12730071 | 0.483327 | 0.000941992 | 224.725 | 12730066 | 0.00000 | 0.484269 | 222.929 |
| 4 | 12730067 | 0.480889 | 0.00338000 | 224.594 | 12730073 | -0.00179806 | 0.486067 | 217.132 |