| Red | Green | Blue | |
| z | 17.64 | ||
| znorm | Inf | ||
| sky | -NaN | -Inf | -Inf |
| S/N | 23.8 | 42.8 | 44.9 |
| S/N(c) | 0.0 | 0.0 | 0.0 |
| SN(E/C) |
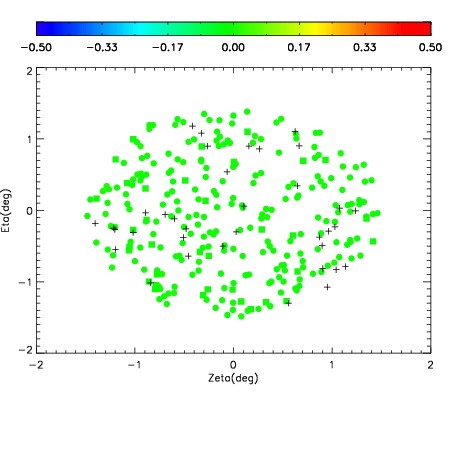
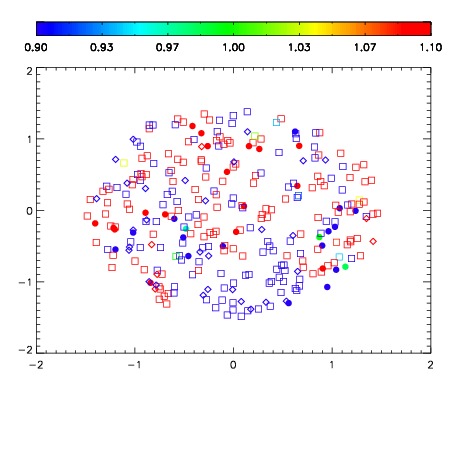
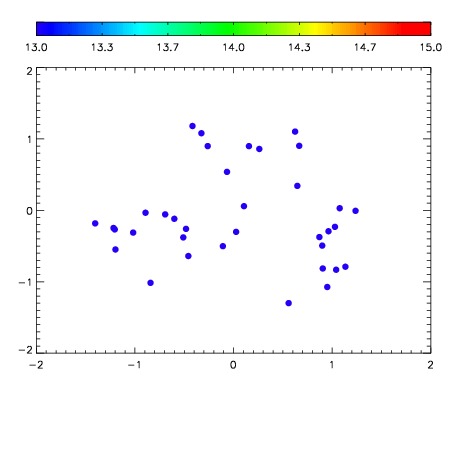

| Frame | Nreads | Zeropoints | Mag plots | Spatial mag deviation | Spatial sky 16325A emission deviations (filled: sky, open: star) | Spatial sky continuum emission | Spatial sky telluric CO2 absorption deviations (filled: H < 10) | |||||||||||||||||||||||
| 0 | 0 |
|
|
|
|
|
|
| IPAIR | NAME | SHIFT | NEWSHIFT | S/N | NAME | SHIFT | NEWSHIFT | S/N |
| 0 | 12570050 | 0.492334 | 0.00000 | 180.851 | 12570047 | -0.00347242 | 0.495806 | 171.757 |
| 1 | 12570046 | 0.490024 | 0.00231001 | 182.389 | 12570044 | 0.00000 | 0.492334 | 174.823 |
| 2 | 12570045 | 0.490536 | 0.00179800 | 169.196 | 12570048 | -0.00306590 | 0.495400 | 171.301 |
| 3 | 12570049 | 0.490893 | 0.00144100 | 150.123 | 12570051 | -0.00264094 | 0.494975 | 158.338 |