| Red | Green | Blue | |
| z | 17.64 | ||
| znorm | Inf | ||
| sky | -Inf | -Inf | -Inf |
| S/N | 24.1 | 43.4 | 44.5 |
| S/N(c) | 0.0 | 0.0 | 0.0 |
| SN(E/C) |
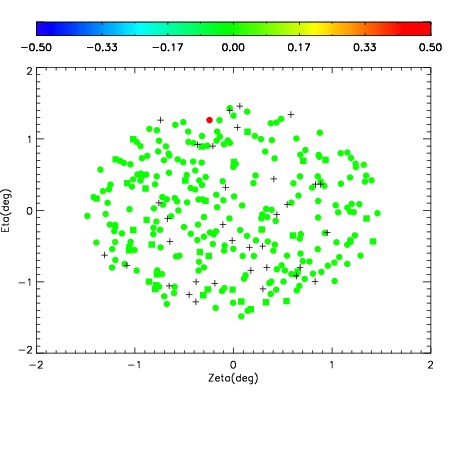
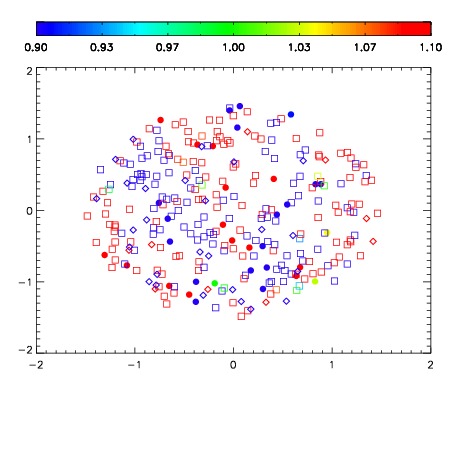
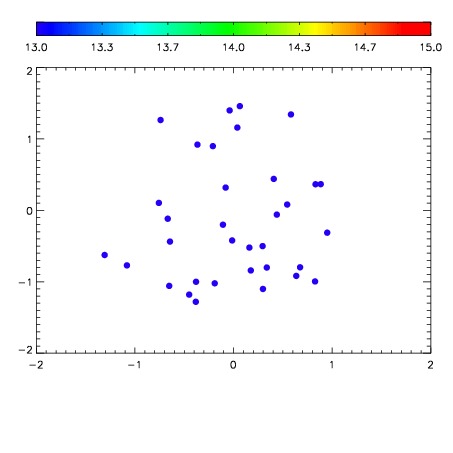

| Frame | Nreads | Zeropoints | Mag plots | Spatial mag deviation | Spatial sky 16325A emission deviations (filled: sky, open: star) | Spatial sky continuum emission | Spatial sky telluric CO2 absorption deviations (filled: H < 10) | |||||||||||||||||||||||
| 0 | 0 |
|
|
|
|
|
|
| IPAIR | NAME | SHIFT | NEWSHIFT | S/N | NAME | SHIFT | NEWSHIFT | S/N |
| 0 | 12570060 | 0.490269 | 0.00000 | 200.516 | 12570062 | -0.00135471 | 0.491624 | 194.374 |
| 1 | 12570061 | 0.490180 | 8.90195e-05 | 194.001 | 12570059 | 0.000228340 | 0.490041 | 190.587 |
| 2 | 12570057 | 0.490189 | 8.00192e-05 | 182.686 | 12570058 | 0.000220110 | 0.490049 | 171.531 |
| 3 | 12570056 | 0.489402 | 0.000867009 | 160.713 | 12570055 | 0.00000 | 0.490269 | 159.716 |