| Red | Green | Blue | |
| z | 17.64 | ||
| znorm | Inf | ||
| sky | -Inf | -Inf | -Inf |
| S/N | 26.3 | 45.0 | 48.8 |
| S/N(c) | 0.0 | 0.0 | 0.0 |
| SN(E/C) |
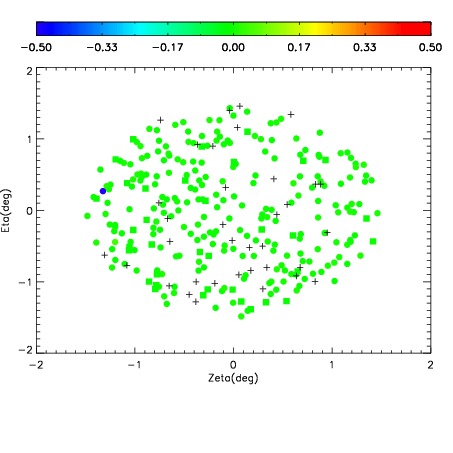
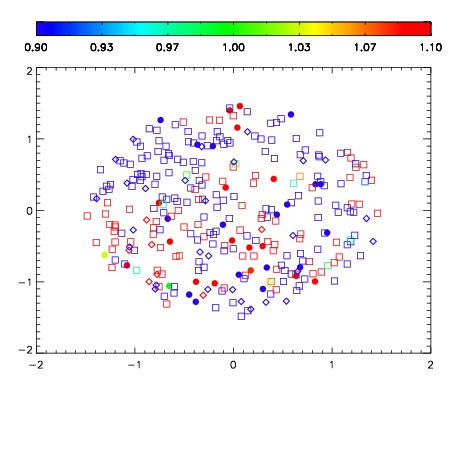
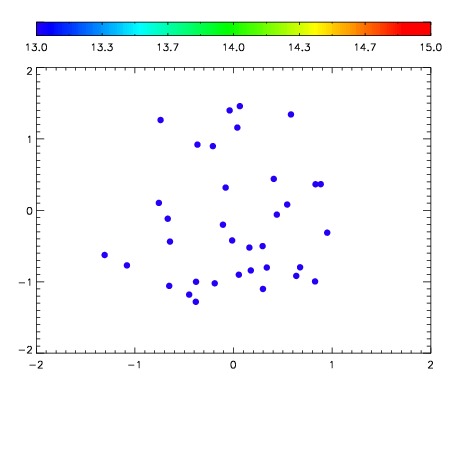

| Frame | Nreads | Zeropoints | Mag plots | Spatial mag deviation | Spatial sky 16325A emission deviations (filled: sky, open: star) | Spatial sky continuum emission | Spatial sky telluric CO2 absorption deviations (filled: H < 10) | |||||||||||||||||||||||
| 0 | 0 |
|
|
|
|
|
|
| IPAIR | NAME | SHIFT | NEWSHIFT | S/N | NAME | SHIFT | NEWSHIFT | S/N |
| 0 | 12620075 | 0.482824 | 0.00000 | 88.7593 | 12620073 | -0.000839049 | 0.483663 | 98.2499 |
| 1 | 12620071 | 0.481460 | 0.00136399 | 204.338 | 12620069 | -0.00219373 | 0.485018 | 202.731 |
| 2 | 12620068 | 0.480486 | 0.00233799 | 201.954 | 12620070 | -0.00270990 | 0.485534 | 201.665 |
| 3 | 12620067 | 0.480411 | 0.00241300 | 201.862 | 12620066 | 0.00000 | 0.482824 | 197.823 |
| 4 | 12620072 | 0.482523 | 0.000301003 | 173.126 | 12620074 | -0.00118348 | 0.484007 | 123.658 |