| Red | Green | Blue | |
| z | 17.64 | ||
| znorm | Inf | ||
| sky | -Inf | -Inf | -Inf |
| S/N | 27.9 | 47.1 | 53.5 |
| S/N(c) | 0.0 | 0.0 | 0.0 |
| SN(E/C) |
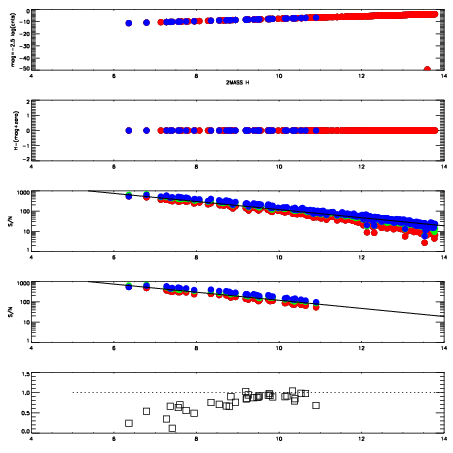
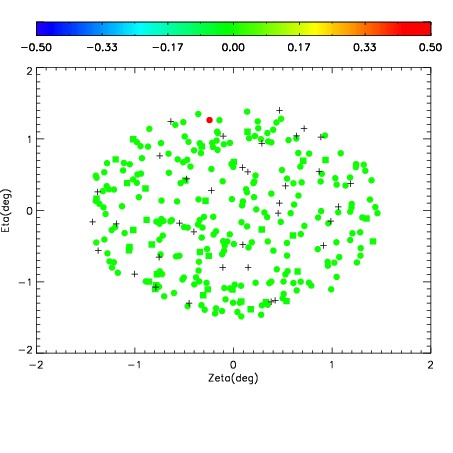
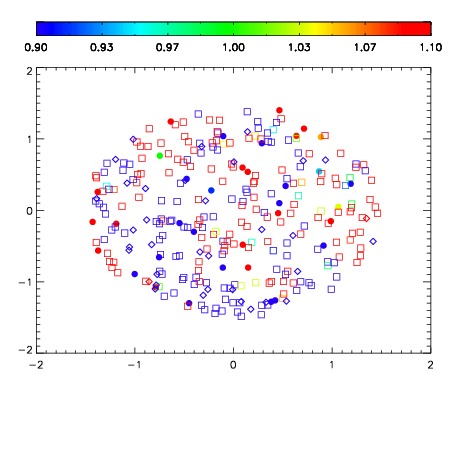
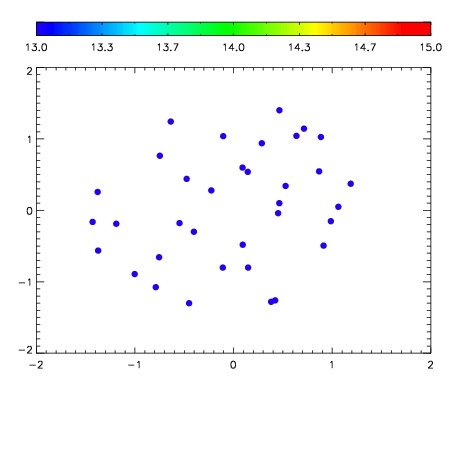

| Frame | Nreads | Zeropoints | Mag plots | Spatial mag deviation | Spatial sky 16325A emission deviations (filled: sky, open: star) | Spatial sky continuum emission | Spatial sky telluric CO2 absorption deviations (filled: H < 10) | |||||||||||||||||||||||
| 0 | 0 |
|
|
|
|
|
|
| IPAIR | NAME | SHIFT | NEWSHIFT | S/N | NAME | SHIFT | NEWSHIFT | S/N |
| 0 | 12570067 | 0.490409 | 0.00000 | 192.590 | 12570066 | 0.00000 | 0.490409 | 183.779 |
| 1 | 12570072 | 0.488885 | 0.00152400 | 208.904 | 12570070 | -0.000905692 | 0.491315 | 205.912 |
| 2 | 12570068 | 0.490369 | 3.99947e-05 | 202.852 | 12570069 | -0.000839134 | 0.491248 | 204.452 |
| 3 | 12570071 | 0.489347 | 0.00106198 | 201.726 | 12570073 | -0.00263981 | 0.493049 | 199.511 |