| Red | Green | Blue | |
| z | 17.64 | ||
| znorm | Inf | ||
| sky | -Inf | -Inf | -Inf |
| S/N | 30.5 | 47.3 | 52.7 |
| S/N(c) | 0.0 | 0.0 | 0.0 |
| SN(E/C) |
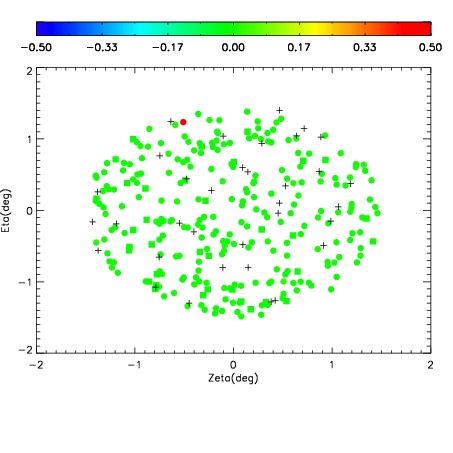
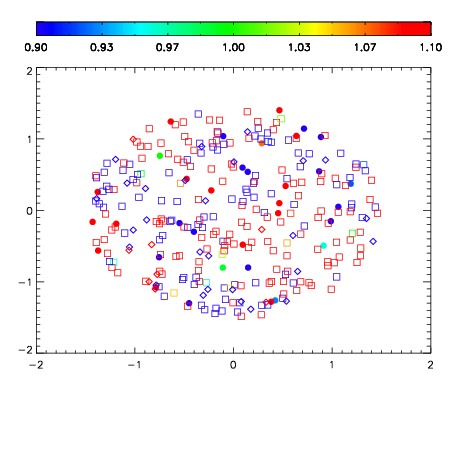
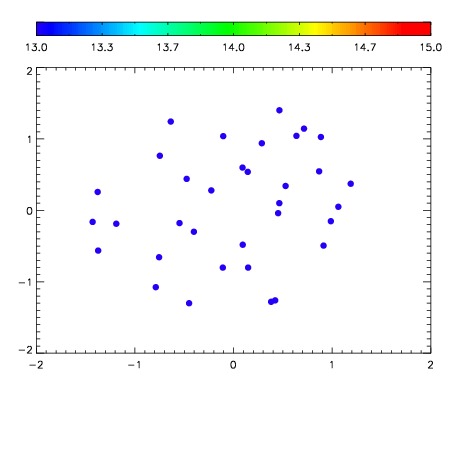

| Frame | Nreads | Zeropoints | Mag plots | Spatial mag deviation | Spatial sky 16325A emission deviations (filled: sky, open: star) | Spatial sky continuum emission | Spatial sky telluric CO2 absorption deviations (filled: H < 10) | |||||||||||||||||||||||
| 0 | 0 |
|
|
|
|
|
|
| IPAIR | NAME | SHIFT | NEWSHIFT | S/N | NAME | SHIFT | NEWSHIFT | S/N |
| 0 | 12610064 | 0.488582 | 0.00000 | 193.434 | 12610063 | 0.00000 | 0.488582 | 196.961 |
| 1 | 12610069 | 0.484044 | 0.00453800 | 201.458 | 12610067 | -0.000712321 | 0.489294 | 199.697 |
| 2 | 12610068 | 0.484766 | 0.00381598 | 200.779 | 12610070 | -0.000526326 | 0.489108 | 198.209 |
| 3 | 12610065 | 0.488421 | 0.000160992 | 198.033 | 12610066 | -0.000376599 | 0.488959 | 197.657 |