| Red | Green | Blue | |
| z | 17.64 | ||
| znorm | Inf | ||
| sky | -Inf | -Inf | -Inf |
| S/N | 27.3 | 45.9 | 52.4 |
| S/N(c) | 0.0 | 0.0 | 0.0 |
| SN(E/C) |

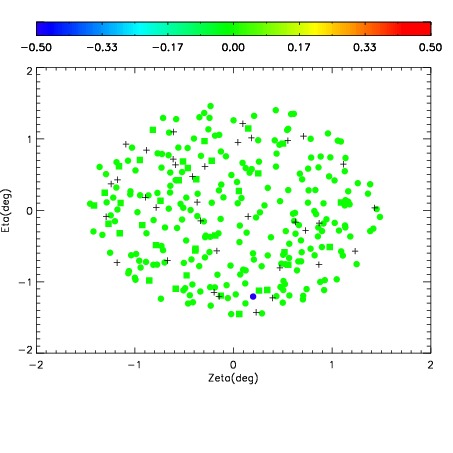
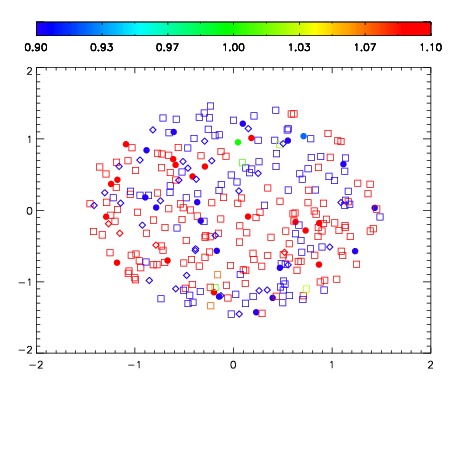
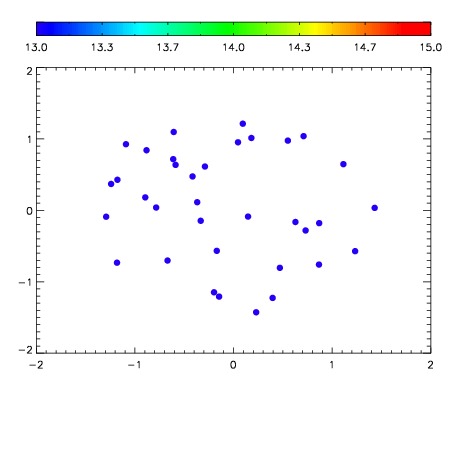

| Frame | Nreads | Zeropoints | Mag plots | Spatial mag deviation | Spatial sky 16325A emission deviations (filled: sky, open: star) | Spatial sky continuum emission | Spatial sky telluric CO2 absorption deviations (filled: H < 10) | |||||||||||||||||||||||
| 0 | 0 |
|
|
|
|
|
|
| IPAIR | NAME | SHIFT | NEWSHIFT | S/N | NAME | SHIFT | NEWSHIFT | S/N |
| 0 | 12550076 | 0.491707 | 0.00000 | 203.354 | 12550077 | -0.00186272 | 0.493570 | 202.665 |
| 1 | 12550075 | 0.491177 | 0.000530005 | 208.216 | 12550073 | -0.00368270 | 0.495390 | 212.093 |
| 2 | 12550072 | 0.489941 | 0.00176600 | 207.970 | 12550074 | -0.00367553 | 0.495383 | 208.038 |
| 3 | 12550071 | 0.489254 | 0.00245300 | 202.119 | 12550070 | 0.00000 | 0.491707 | 192.219 |