| Red | Green | Blue | |
| z | 17.64 | ||
| znorm | Inf | ||
| sky | -Inf | -Inf | -Inf |
| S/N | 31.3 | 53.5 | 57.8 |
| S/N(c) | 0.0 | 0.0 | 0.0 |
| SN(E/C) |

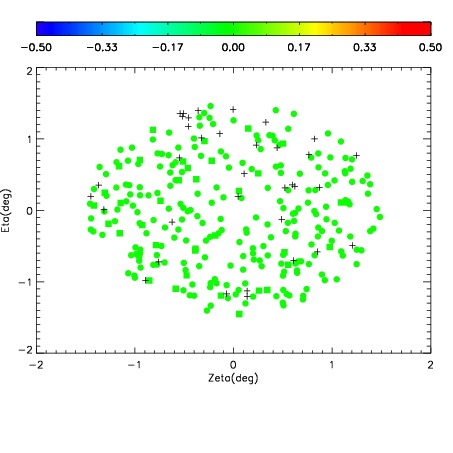
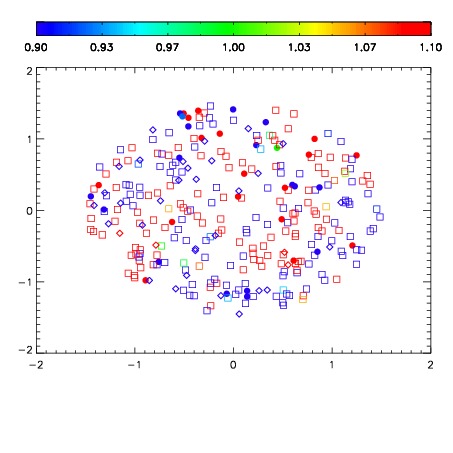


| Frame | Nreads | Zeropoints | Mag plots | Spatial mag deviation | Spatial sky 16325A emission deviations (filled: sky, open: star) | Spatial sky continuum emission | Spatial sky telluric CO2 absorption deviations (filled: H < 10) | |||||||||||||||||||||||
| 0 | 0 |
|
|
|
|
|
|
| IPAIR | NAME | SHIFT | NEWSHIFT | S/N | NAME | SHIFT | NEWSHIFT | S/N |
| 0 | 12740089 | 0.482536 | 0.00000 | 234.470 | 12740088 | -0.000249034 | 0.482785 | 233.241 |
| 1 | 12740085 | 0.481061 | 0.00147498 | 226.362 | 12740087 | -0.000415813 | 0.482952 | 228.775 |
| 2 | 12740086 | 0.482029 | 0.000506997 | 225.811 | 12740084 | -0.00143652 | 0.483973 | 228.414 |
| 3 | 12740082 | 0.482048 | 0.000487983 | 224.098 | 12740083 | -0.00236541 | 0.484901 | 225.663 |
| 4 | 12740081 | 0.481286 | 0.00125000 | 219.747 | 12740080 | 0.00000 | 0.482536 | 214.419 |