| Red | Green | Blue | |
| z | 17.64 | ||
| znorm | Inf | ||
| sky | -Inf | -Inf | -Inf |
| S/N | 28.1 | 45.9 | 54.7 |
| S/N(c) | 0.0 | 0.0 | 0.0 |
| SN(E/C) |
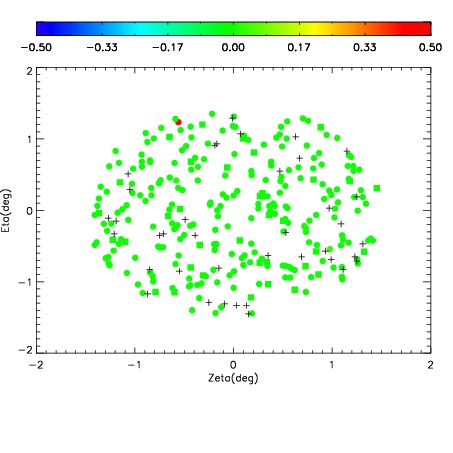
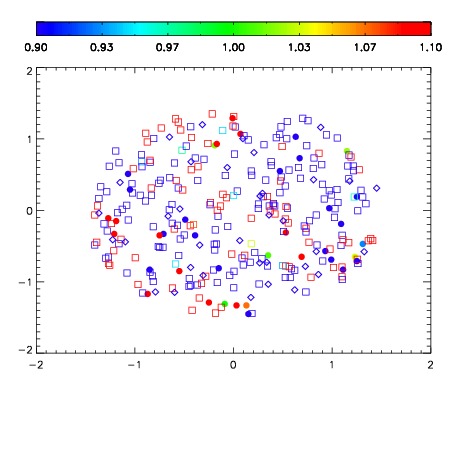


| Frame | Nreads | Zeropoints | Mag plots | Spatial mag deviation | Spatial sky 16325A emission deviations (filled: sky, open: star) | Spatial sky continuum emission | Spatial sky telluric CO2 absorption deviations (filled: H < 10) | |||||||||||||||||||||||
| 0 | 0 |
|
|
|
|
|
|
| IPAIR | NAME | SHIFT | NEWSHIFT | S/N | NAME | SHIFT | NEWSHIFT | S/N |
| 0 | 12860036 | 0.477791 | 0.00000 | 220.367 | 12860041 | -0.00152985 | 0.479321 | 219.467 |
| 1 | 12860040 | 0.475917 | 0.00187400 | 222.034 | 12860038 | -0.00186528 | 0.479656 | 222.938 |
| 2 | 12860039 | 0.475936 | 0.00185502 | 221.120 | 12860037 | -0.00220843 | 0.479999 | 220.390 |
| 3 | 12860035 | 0.476292 | 0.00149900 | 219.750 | 12860034 | 0.00000 | 0.477791 | 214.255 |