| Red | Green | Blue | |
| z | 17.64 | ||
| znorm | Inf | ||
| sky | -Inf | -Inf | -Inf |
| S/N | 31.6 | 46.8 | 51.8 |
| S/N(c) | 0.0 | 0.0 | 0.0 |
| SN(E/C) |
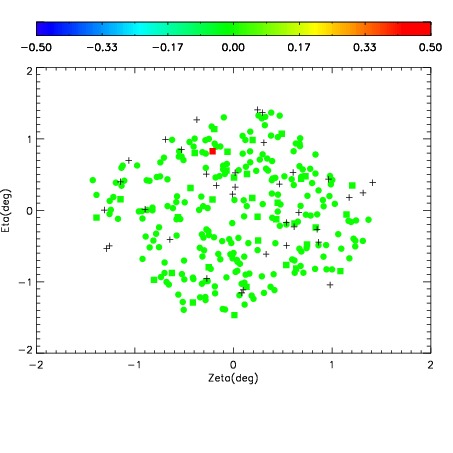
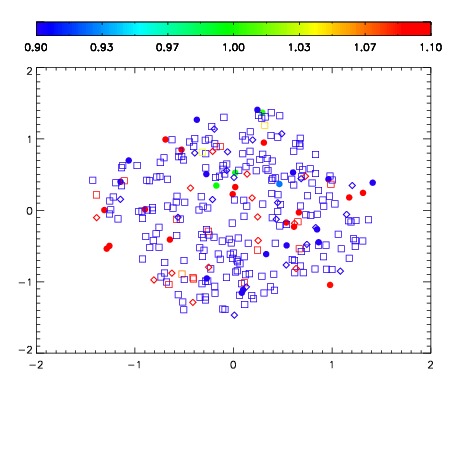


| Frame | Nreads | Zeropoints | Mag plots | Spatial mag deviation | Spatial sky 16325A emission deviations (filled: sky, open: star) | Spatial sky continuum emission | Spatial sky telluric CO2 absorption deviations (filled: H < 10) | |||||||||||||||||||||||
| 0 | 0 |
|
|
|
|
|
|
| IPAIR | NAME | SHIFT | NEWSHIFT | S/N | NAME | SHIFT | NEWSHIFT | S/N |
| 0 | 12420024 | 0.487761 | 0.00000 | 216.834 | 12420025 | -0.00177459 | 0.489536 | 216.033 |
| 1 | 12420027 | 0.484952 | 0.00280899 | 219.243 | 12420026 | -0.00181517 | 0.489576 | 216.866 |
| 2 | 12420023 | 0.487052 | 0.000708997 | 215.173 | 12420022 | 0.00000 | 0.487761 | 206.089 |