| Frame | Nreads | Zeropoints | Mag plots
| Spatial mag deviation
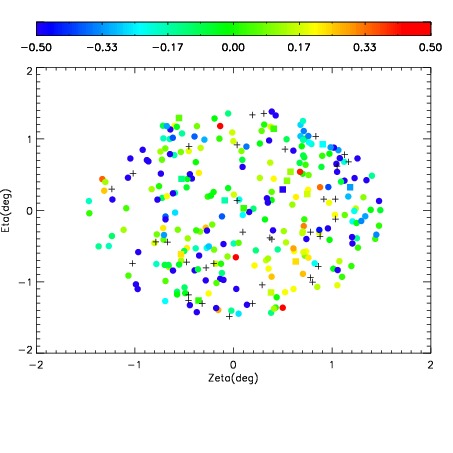
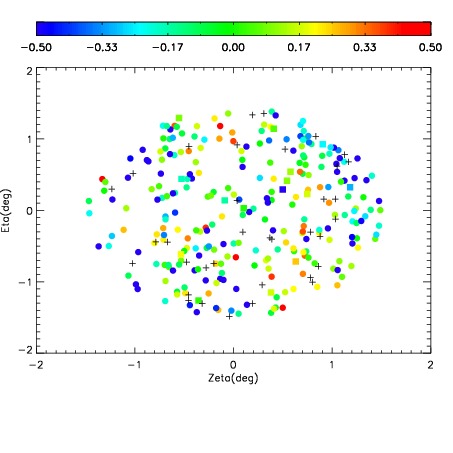
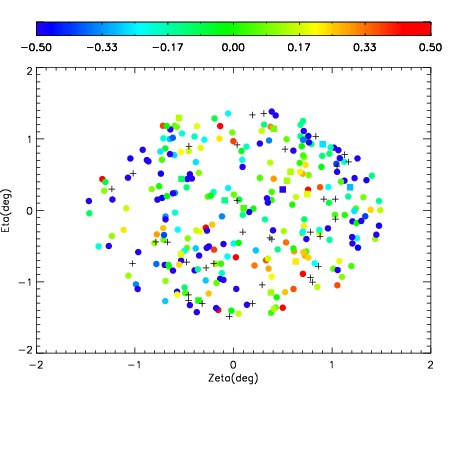
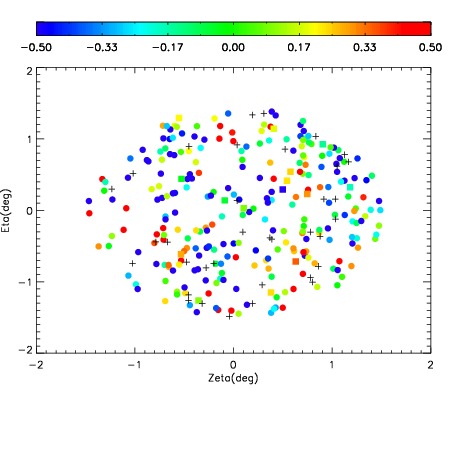
| Spatial sky 16325A emission deviations (filled: sky, open: star)
| Spatial sky continuum emission
| Spatial sky telluric CO2 absorption deviations (filled: H < 10)
|
| 19420024
| 47
| | Red | Green | Blue
| | z | | 18.65
| | znorm | | 14.47
| | sky | 14.6 | 14.3 | 14.4
| | S/N | 13.0 | 20.4 | 23.4
| | S/N(c) | 17.1 | 29.6 | 20.3
| | SN(E/C) 0.34
|
| 
| 
| 
| 
| 
|
| 19420025
| 47
| | Red | Green | Blue
| | z | | 18.32
| | znorm | | 14.14
| | sky | 14.5 | 14.3 | 14.5
| | S/N | 10.4 | 17.0 | 19.4
| | S/N(c) | 14.5 | 25.7 | 17.5
| | SN(E/C) 0.39
|
| 
| 
| 
| 
| 
|
| 19420026
| 47
| | Red | Green | Blue
| | z | | 17.75
| | znorm | | 13.57
| | sky | 14.2 | 14.1 | 14.1
| | S/N | 7.1 | 12.4 | 14.0
| | S/N(c) | 10.8 | 19.5 | 13.3
| | SN(E/C) 0.47
|
| 
| 
| 
| 
| 
|
| 19420027
| 47
| | Red | Green | Blue
| | z | | 17.66
| | znorm | | 13.48
| | sky | 14.3 | 14.1 | 14.1
| | S/N | 6.7 | 11.6 | 13.2
| | S/N(c) | 10.2 | 18.6 | 12.7
| | SN(E/C) 0.54
|
| 
| 
| 
| 
| 
|
| 19420028
| 47
| | Red | Green | Blue
| | z | | 17.17
| | znorm | | 12.99
| | sky | 14.1 | 14.1 | 14.1
| | S/N | 4.6 | 8.6 | 9.7
| | S/N(c) | 7.7 | 14.6 | 9.9
| | SN(E/C) 0.63
|
| 
| 
| 
| 
| 
|
| 19420029
| 47
| | Red | Green | Blue
| | z | | 16.88
| | znorm | | 12.70
| | sky | 14.0 | 13.9 | 13.9
| | S/N | 3.7 | 7.0 | 7.6
| | S/N(c) | 6.3 | 12.3 | 8.4
| | SN(E/C) 0.66
|
| 
| 
| 
| 
| 
|
| 19420030
| 47
| | Red | Green | Blue
| | z | | 16.26
| | znorm | | 12.08
| | sky | 13.8 | 13.8 | 13.7
| | S/N | 2.4 | 4.7 | 5.2
| | S/N(c) | 4.5 | 9.4 | 6.4
| | SN(E/C) 0.78
|
| 
| 
| 
| 
| 
|
| 19420031
| 47
| | Red | Green | Blue
| | z | | 17.36
| | znorm | | 13.18
| | sky | 14.1 | 14.1 | 13.9
| | S/N | 5.5 | 9.9 | 11.3
| | S/N(c) | 8.6 | 16.0 | 11.3
| | SN(E/C) 0.57
|
| 
| 
| 
| 
| 
|