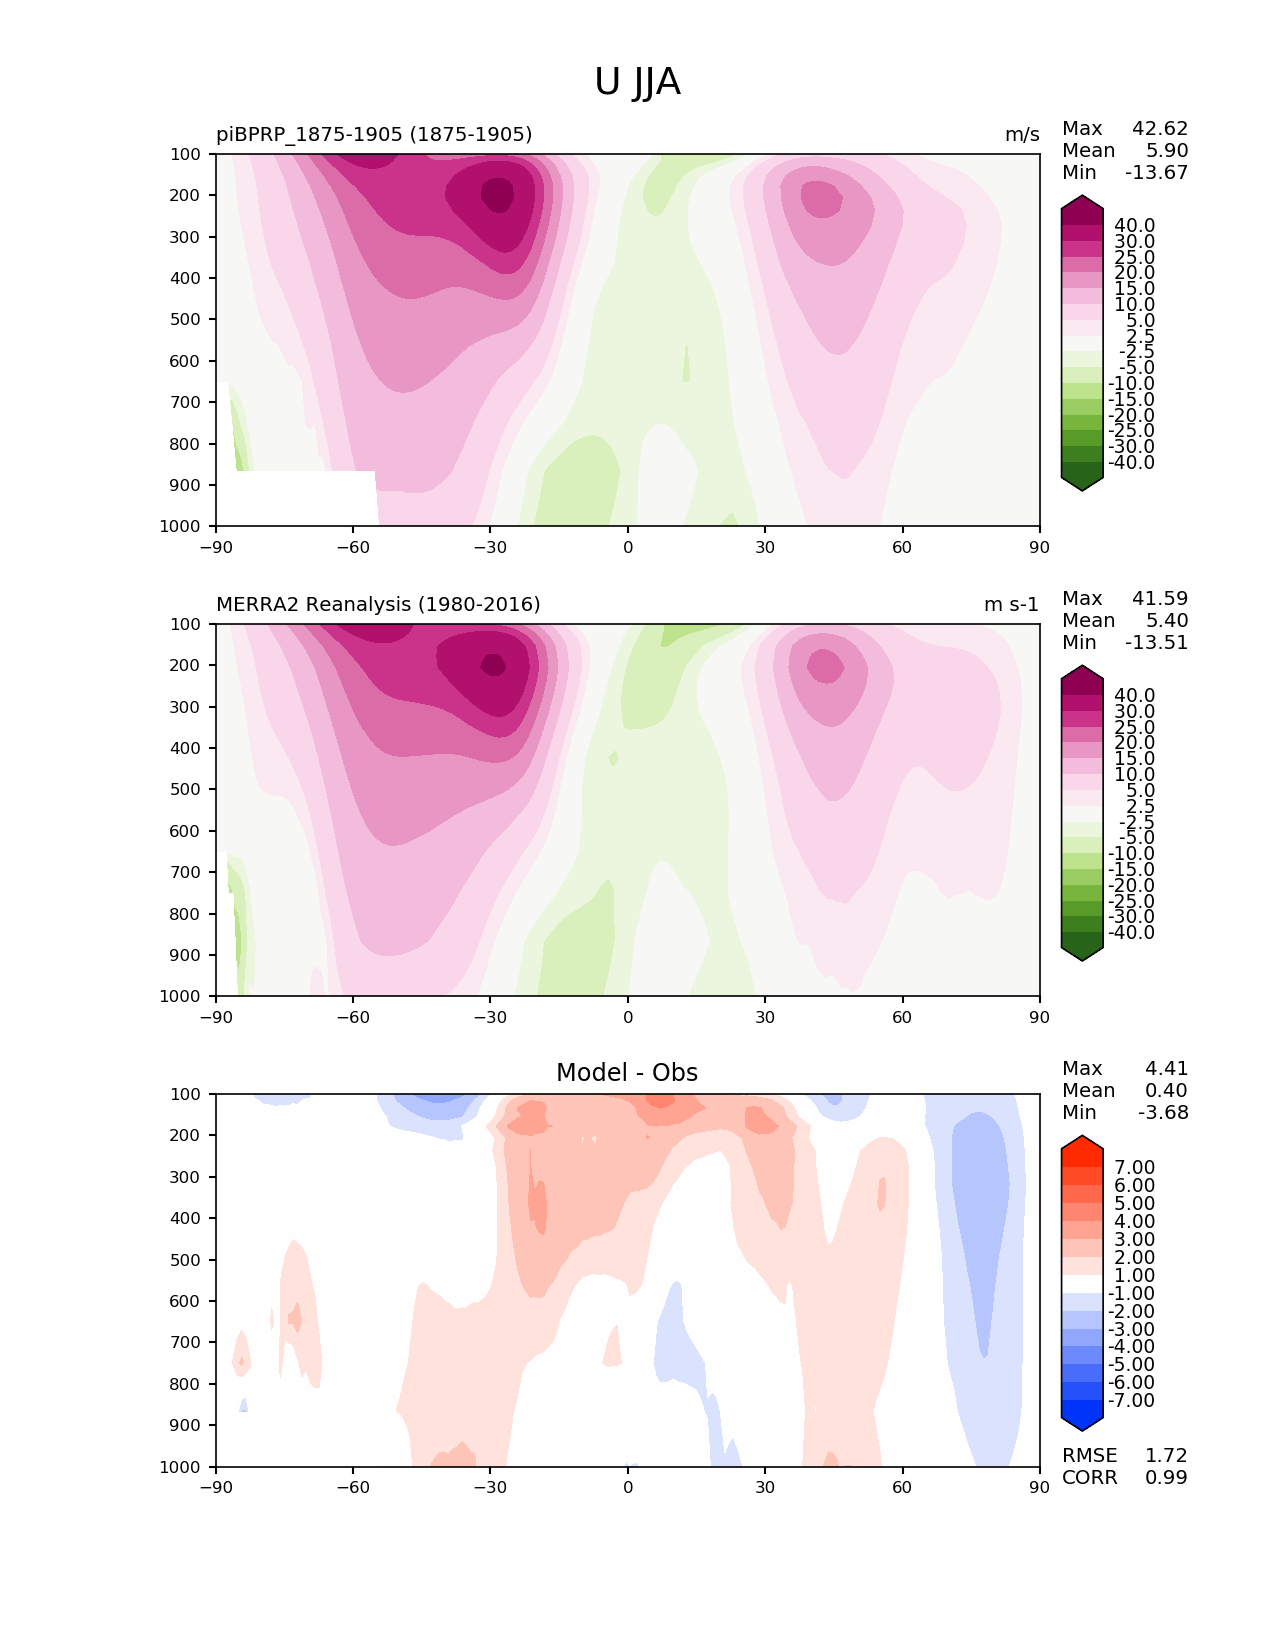
| Use this command to recreate this image: | e3sm_diags --no_viewer --variables 'U' --diff_colormap 'diverging_bwr.rgb' --contour_levels '-40' '-30' '-25' '-20' '-15' '-10' '-5' '-2.5' '2.5' '5' '10' '15' '20' '25' '30' '40' --test_data_path '/scratch2/scratchdirs/beharrop/E3SM_simulations/20190201.piBPRP_CNPCTC1850_OIBGC.ne30_oECv3.edison/reg_climo/20190201.piBPRP_CNPCTC1850_OIBGC.ne30_oECv3.edison/yrs1875_1905/' --diff_levels '-7' '-6' '-5' '-4' '-3' '-2' '-1' '1' '2' '3' '4' '5' '6' '7' --backend 'mpl' --canvas_size_h '1628' --reference_colormap 'PiYG_r' --reference_data_path '/global/project/projectdirs/acme/acme_diags/obs_for_e3sm_diags/climatology/' --main_title 'U JJA' --results_dir '/scratch2/scratchdirs/beharrop/E3SM_simulations/20190201.piBPRP_CNPCTC1850_OIBGC.ne30_oECv3.edison/e3sm_diags/' --regions 'global' --test_colormap 'PiYG_r' --regrid_method 'conservative' --short_test_name 'piBPRP_1875-1905' --figsize '8.5' '11.0' --ref_name 'MERRA2' --run_type 'model_vs_obs' --regrid_tool 'esmf' --num_workers '24' --reference_name 'MERRA2 Reanalysis' --output_format 'png' --case_id 'MERRA2' --granulate 'variables' 'seasons' 'regions' 'plevs' --test_name '20190201.piBPRP_CNPCTC1850_OIBGC.ne30_oECv3.edison' --seasons 'JJA' --arrows --selectors 'sets' 'seasons' --diff_title 'Model - Obs' --sets 'zonal_mean_2d' --canvas_size_w '1212' --multiprocessing --dpi '150' |