Mean State
Download Data |
Period Mean (original grids) [Pg] |
Model Period Mean (intersection) [Pg] |
Benchmark Period Mean (intersection) [Pg] |
Model Period Mean (complement) [Pg] |
Benchmark Period Mean (complement) [Pg] |
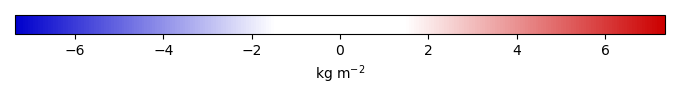
Bias [kg m-2] |
Bias Score [1] |
Spatial Distribution Score [1] |
Overall Score [1] |
|||
|---|---|---|---|---|---|---|---|---|---|---|---|---|
| Benchmark | [-] | 19.1 | ||||||||||
| v3.LR.historical_0101 | [-] | 30.8 | 29.3 | 19.1 | 1.49 | 0.000904 | 1.03 | 0.545 | 0.781 | 0.663 | ||
| v3alt.LR.highECS001.historical | [-] | 36.5 | 34.6 | 19.1 | 1.94 | 0.000904 | 1.56 | 0.504 | 0.813 | 0.659 | ||
| v3alt.LR.highECS003.historical | [-] | 33.7 | 31.9 | 19.1 | 1.76 | 0.000904 | 1.30 | 0.528 | 0.796 | 0.662 | ||
| v3alt.LR.lowECS001.historical | [-] | 31.7 | 30.2 | 19.1 | 1.52 | 0.000904 | 1.12 | 0.532 | 0.782 | 0.657 | ||
| v3alt.LR.lowECS002.historical | [-] | 18.7 | 18.0 | 19.1 | 0.684 | 0.000904 | -0.112 | 0.576 | 0.599 | 0.587 | ||
| v3alt.LR.lowECS003.historical | [-] | 21.4 | 20.5 | 19.1 | 0.880 | 0.000904 | 0.141 | 0.580 | 0.642 | 0.611 |
Download Data |
Period Mean (original grids) [Pg] |
Model Period Mean (intersection) [Pg] |
Benchmark Period Mean (intersection) [Pg] |
Model Period Mean (complement) [Pg] |
Benchmark Period Mean (complement) [Pg] |
Bias [kg m-2] |
Bias Score [1] |
Spatial Distribution Score [1] |
Overall Score [1] |
|||
|---|---|---|---|---|---|---|---|---|---|---|---|---|
| Benchmark | [-] | 7.57 | ||||||||||
| v3.LR.historical_0101 | [-] | 13.4 | 11.7 | 7.56 | 2.33 | 0.00283 | 1.28 | 0.519 | 0.821 | 0.670 | ||
| v3alt.LR.highECS001.historical | [-] | 15.2 | 13.4 | 7.56 | 2.58 | 0.00283 | 1.78 | 0.506 | 0.837 | 0.672 | ||
| v3alt.LR.highECS003.historical | [-] | 14.7 | 13.0 | 7.56 | 2.37 | 0.00283 | 1.66 | 0.546 | 0.844 | 0.695 | ||
| v3alt.LR.lowECS001.historical | [-] | 19.0 | 16.9 | 7.56 | 2.87 | 0.00283 | 2.85 | 0.515 | 0.821 | 0.668 | ||
| v3alt.LR.lowECS002.historical | [-] | 18.4 | 16.3 | 7.56 | 2.83 | 0.00283 | 2.68 | 0.515 | 0.811 | 0.663 | ||
| v3alt.LR.lowECS003.historical | [-] | 18.4 | 16.4 | 7.56 | 2.73 | 0.00283 | 2.71 | 0.515 | 0.808 | 0.661 |
Download Data |
Period Mean (original grids) [Pg] |
Model Period Mean (intersection) [Pg] |
Benchmark Period Mean (intersection) [Pg] |
Model Period Mean (complement) [Pg] |
Benchmark Period Mean (complement) [Pg] |
Bias [kg m-2] |
Bias Score [1] |
Spatial Distribution Score [1] |
Overall Score [1] |
|||
|---|---|---|---|---|---|---|---|---|---|---|---|---|
| Benchmark | [-] | 29.1 | ||||||||||
| v3.LR.historical_0101 | [-] | 44.9 | 43.0 | 29.1 | 1.96 | 0.00513 | 1.31 | 0.582 | 0.861 | 0.722 | ||
| v3alt.LR.highECS001.historical | [-] | 49.5 | 47.3 | 29.1 | 2.15 | 0.00513 | 1.72 | 0.552 | 0.869 | 0.710 | ||
| v3alt.LR.highECS003.historical | [-] | 43.2 | 41.2 | 29.1 | 1.94 | 0.00513 | 1.15 | 0.588 | 0.873 | 0.731 | ||
| v3alt.LR.lowECS001.historical | [-] | 46.7 | 44.6 | 29.1 | 2.11 | 0.00513 | 1.46 | 0.576 | 0.855 | 0.715 | ||
| v3alt.LR.lowECS002.historical | [-] | 43.3 | 41.4 | 29.1 | 1.92 | 0.00513 | 1.16 | 0.603 | 0.828 | 0.715 | ||
| v3alt.LR.lowECS003.historical | [-] | 43.1 | 41.2 | 29.1 | 1.91 | 0.00513 | 1.14 | 0.601 | 0.841 | 0.721 |
Download Data |
Period Mean (original grids) [Pg] |
Model Period Mean (intersection) [Pg] |
Benchmark Period Mean (intersection) [Pg] |
Model Period Mean (complement) [Pg] |
Benchmark Period Mean (complement) [Pg] |
Bias [kg m-2] |
Bias Score [1] |
Spatial Distribution Score [1] |
Overall Score [1] |
|||
|---|---|---|---|---|---|---|---|---|---|---|---|---|
| Benchmark | [-] | 364. | ||||||||||
| v3.LR.historical_0101 | [-] | 784. | 747. | 364. | 37.2 | 0.0376 | 3.09 | 0.464 | 0.477 | 0.470 | ||
| v3alt.LR.highECS001.historical | [-] | 811. | 775. | 364. | 38.6 | 0.0376 | 3.32 | 0.460 | 0.505 | 0.483 | ||
| v3alt.LR.highECS003.historical | [-] | 794. | 756. | 364. | 38.8 | 0.0376 | 3.16 | 0.467 | 0.487 | 0.477 | ||
| v3alt.LR.lowECS001.historical | [-] | 751. | 714. | 364. | 37.8 | 0.0376 | 2.83 | 0.498 | 0.582 | 0.540 | ||
| v3alt.LR.lowECS002.historical | [-] | 776. | 738. | 364. | 38.1 | 0.0376 | 3.02 | 0.450 | 0.466 | 0.458 | ||
| v3alt.LR.lowECS003.historical | [-] | 742. | 705. | 364. | 37.3 | 0.0376 | 2.75 | 0.478 | 0.529 | 0.503 |
Download Data |
Period Mean (original grids) [Pg] |
Model Period Mean (intersection) [Pg] |
Benchmark Period Mean (intersection) [Pg] |
Model Period Mean (complement) [Pg] |
Benchmark Period Mean (complement) [Pg] |
Bias [kg m-2] |
Bias Score [1] |
Spatial Distribution Score [1] |
Overall Score [1] |
|||
|---|---|---|---|---|---|---|---|---|---|---|---|---|
| Benchmark | [-] | 27.3 | ||||||||||
| v3.LR.historical_0101 | [-] | 40.2 | 38.5 | 27.3 | 0.956 | 0.000505 | 1.24 | 0.590 | 0.864 | 0.727 | ||
| v3alt.LR.highECS001.historical | [-] | 44.1 | 42.3 | 27.3 | 0.996 | 0.000505 | 1.66 | 0.560 | 0.872 | 0.716 | ||
| v3alt.LR.highECS003.historical | [-] | 38.5 | 36.9 | 27.3 | 0.954 | 0.000505 | 1.06 | 0.596 | 0.877 | 0.736 | ||
| v3alt.LR.lowECS001.historical | [-] | 41.0 | 39.3 | 27.3 | 0.936 | 0.000505 | 1.32 | 0.587 | 0.860 | 0.724 | ||
| v3alt.LR.lowECS002.historical | [-] | 37.9 | 36.2 | 27.3 | 0.893 | 0.000505 | 0.988 | 0.616 | 0.832 | 0.724 | ||
| v3alt.LR.lowECS003.historical | [-] | 37.7 | 36.0 | 27.3 | 0.911 | 0.000505 | 0.967 | 0.614 | 0.846 | 0.730 |
Temporally integrated period mean