Mean State
Download Data |
Period Mean (original grids) [Pg] |
Model Period Mean (intersection) [Pg] |
Benchmark Period Mean (intersection) [Pg] |
Model Period Mean (complement) [Pg] |
Benchmark Period Mean (complement) [Pg] |
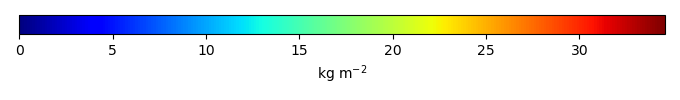
Bias [kg m-2] |
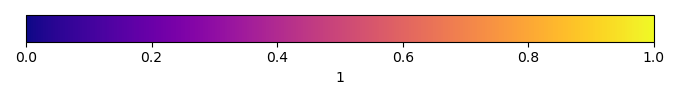
Bias Score [1] |
Spatial Distribution Score [1] |
Overall Score [1] |
|||
|---|---|---|---|---|---|---|---|---|---|---|---|---|
| Benchmark | [-] | 26.5 | ||||||||||
| v3.LR.historical_0101 | [-] | 30.8 | 28.6 | 26.5 | 2.15 | 0.0545 | 0.228 | 0.615 | 0.811 | 0.713 | ||
| v3alt.LR.highECS001.historical | [-] | 36.3 | 33.6 | 26.5 | 2.76 | 0.0545 | 0.757 | 0.597 | 0.844 | 0.720 | ||
| v3alt.LR.highECS003.historical | [-] | 33.6 | 31.1 | 26.5 | 2.52 | 0.0545 | 0.491 | 0.601 | 0.826 | 0.714 | ||
| v3alt.LR.lowECS001.historical | [-] | 31.6 | 29.5 | 26.5 | 2.16 | 0.0545 | 0.319 | 0.606 | 0.809 | 0.708 | ||
| v3alt.LR.lowECS002.historical | [-] | 18.6 | 17.6 | 26.5 | 0.969 | 0.0545 | -0.951 | 0.598 | 0.622 | 0.610 | ||
| v3alt.LR.lowECS003.historical | [-] | 21.3 | 20.1 | 26.5 | 1.25 | 0.0545 | -0.691 | 0.612 | 0.668 | 0.640 |
Download Data |
Period Mean (original grids) [Pg] |
Model Period Mean (intersection) [Pg] |
Benchmark Period Mean (intersection) [Pg] |
Model Period Mean (complement) [Pg] |
Benchmark Period Mean (complement) [Pg] |
Bias [kg m-2] |
Bias Score [1] |
Spatial Distribution Score [1] |
Overall Score [1] |
|||
|---|---|---|---|---|---|---|---|---|---|---|---|---|
| Benchmark | [-] | 0.397 | ||||||||||
| v3.LR.historical_0101 | [-] | 13.5 | 0.635 | 0.397 | 13.5 | 1.68 | 0.610 | 0.691 | 0.650 | |||
| v3alt.LR.highECS001.historical | [-] | 15.2 | 0.709 | 0.397 | 15.3 | 2.20 | 0.540 | 0.672 | 0.606 | |||
| v3alt.LR.highECS003.historical | [-] | 14.7 | 0.648 | 0.397 | 14.7 | 1.77 | 0.585 | 0.700 | 0.643 | |||
| v3alt.LR.lowECS001.historical | [-] | 18.8 | 0.714 | 0.397 | 18.9 | 2.24 | 0.522 | 0.689 | 0.606 | |||
| v3alt.LR.lowECS002.historical | [-] | 18.4 | 0.704 | 0.397 | 18.5 | 2.17 | 0.538 | 0.667 | 0.602 | |||
| v3alt.LR.lowECS003.historical | [-] | 18.4 | 0.697 | 0.397 | 18.5 | 2.12 | 0.542 | 0.710 | 0.626 |
Download Data |
Period Mean (original grids) [Pg] |
Model Period Mean (intersection) [Pg] |
Benchmark Period Mean (intersection) [Pg] |
Model Period Mean (complement) [Pg] |
Benchmark Period Mean (complement) [Pg] |
Bias [kg m-2] |
Bias Score [1] |
Spatial Distribution Score [1] |
Overall Score [1] |
|||
|---|---|---|---|---|---|---|---|---|---|---|---|---|
| Benchmark | [-] | 35.3 | ||||||||||
| v3.LR.historical_0101 | [-] | 44.7 | 38.1 | 35.3 | 6.60 | 0.0304 | 0.329 | 0.642 | 0.835 | 0.738 | ||
| v3alt.LR.highECS001.historical | [-] | 49.7 | 41.9 | 35.3 | 7.73 | 0.0304 | 0.770 | 0.627 | 0.820 | 0.723 | ||
| v3alt.LR.highECS003.historical | [-] | 43.7 | 37.2 | 35.3 | 6.48 | 0.0304 | 0.223 | 0.634 | 0.810 | 0.722 | ||
| v3alt.LR.lowECS001.historical | [-] | 46.3 | 38.7 | 35.3 | 7.59 | 0.0304 | 0.400 | 0.637 | 0.836 | 0.737 | ||
| v3alt.LR.lowECS002.historical | [-] | 43.1 | 35.9 | 35.3 | 7.24 | 0.0304 | 0.0660 | 0.650 | 0.865 | 0.757 | ||
| v3alt.LR.lowECS003.historical | [-] | 43.3 | 36.0 | 35.3 | 7.25 | 0.0304 | 0.0868 | 0.646 | 0.855 | 0.750 |
Download Data |
Period Mean (original grids) [Pg] |
Model Period Mean (intersection) [Pg] |
Benchmark Period Mean (intersection) [Pg] |
Model Period Mean (complement) [Pg] |
Benchmark Period Mean (complement) [Pg] |
Bias [kg m-2] |
Bias Score [1] |
Spatial Distribution Score [1] |
Overall Score [1] |
|||
|---|---|---|---|---|---|---|---|---|---|---|---|---|
| Benchmark | [-] | 174. | ||||||||||
| v3.LR.historical_0101 | [-] | 784. | 156. | 174. | 628. | 0.157 | -0.383 | 0.649 | 0.911 | 0.780 | ||
| v3alt.LR.highECS001.historical | [-] | 810. | 173. | 174. | 640. | 0.157 | -0.0191 | 0.632 | 0.905 | 0.769 | ||
| v3alt.LR.highECS003.historical | [-] | 792. | 162. | 174. | 630. | 0.157 | -0.246 | 0.635 | 0.905 | 0.770 | ||
| v3alt.LR.lowECS001.historical | [-] | 751. | 161. | 174. | 591. | 0.157 | -0.272 | 0.640 | 0.907 | 0.774 | ||
| v3alt.LR.lowECS002.historical | [-] | 777. | 120. | 174. | 657. | 0.157 | -1.14 | 0.630 | 0.897 | 0.763 | ||
| v3alt.LR.lowECS003.historical | [-] | 741. | 128. | 174. | 613. | 0.157 | -0.962 | 0.642 | 0.903 | 0.773 |
Download Data |
Period Mean (original grids) [Pg] |
Model Period Mean (intersection) [Pg] |
Benchmark Period Mean (intersection) [Pg] |
Model Period Mean (complement) [Pg] |
Benchmark Period Mean (complement) [Pg] |
Bias [kg m-2] |
Bias Score [1] |
Spatial Distribution Score [1] |
Overall Score [1] |
|||
|---|---|---|---|---|---|---|---|---|---|---|---|---|
| Benchmark | [-] | 34.8 | ||||||||||
| v3.LR.historical_0101 | [-] | 40.0 | 37.4 | 34.8 | 1.91 | 0.0304 | 0.314 | 0.642 | 0.831 | 0.736 | ||
| v3alt.LR.highECS001.historical | [-] | 44.2 | 41.2 | 34.8 | 2.23 | 0.0304 | 0.754 | 0.628 | 0.816 | 0.722 | ||
| v3alt.LR.highECS003.historical | [-] | 39.0 | 36.5 | 34.8 | 1.79 | 0.0304 | 0.204 | 0.635 | 0.806 | 0.720 | ||
| v3alt.LR.lowECS001.historical | [-] | 40.7 | 38.0 | 34.8 | 1.98 | 0.0304 | 0.377 | 0.639 | 0.833 | 0.736 | ||
| v3alt.LR.lowECS002.historical | [-] | 37.7 | 35.1 | 34.8 | 1.85 | 0.0304 | 0.0390 | 0.651 | 0.863 | 0.757 | ||
| v3alt.LR.lowECS003.historical | [-] | 37.9 | 35.3 | 34.8 | 1.84 | 0.0304 | 0.0606 | 0.647 | 0.852 | 0.750 |
Temporally integrated period mean