Mean State
Download Data |
Period Mean (original grids) [Pg] |
Model Period Mean (intersection) [Pg] |
Benchmark Period Mean (intersection) [Pg] |
Model Period Mean (complement) [Pg] |
Benchmark Period Mean (complement) [Pg] |
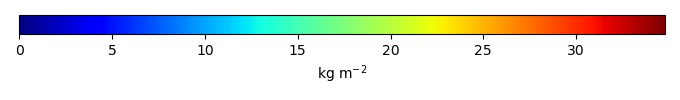
Bias [kg m-2] |
Bias Score [1] |
Spatial Distribution Score [1] |
Overall Score [1] |
|||
|---|---|---|---|---|---|---|---|---|---|---|---|---|
| Benchmark | [-] | 10.3 | ||||||||||
| v3.LR.historical_0101 | [-] | 13.4 | 11.7 | 10.3 | 2.40 | 0.00626 | 0.429 | 0.563 | 0.757 | 0.660 | ||
| v3alt.LR.highECS001.historical | [-] | 15.2 | 13.3 | 10.3 | 2.64 | 0.00626 | 0.925 | 0.553 | 0.807 | 0.680 | ||
| v3alt.LR.highECS003.historical | [-] | 14.7 | 12.9 | 10.3 | 2.44 | 0.00626 | 0.794 | 0.590 | 0.838 | 0.714 | ||
| v3alt.LR.lowECS001.historical | [-] | 19.0 | 16.8 | 10.3 | 2.96 | 0.00626 | 1.98 | 0.597 | 0.899 | 0.748 | ||
| v3alt.LR.lowECS002.historical | [-] | 18.4 | 16.2 | 10.3 | 2.93 | 0.00626 | 1.82 | 0.583 | 0.878 | 0.731 | ||
| v3alt.LR.lowECS003.historical | [-] | 18.4 | 16.3 | 10.3 | 2.84 | 0.00626 | 1.84 | 0.585 | 0.881 | 0.733 |
Download Data |
Period Mean (original grids) [Pg] |
Model Period Mean (intersection) [Pg] |
Benchmark Period Mean (intersection) [Pg] |
Model Period Mean (complement) [Pg] |
Benchmark Period Mean (complement) [Pg] |
Bias [kg m-2] |
Bias Score [1] |
Spatial Distribution Score [1] |
Overall Score [1] |
|||
|---|---|---|---|---|---|---|---|---|---|---|---|---|
| Benchmark | [-] | 3.22 | ||||||||||
| v3.LR.historical_0101 | [-] | 44.9 | 7.35 | 3.20 | 37.5 | 0.0169 | 1.81 | 0.605 | 0.610 | 0.607 | ||
| v3alt.LR.highECS001.historical | [-] | 49.4 | 8.21 | 3.20 | 41.2 | 0.0169 | 2.18 | 0.539 | 0.579 | 0.559 | ||
| v3alt.LR.highECS003.historical | [-] | 43.1 | 7.11 | 3.20 | 36.0 | 0.0169 | 1.70 | 0.601 | 0.636 | 0.619 | ||
| v3alt.LR.lowECS001.historical | [-] | 46.6 | 8.43 | 3.20 | 38.2 | 0.0169 | 2.28 | 0.509 | 0.622 | 0.565 | ||
| v3alt.LR.lowECS002.historical | [-] | 43.2 | 8.27 | 3.20 | 35.0 | 0.0169 | 2.21 | 0.524 | 0.578 | 0.551 | ||
| v3alt.LR.lowECS003.historical | [-] | 43.1 | 8.19 | 3.20 | 34.9 | 0.0169 | 2.18 | 0.521 | 0.611 | 0.566 |
Download Data |
Period Mean (original grids) [Pg] |
Model Period Mean (intersection) [Pg] |
Benchmark Period Mean (intersection) [Pg] |
Model Period Mean (complement) [Pg] |
Benchmark Period Mean (complement) [Pg] |
Bias [kg m-2] |
Bias Score [1] |
Spatial Distribution Score [1] |
Overall Score [1] |
|||
|---|---|---|---|---|---|---|---|---|---|---|---|---|
| Benchmark | [-] | 349. | ||||||||||
| v3.LR.historical_0101 | [-] | 784. | 587. | 349. | 197. | 0.0267 | 3.35 | 0.504 | 0.443 | 0.474 | ||
| v3alt.LR.highECS001.historical | [-] | 811. | 598. | 349. | 216. | 0.0267 | 3.49 | 0.505 | 0.473 | 0.489 | ||
| v3alt.LR.highECS003.historical | [-] | 794. | 589. | 349. | 205. | 0.0267 | 3.37 | 0.506 | 0.453 | 0.480 | ||
| v3alt.LR.lowECS001.historical | [-] | 751. | 549. | 349. | 203. | 0.0267 | 2.80 | 0.550 | 0.558 | 0.554 | ||
| v3alt.LR.lowECS002.historical | [-] | 776. | 615. | 349. | 161. | 0.0267 | 3.73 | 0.504 | 0.452 | 0.478 | ||
| v3alt.LR.lowECS003.historical | [-] | 742. | 572. | 349. | 169. | 0.0267 | 3.14 | 0.529 | 0.513 | 0.521 |
Download Data |
Period Mean (original grids) [Pg] |
Model Period Mean (intersection) [Pg] |
Benchmark Period Mean (intersection) [Pg] |
Model Period Mean (complement) [Pg] |
Benchmark Period Mean (complement) [Pg] |
Bias [kg m-2] |
Bias Score [1] |
Spatial Distribution Score [1] |
Overall Score [1] |
|||
|---|---|---|---|---|---|---|---|---|---|---|---|---|
| Benchmark | [-] | 0.794 | ||||||||||
| v3.LR.historical_0101 | [-] | 40.1 | 3.00 | 0.794 | 36.4 | 2.91 | 0.587 | 0.483 | 0.535 | |||
| v3alt.LR.highECS001.historical | [-] | 44.0 | 3.26 | 0.794 | 40.0 | 3.26 | 0.548 | 0.458 | 0.503 | |||
| v3alt.LR.highECS003.historical | [-] | 38.5 | 2.84 | 0.794 | 35.0 | 2.70 | 0.595 | 0.517 | 0.556 | |||
| v3alt.LR.lowECS001.historical | [-] | 40.9 | 3.20 | 0.794 | 37.0 | 3.17 | 0.547 | 0.497 | 0.522 | |||
| v3alt.LR.lowECS002.historical | [-] | 37.8 | 3.20 | 0.794 | 33.8 | 3.17 | 0.555 | 0.467 | 0.511 | |||
| v3alt.LR.lowECS003.historical | [-] | 37.7 | 3.11 | 0.794 | 33.8 | 3.06 | 0.560 | 0.493 | 0.527 |
Temporally integrated period mean