Mean State
Download Data |
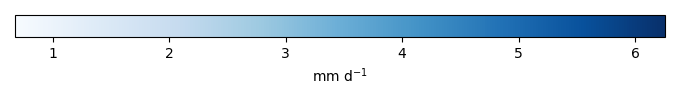
Period Mean (original grids) [mm d-1] |
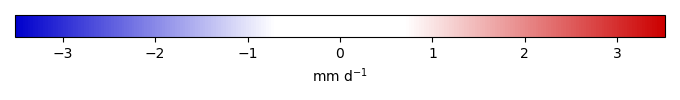
Bias [mm d-1] |
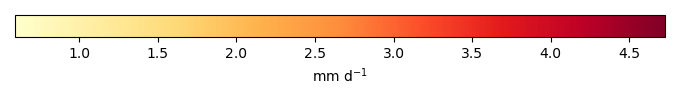
RMSE [mm d-1] |
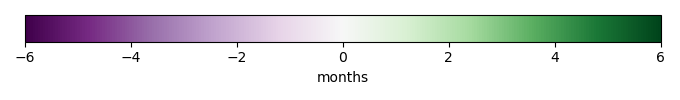
Phase Shift [months] |
Bias Score [1] |
RMSE Score [1] |
Seasonal Cycle Score [1] |
Overall Score [1] |
|||
|---|---|---|---|---|---|---|---|---|---|---|---|
| Benchmark | [-] | 0.852 | |||||||||
| v3.LR.historical_0101 | [-] | 1.59 | 0.737 | 1.15 | 0.899 | 0.481 | 0.345 | 0.922 | 0.523 | ||
| v3alt.LR.highECS001.historical | [-] | 1.70 | 0.849 | 1.33 | 0.899 | 0.437 | 0.315 | 0.944 | 0.503 | ||
| v3alt.LR.highECS003.historical | [-] | 1.72 | 0.867 | 1.42 | 0.834 | 0.430 | 0.302 | 0.933 | 0.492 | ||
| v3alt.LR.lowECS001.historical | [-] | 1.53 | 0.678 | 1.17 | 0.834 | 0.527 | 0.366 | 0.926 | 0.546 | ||
| v3alt.LR.lowECS002.historical | [-] | 1.35 | 0.502 | 1.03 | 0.834 | 0.620 | 0.376 | 0.948 | 0.580 | ||
| v3alt.LR.lowECS003.historical | [-] | 1.38 | 0.530 | 1.13 | 0.832 | 0.606 | 0.333 | 0.910 | 0.545 |
Download Data |
Period Mean (original grids) [mm d-1] |
Bias [mm d-1] |
RMSE [mm d-1] |
Phase Shift [months] |
Bias Score [1] |
RMSE Score [1] |
Seasonal Cycle Score [1] |
Overall Score [1] |
|||
|---|---|---|---|---|---|---|---|---|---|---|---|
| Benchmark | [-] | 3.19 | |||||||||
| v3.LR.historical_0101 | [-] | 3.02 | -0.171 | 3.24 | 3.07 | 0.930 | 0.262 | 0.494 | 0.487 | ||
| v3alt.LR.highECS001.historical | [-] | 2.85 | -0.345 | 2.56 | 4.08 | 0.866 | 0.358 | 0.244 | 0.456 | ||
| v3alt.LR.highECS003.historical | [-] | 2.85 | -0.341 | 2.93 | 3.07 | 0.867 | 0.306 | 0.494 | 0.493 | ||
| v3alt.LR.lowECS001.historical | [-] | 2.52 | -0.676 | 2.66 | 4.08 | 0.756 | 0.364 | 0.244 | 0.432 | ||
| v3alt.LR.lowECS002.historical | [-] | 2.75 | -0.441 | 2.59 | 3.07 | 0.832 | 0.354 | 0.494 | 0.508 | ||
| v3alt.LR.lowECS003.historical | [-] | 2.57 | -0.620 | 2.68 | 4.08 | 0.773 | 0.360 | 0.244 | 0.434 |
Download Data |
Period Mean (original grids) [mm d-1] |
Bias [mm d-1] |
RMSE [mm d-1] |
Phase Shift [months] |
Bias Score [1] |
RMSE Score [1] |
Seasonal Cycle Score [1] |
Overall Score [1] |
|||
|---|---|---|---|---|---|---|---|---|---|---|---|
| Benchmark | [-] | 1.89 | |||||||||
| v3.LR.historical_0101 | [-] | 2.71 | 0.826 | 2.25 | 1.88 | 0.652 | 0.287 | 0.722 | 0.487 | ||
| v3alt.LR.highECS001.historical | [-] | 2.90 | 1.02 | 2.28 | 1.81 | 0.597 | 0.288 | 0.703 | 0.469 | ||
| v3alt.LR.highECS003.historical | [-] | 2.75 | 0.859 | 2.27 | 1.75 | 0.633 | 0.285 | 0.733 | 0.484 | ||
| v3alt.LR.lowECS001.historical | [-] | 2.62 | 0.732 | 2.29 | 1.65 | 0.661 | 0.280 | 0.716 | 0.485 | ||
| v3alt.LR.lowECS002.historical | [-] | 2.42 | 0.534 | 2.04 | 1.45 | 0.714 | 0.307 | 0.769 | 0.524 | ||
| v3alt.LR.lowECS003.historical | [-] | 2.49 | 0.604 | 2.11 | 1.86 | 0.696 | 0.303 | 0.702 | 0.501 |
Download Data |
Period Mean (original grids) [mm d-1] |
Bias [mm d-1] |
RMSE [mm d-1] |
Phase Shift [months] |
Bias Score [1] |
RMSE Score [1] |
Seasonal Cycle Score [1] |
Overall Score [1] |
|||
|---|---|---|---|---|---|---|---|---|---|---|---|
| Benchmark | [-] | 2.16 | |||||||||
| v3.LR.historical_0101 | [-] | 2.50 | 0.338 | 2.18 | 1.65 | 0.670 | 0.327 | 0.764 | 0.522 | ||
| v3alt.LR.highECS001.historical | [-] | 2.66 | 0.499 | 2.24 | 1.69 | 0.648 | 0.321 | 0.741 | 0.508 | ||
| v3alt.LR.highECS003.historical | [-] | 2.57 | 0.404 | 2.25 | 1.54 | 0.660 | 0.318 | 0.765 | 0.515 | ||
| v3alt.LR.lowECS001.historical | [-] | 2.47 | 0.309 | 2.20 | 1.73 | 0.683 | 0.324 | 0.713 | 0.511 | ||
| v3alt.LR.lowECS002.historical | [-] | 2.35 | 0.189 | 2.10 | 1.57 | 0.709 | 0.330 | 0.736 | 0.527 | ||
| v3alt.LR.lowECS003.historical | [-] | 2.42 | 0.250 | 2.17 | 1.66 | 0.696 | 0.322 | 0.761 | 0.525 |
Download Data |
Period Mean (original grids) [mm d-1] |
Bias [mm d-1] |
RMSE [mm d-1] |
Phase Shift [months] |
Bias Score [1] |
RMSE Score [1] |
Seasonal Cycle Score [1] |
Overall Score [1] |
|||
|---|---|---|---|---|---|---|---|---|---|---|---|
| Benchmark | [-] | 1.85 | |||||||||
| v3.LR.historical_0101 | [-] | 2.70 | 0.856 | 2.22 | 1.85 | 0.638 | 0.288 | 0.734 | 0.487 | ||
| v3alt.LR.highECS001.historical | [-] | 2.91 | 1.06 | 2.27 | 1.74 | 0.583 | 0.284 | 0.728 | 0.470 | ||
| v3alt.LR.highECS003.historical | [-] | 2.74 | 0.896 | 2.25 | 1.71 | 0.621 | 0.284 | 0.746 | 0.484 | ||
| v3alt.LR.lowECS001.historical | [-] | 2.62 | 0.775 | 2.28 | 1.57 | 0.656 | 0.276 | 0.741 | 0.487 | ||
| v3alt.LR.lowECS002.historical | [-] | 2.41 | 0.564 | 2.02 | 1.40 | 0.708 | 0.305 | 0.784 | 0.525 | ||
| v3alt.LR.lowECS003.historical | [-] | 2.49 | 0.642 | 2.10 | 1.79 | 0.692 | 0.300 | 0.726 | 0.505 |
Temporally integrated period mean