Mean State
Download Data |
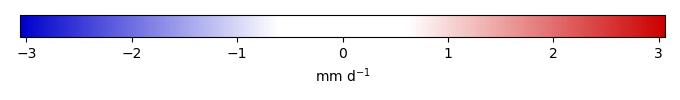
Period Mean (original grids) [mm d-1] |
Model Period Mean (intersection) [mm d-1] |
Benchmark Period Mean (intersection) [mm d-1] |
Model Period Mean (complement) [mm d-1] |
Benchmark Period Mean (complement) [mm d-1] |
Bias [mm d-1] |
RMSE [mm d-1] |
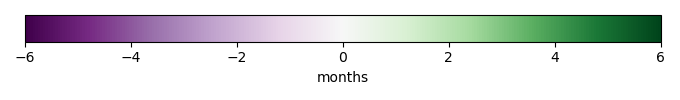
Phase Shift [months] |
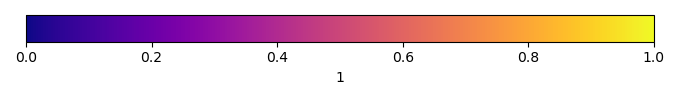
Bias Score [1] |
RMSE Score [1] |
Seasonal Cycle Score [1] |
Spatial Distribution Score [1] |
Overall Score [1] |
|||
|---|---|---|---|---|---|---|---|---|---|---|---|---|---|---|---|---|
| Benchmark | [-] | 1.38 | ||||||||||||||
| v3.LR.historical_0101 | [-] | 1.90 | 1.91 | 1.38 | 1.90 | 0.531 | 0.803 | 0.688 | 0.579 | 0.674 | 0.927 | 0.934 | 0.757 | |||
| v3alt.LR.highECS001.historical | [-] | 2.02 | 2.02 | 1.38 | 2.02 | 0.643 | 0.886 | 0.806 | 0.535 | 0.673 | 0.915 | 0.937 | 0.747 | |||
| v3alt.LR.highECS003.historical | [-] | 2.00 | 1.99 | 1.38 | 2.01 | 0.616 | 0.857 | 0.697 | 0.551 | 0.677 | 0.920 | 0.940 | 0.753 | |||
| v3alt.LR.lowECS001.historical | [-] | 1.84 | 1.84 | 1.38 | 1.85 | 0.468 | 0.740 | 0.709 | 0.603 | 0.693 | 0.923 | 0.929 | 0.768 | |||
| v3alt.LR.lowECS002.historical | [-] | 1.57 | 1.57 | 1.38 | 1.55 | 0.198 | 0.589 | 0.655 | 0.694 | 0.696 | 0.927 | 0.891 | 0.781 | |||
| v3alt.LR.lowECS003.historical | [-] | 1.65 | 1.65 | 1.38 | 1.66 | 0.277 | 0.621 | 0.722 | 0.681 | 0.695 | 0.916 | 0.917 | 0.781 |
Download Data |
Period Mean (original grids) [mm d-1] |
Model Period Mean (intersection) [mm d-1] |
Benchmark Period Mean (intersection) [mm d-1] |
Model Period Mean (complement) [mm d-1] |
Benchmark Period Mean (complement) [mm d-1] |
Bias [mm d-1] |
RMSE [mm d-1] |
Phase Shift [months] |
Bias Score [1] |
RMSE Score [1] |
Seasonal Cycle Score [1] |
Spatial Distribution Score [1] |
Overall Score [1] |
|||
|---|---|---|---|---|---|---|---|---|---|---|---|---|---|---|---|---|
| Benchmark | [-] | 2.99 | ||||||||||||||
| v3.LR.historical_0101 | [-] | 3.67 | 3.12 | 2.99 | 4.01 | 0.135 | 2.07 | 1.33 | 0.630 | 0.637 | 0.803 | 0.668 | 0.675 | |||
| v3alt.LR.highECS001.historical | [-] | 3.68 | 3.30 | 2.99 | 3.92 | 0.312 | 2.35 | 1.67 | 0.602 | 0.589 | 0.743 | 0.740 | 0.652 | |||
| v3alt.LR.highECS003.historical | [-] | 3.67 | 3.38 | 2.99 | 3.85 | 0.397 | 2.26 | 1.45 | 0.627 | 0.591 | 0.769 | 0.741 | 0.664 | |||
| v3alt.LR.lowECS001.historical | [-] | 4.02 | 3.67 | 2.99 | 4.22 | 0.685 | 2.24 | 1.40 | 0.643 | 0.612 | 0.775 | 0.862 | 0.701 | |||
| v3alt.LR.lowECS002.historical | [-] | 4.09 | 3.63 | 2.99 | 4.35 | 0.648 | 1.96 | 1.28 | 0.671 | 0.657 | 0.802 | 0.876 | 0.733 | |||
| v3alt.LR.lowECS003.historical | [-] | 4.19 | 3.94 | 2.99 | 4.31 | 0.957 | 2.22 | 1.13 | 0.652 | 0.629 | 0.820 | 0.928 | 0.732 |
Download Data |
Period Mean (original grids) [mm d-1] |
Model Period Mean (intersection) [mm d-1] |
Benchmark Period Mean (intersection) [mm d-1] |
Model Period Mean (complement) [mm d-1] |
Benchmark Period Mean (complement) [mm d-1] |
Bias [mm d-1] |
RMSE [mm d-1] |
Phase Shift [months] |
Bias Score [1] |
RMSE Score [1] |
Seasonal Cycle Score [1] |
Spatial Distribution Score [1] |
Overall Score [1] |
|||
|---|---|---|---|---|---|---|---|---|---|---|---|---|---|---|---|---|
| Benchmark | [-] | 2.05 | ||||||||||||||
| v3.LR.historical_0101 | [-] | 2.67 | 2.61 | 2.05 | 2.82 | 0.565 | 0.908 | 1.51 | 0.746 | 0.711 | 0.771 | 0.894 | 0.767 | |||
| v3alt.LR.highECS001.historical | [-] | 2.85 | 2.82 | 2.05 | 2.92 | 0.769 | 1.06 | 1.56 | 0.686 | 0.697 | 0.758 | 0.909 | 0.749 | |||
| v3alt.LR.highECS003.historical | [-] | 2.72 | 2.68 | 2.05 | 2.83 | 0.631 | 0.947 | 1.65 | 0.718 | 0.703 | 0.741 | 0.940 | 0.761 | |||
| v3alt.LR.lowECS001.historical | [-] | 2.63 | 2.60 | 2.05 | 2.70 | 0.557 | 0.942 | 1.60 | 0.733 | 0.699 | 0.749 | 0.904 | 0.757 | |||
| v3alt.LR.lowECS002.historical | [-] | 2.44 | 2.37 | 2.05 | 2.60 | 0.328 | 0.810 | 1.47 | 0.782 | 0.712 | 0.774 | 0.887 | 0.773 | |||
| v3alt.LR.lowECS003.historical | [-] | 2.52 | 2.45 | 2.05 | 2.68 | 0.401 | 0.844 | 1.62 | 0.770 | 0.706 | 0.735 | 0.915 | 0.766 |
Download Data |
Period Mean (original grids) [mm d-1] |
Model Period Mean (intersection) [mm d-1] |
Benchmark Period Mean (intersection) [mm d-1] |
Model Period Mean (complement) [mm d-1] |
Benchmark Period Mean (complement) [mm d-1] |
Bias [mm d-1] |
RMSE [mm d-1] |
Phase Shift [months] |
Bias Score [1] |
RMSE Score [1] |
Seasonal Cycle Score [1] |
Spatial Distribution Score [1] |
Overall Score [1] |
|||
|---|---|---|---|---|---|---|---|---|---|---|---|---|---|---|---|---|
| Benchmark | [-] | 2.26 | ||||||||||||||
| v3.LR.historical_0101 | [-] | 2.62 | 2.58 | 2.26 | 1.70 | 0.318 | 1.15 | 1.20 | 0.717 | 0.658 | 0.845 | 0.959 | 0.768 | |||
| v3alt.LR.highECS001.historical | [-] | 2.79 | 2.75 | 2.26 | 1.80 | 0.492 | 1.27 | 1.27 | 0.686 | 0.648 | 0.834 | 0.957 | 0.755 | |||
| v3alt.LR.highECS003.historical | [-] | 2.75 | 2.71 | 2.26 | 1.77 | 0.445 | 1.22 | 1.28 | 0.700 | 0.652 | 0.836 | 0.959 | 0.760 | |||
| v3alt.LR.lowECS001.historical | [-] | 2.73 | 2.68 | 2.26 | 1.77 | 0.414 | 1.29 | 1.23 | 0.685 | 0.637 | 0.824 | 0.952 | 0.747 | |||
| v3alt.LR.lowECS002.historical | [-] | 2.59 | 2.53 | 2.26 | 1.64 | 0.270 | 1.11 | 1.14 | 0.724 | 0.668 | 0.843 | 0.960 | 0.772 | |||
| v3alt.LR.lowECS003.historical | [-] | 2.78 | 2.72 | 2.26 | 1.73 | 0.457 | 1.28 | 1.16 | 0.691 | 0.639 | 0.841 | 0.941 | 0.750 |
Download Data |
Period Mean (original grids) [mm d-1] |
Model Period Mean (intersection) [mm d-1] |
Benchmark Period Mean (intersection) [mm d-1] |
Model Period Mean (complement) [mm d-1] |
Benchmark Period Mean (complement) [mm d-1] |
Bias [mm d-1] |
RMSE [mm d-1] |
Phase Shift [months] |
Bias Score [1] |
RMSE Score [1] |
Seasonal Cycle Score [1] |
Spatial Distribution Score [1] |
Overall Score [1] |
|||
|---|---|---|---|---|---|---|---|---|---|---|---|---|---|---|---|---|
| Benchmark | [-] | 2.07 | ||||||||||||||
| v3.LR.historical_0101 | [-] | 2.77 | 2.62 | 2.07 | 3.63 | 0.548 | 0.847 | 1.50 | 0.749 | 0.719 | 0.773 | 0.906 | 0.773 | |||
| v3alt.LR.highECS001.historical | [-] | 2.97 | 2.82 | 2.07 | 3.79 | 0.751 | 0.991 | 1.51 | 0.685 | 0.711 | 0.772 | 0.916 | 0.759 | |||
| v3alt.LR.highECS003.historical | [-] | 2.82 | 2.67 | 2.07 | 3.68 | 0.599 | 0.861 | 1.69 | 0.721 | 0.716 | 0.739 | 0.951 | 0.769 | |||
| v3alt.LR.lowECS001.historical | [-] | 2.74 | 2.58 | 2.07 | 3.63 | 0.512 | 0.844 | 1.63 | 0.744 | 0.710 | 0.748 | 0.916 | 0.766 | |||
| v3alt.LR.lowECS002.historical | [-] | 2.50 | 2.35 | 2.07 | 3.36 | 0.274 | 0.737 | 1.47 | 0.796 | 0.716 | 0.773 | 0.896 | 0.779 | |||
| v3alt.LR.lowECS003.historical | [-] | 2.60 | 2.41 | 2.07 | 3.65 | 0.342 | 0.748 | 1.70 | 0.787 | 0.715 | 0.727 | 0.924 | 0.773 |
Temporally integrated period mean