Mean State
Download Data |
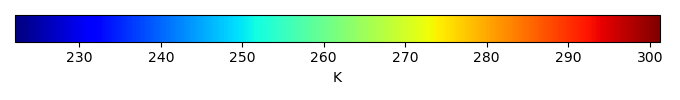
Period Mean (original grids) [K] |
Model Period Mean (intersection) [K] |
Benchmark Period Mean (intersection) [K] |
Model Period Mean (complement) [K] |
Benchmark Period Mean (complement) [K] |
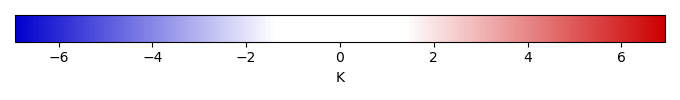
Bias [K] |
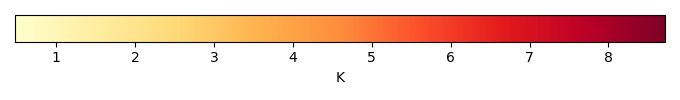
RMSE [K] |
Phase Shift [months] |
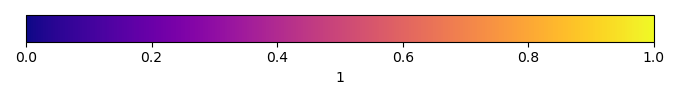
Bias Score [1] |
RMSE Score [1] |
Seasonal Cycle Score [1] |
Spatial Distribution Score [1] |
Overall Score [1] |
|||
|---|---|---|---|---|---|---|---|---|---|---|---|---|---|---|---|---|
| Benchmark | [-] | 268. | ||||||||||||||
| v3.LR.historical_0101 | [-] | 270. | 269. | 268. | 270. | 1.44 | 2.89 | 0.157 | 0.877 | 0.834 | 0.989 | 0.998 | 0.906 | |||
| v3alt.LR.highECS001.historical | [-] | 271. | 271. | 268. | 272. | 2.82 | 4.02 | 0.206 | 0.796 | 0.804 | 0.986 | 0.990 | 0.876 | |||
| v3alt.LR.highECS003.historical | [-] | 271. | 271. | 268. | 272. | 2.81 | 3.91 | 0.190 | 0.798 | 0.818 | 0.987 | 0.984 | 0.881 | |||
| v3alt.LR.lowECS001.historical | [-] | 269. | 269. | 268. | 270. | 0.822 | 2.82 | 0.0902 | 0.900 | 0.825 | 0.994 | 0.990 | 0.907 | |||
| v3alt.LR.lowECS002.historical | [-] | 264. | 264. | 268. | 265. | -3.87 | 4.91 | 0.0817 | 0.724 | 0.797 | 0.995 | 0.999 | 0.862 | |||
| v3alt.LR.lowECS003.historical | [-] | 266. | 265. | 268. | 266. | -2.36 | 3.54 | 0.0949 | 0.817 | 0.824 | 0.994 | 1.00 | 0.892 |
Download Data |
Period Mean (original grids) [K] |
Model Period Mean (intersection) [K] |
Benchmark Period Mean (intersection) [K] |
Model Period Mean (complement) [K] |
Benchmark Period Mean (complement) [K] |
Bias [K] |
RMSE [K] |
Phase Shift [months] |
Bias Score [1] |
RMSE Score [1] |
Seasonal Cycle Score [1] |
Spatial Distribution Score [1] |
Overall Score [1] |
|||
|---|---|---|---|---|---|---|---|---|---|---|---|---|---|---|---|---|
| Benchmark | [-] | 296. | ||||||||||||||
| v3.LR.historical_0101 | [-] | 298. | 295. | 296. | 299. | -0.638 | 2.01 | 0.731 | 0.597 | 0.758 | 0.930 | 0.988 | 0.806 | |||
| v3alt.LR.highECS001.historical | [-] | 298. | 295. | 296. | 299. | -0.778 | 2.07 | 0.852 | 0.590 | 0.748 | 0.907 | 0.985 | 0.796 | |||
| v3alt.LR.highECS003.historical | [-] | 298. | 295. | 296. | 299. | -0.426 | 1.94 | 0.772 | 0.597 | 0.772 | 0.914 | 0.989 | 0.809 | |||
| v3alt.LR.lowECS001.historical | [-] | 297. | 294. | 296. | 299. | -1.24 | 2.26 | 0.670 | 0.558 | 0.759 | 0.932 | 0.986 | 0.799 | |||
| v3alt.LR.lowECS002.historical | [-] | 296. | 293. | 296. | 297. | -2.98 | 3.33 | 0.646 | 0.424 | 0.747 | 0.940 | 0.983 | 0.768 | |||
| v3alt.LR.lowECS003.historical | [-] | 296. | 293. | 296. | 298. | -2.47 | 2.96 | 0.841 | 0.476 | 0.749 | 0.910 | 0.976 | 0.772 |
Download Data |
Period Mean (original grids) [K] |
Model Period Mean (intersection) [K] |
Benchmark Period Mean (intersection) [K] |
Model Period Mean (complement) [K] |
Benchmark Period Mean (complement) [K] |
Bias [K] |
RMSE [K] |
Phase Shift [months] |
Bias Score [1] |
RMSE Score [1] |
Seasonal Cycle Score [1] |
Spatial Distribution Score [1] |
Overall Score [1] |
|||
|---|---|---|---|---|---|---|---|---|---|---|---|---|---|---|---|---|
| Benchmark | [-] | 285. | ||||||||||||||
| v3.LR.historical_0101 | [-] | 287. | 285. | 285. | 294. | -0.422 | 1.80 | 0.404 | 0.857 | 0.865 | 0.972 | 0.997 | 0.911 | |||
| v3alt.LR.highECS001.historical | [-] | 288. | 285. | 285. | 294. | 0.155 | 1.97 | 0.696 | 0.843 | 0.862 | 0.952 | 0.986 | 0.901 | |||
| v3alt.LR.highECS003.historical | [-] | 288. | 286. | 285. | 295. | 0.549 | 1.82 | 0.311 | 0.845 | 0.881 | 0.978 | 0.989 | 0.915 | |||
| v3alt.LR.lowECS001.historical | [-] | 287. | 284. | 285. | 294. | -0.884 | 2.08 | 0.277 | 0.827 | 0.862 | 0.981 | 0.997 | 0.906 | |||
| v3alt.LR.lowECS002.historical | [-] | 284. | 281. | 285. | 292. | -3.72 | 4.13 | 0.265 | 0.637 | 0.838 | 0.982 | 0.998 | 0.859 | |||
| v3alt.LR.lowECS003.historical | [-] | 285. | 282. | 285. | 293. | -2.68 | 3.18 | 0.197 | 0.714 | 0.854 | 0.987 | 1.00 | 0.882 |
Download Data |
Period Mean (original grids) [K] |
Model Period Mean (intersection) [K] |
Benchmark Period Mean (intersection) [K] |
Model Period Mean (complement) [K] |
Benchmark Period Mean (complement) [K] |
Bias [K] |
RMSE [K] |
Phase Shift [months] |
Bias Score [1] |
RMSE Score [1] |
Seasonal Cycle Score [1] |
Spatial Distribution Score [1] |
Overall Score [1] |
|||
|---|---|---|---|---|---|---|---|---|---|---|---|---|---|---|---|---|
| Benchmark | [-] | 287. | ||||||||||||||
| v3.LR.historical_0101 | [-] | 286. | 287. | 287. | 264. | -0.208 | 2.07 | 0.485 | 0.732 | 0.763 | 0.949 | 0.999 | 0.841 | |||
| v3alt.LR.highECS001.historical | [-] | 286. | 287. | 287. | 265. | 0.113 | 2.25 | 0.528 | 0.714 | 0.765 | 0.946 | 0.993 | 0.836 | |||
| v3alt.LR.highECS003.historical | [-] | 286. | 287. | 287. | 265. | 0.489 | 2.19 | 0.468 | 0.729 | 0.769 | 0.950 | 0.995 | 0.842 | |||
| v3alt.LR.lowECS001.historical | [-] | 286. | 286. | 287. | 264. | -0.432 | 2.15 | 0.469 | 0.718 | 0.760 | 0.949 | 0.997 | 0.837 | |||
| v3alt.LR.lowECS002.historical | [-] | 283. | 283. | 287. | 262. | -3.36 | 3.89 | 0.442 | 0.516 | 0.760 | 0.952 | 0.998 | 0.797 | |||
| v3alt.LR.lowECS003.historical | [-] | 284. | 284. | 287. | 262. | -2.43 | 3.09 | 0.421 | 0.585 | 0.768 | 0.956 | 1.00 | 0.815 |
Download Data |
Period Mean (original grids) [K] |
Model Period Mean (intersection) [K] |
Benchmark Period Mean (intersection) [K] |
Model Period Mean (complement) [K] |
Benchmark Period Mean (complement) [K] |
Bias [K] |
RMSE [K] |
Phase Shift [months] |
Bias Score [1] |
RMSE Score [1] |
Seasonal Cycle Score [1] |
Spatial Distribution Score [1] |
Overall Score [1] |
|||
|---|---|---|---|---|---|---|---|---|---|---|---|---|---|---|---|---|
| Benchmark | [-] | 283. | ||||||||||||||
| v3.LR.historical_0101 | [-] | 285. | 283. | 283. | 291. | -0.358 | 1.77 | 0.377 | 0.877 | 0.870 | 0.975 | 0.995 | 0.917 | |||
| v3alt.LR.highECS001.historical | [-] | 285. | 284. | 283. | 292. | 0.327 | 1.94 | 0.724 | 0.862 | 0.866 | 0.951 | 0.982 | 0.905 | |||
| v3alt.LR.highECS003.historical | [-] | 286. | 284. | 283. | 292. | 0.717 | 1.80 | 0.274 | 0.863 | 0.884 | 0.982 | 0.987 | 0.920 | |||
| v3alt.LR.lowECS001.historical | [-] | 284. | 283. | 283. | 292. | -0.808 | 2.02 | 0.238 | 0.851 | 0.864 | 0.984 | 0.995 | 0.912 | |||
| v3alt.LR.lowECS002.historical | [-] | 281. | 280. | 283. | 289. | -3.81 | 4.23 | 0.227 | 0.649 | 0.839 | 0.985 | 0.999 | 0.862 | |||
| v3alt.LR.lowECS003.historical | [-] | 282. | 281. | 283. | 290. | -2.69 | 3.19 | 0.140 | 0.732 | 0.855 | 0.991 | 1.00 | 0.887 |
Temporally integrated period mean