Mean State
Download Data |
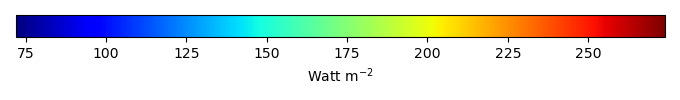
Period Mean (original grids) [Watt m-2] |
Model Period Mean (intersection) [Watt m-2] |
Benchmark Period Mean (intersection) [Watt m-2] |
Model Period Mean (complement) [Watt m-2] |
Benchmark Period Mean (complement) [Watt m-2] |
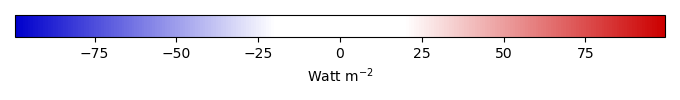
Bias [Watt m-2] |
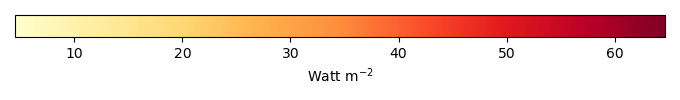
RMSE [Watt m-2] |
Phase Shift [months] |
Bias Score [1] |
RMSE Score [1] |
Seasonal Cycle Score [1] |
Spatial Distribution Score [1] |
Overall Score [1] |
|||
|---|---|---|---|---|---|---|---|---|---|---|---|---|---|---|---|---|
| Benchmark | [-] | 118. | ||||||||||||||
| v3.LR.historical_0101 | [-] | 103. | 103. | 118. | -15.3 | 25.1 | 0.514 | 0.838 | 0.779 | 0.963 | 0.820 | 0.836 | ||||
| v3alt.LR.highECS001.historical | [-] | 109. | 109. | 118. | -9.21 | 20.3 | 0.333 | 0.877 | 0.796 | 0.976 | 0.885 | 0.866 | ||||
| v3alt.LR.highECS003.historical | [-] | 106. | 106. | 118. | -12.6 | 22.4 | 0.463 | 0.861 | 0.790 | 0.965 | 0.806 | 0.842 | ||||
| v3alt.LR.lowECS001.historical | [-] | 103. | 103. | 118. | -15.3 | 25.5 | 0.516 | 0.834 | 0.773 | 0.962 | 0.838 | 0.836 | ||||
| v3alt.LR.lowECS002.historical | [-] | 106. | 106. | 118. | -12.5 | 26.8 | 0.683 | 0.849 | 0.748 | 0.948 | 0.935 | 0.846 | ||||
| v3alt.LR.lowECS003.historical | [-] | 104. | 104. | 118. | -14.3 | 27.2 | 0.651 | 0.840 | 0.752 | 0.951 | 0.916 | 0.842 |
Download Data |
Period Mean (original grids) [Watt m-2] |
Model Period Mean (intersection) [Watt m-2] |
Benchmark Period Mean (intersection) [Watt m-2] |
Model Period Mean (complement) [Watt m-2] |
Benchmark Period Mean (complement) [Watt m-2] |
Bias [Watt m-2] |
RMSE [Watt m-2] |
Phase Shift [months] |
Bias Score [1] |
RMSE Score [1] |
Seasonal Cycle Score [1] |
Spatial Distribution Score [1] |
Overall Score [1] |
|||
|---|---|---|---|---|---|---|---|---|---|---|---|---|---|---|---|---|
| Benchmark | [-] | 233. | ||||||||||||||
| v3.LR.historical_0101 | [-] | 235. | 234. | 233. | 1.87 | 19.6 | 0.755 | 0.756 | 0.726 | 0.937 | 0.889 | 0.807 | ||||
| v3alt.LR.highECS001.historical | [-] | 232. | 231. | 233. | -1.25 | 19.4 | 0.737 | 0.745 | 0.727 | 0.939 | 0.927 | 0.813 | ||||
| v3alt.LR.highECS003.historical | [-] | 232. | 231. | 233. | -1.14 | 18.1 | 0.648 | 0.762 | 0.739 | 0.950 | 0.827 | 0.803 | ||||
| v3alt.LR.lowECS001.historical | [-] | 223. | 222. | 233. | -10.3 | 22.3 | 0.593 | 0.696 | 0.693 | 0.955 | 0.920 | 0.791 | ||||
| v3alt.LR.lowECS002.historical | [-] | 226. | 226. | 233. | -7.10 | 21.5 | 0.679 | 0.711 | 0.694 | 0.949 | 0.854 | 0.780 | ||||
| v3alt.LR.lowECS003.historical | [-] | 226. | 226. | 233. | -6.48 | 18.3 | 0.539 | 0.746 | 0.733 | 0.958 | 0.886 | 0.811 |
Download Data |
Period Mean (original grids) [Watt m-2] |
Model Period Mean (intersection) [Watt m-2] |
Benchmark Period Mean (intersection) [Watt m-2] |
Model Period Mean (complement) [Watt m-2] |
Benchmark Period Mean (complement) [Watt m-2] |
Bias [Watt m-2] |
RMSE [Watt m-2] |
Phase Shift [months] |
Bias Score [1] |
RMSE Score [1] |
Seasonal Cycle Score [1] |
Spatial Distribution Score [1] |
Overall Score [1] |
|||
|---|---|---|---|---|---|---|---|---|---|---|---|---|---|---|---|---|
| Benchmark | [-] | 191. | ||||||||||||||
| v3.LR.historical_0101 | [-] | 195. | 195. | 191. | 4.24 | 17.3 | 0.519 | 0.849 | 0.822 | 0.961 | 0.996 | 0.890 | ||||
| v3alt.LR.highECS001.historical | [-] | 193. | 193. | 191. | 2.55 | 16.6 | 0.584 | 0.851 | 0.830 | 0.955 | 0.999 | 0.893 | ||||
| v3alt.LR.highECS003.historical | [-] | 195. | 195. | 191. | 4.82 | 16.1 | 0.521 | 0.853 | 0.837 | 0.962 | 0.999 | 0.898 | ||||
| v3alt.LR.lowECS001.historical | [-] | 192. | 192. | 191. | 1.76 | 15.6 | 0.592 | 0.863 | 0.834 | 0.955 | 0.998 | 0.897 | ||||
| v3alt.LR.lowECS002.historical | [-] | 192. | 192. | 191. | 1.91 | 17.4 | 0.587 | 0.848 | 0.825 | 0.955 | 0.994 | 0.889 | ||||
| v3alt.LR.lowECS003.historical | [-] | 192. | 192. | 191. | 1.08 | 15.2 | 0.512 | 0.871 | 0.842 | 0.961 | 0.994 | 0.902 |
Download Data |
Period Mean (original grids) [Watt m-2] |
Model Period Mean (intersection) [Watt m-2] |
Benchmark Period Mean (intersection) [Watt m-2] |
Model Period Mean (complement) [Watt m-2] |
Benchmark Period Mean (complement) [Watt m-2] |
Bias [Watt m-2] |
RMSE [Watt m-2] |
Phase Shift [months] |
Bias Score [1] |
RMSE Score [1] |
Seasonal Cycle Score [1] |
Spatial Distribution Score [1] |
Overall Score [1] |
|||
|---|---|---|---|---|---|---|---|---|---|---|---|---|---|---|---|---|
| Benchmark | [-] | 187. | ||||||||||||||
| v3.LR.historical_0101 | [-] | 203. | 191. | 187. | 4.78 | 23.3 | 0.659 | 0.741 | 0.711 | 0.934 | 0.965 | 0.812 | ||||
| v3alt.LR.highECS001.historical | [-] | 200. | 190. | 187. | 3.13 | 21.7 | 0.664 | 0.765 | 0.717 | 0.931 | 0.976 | 0.821 | ||||
| v3alt.LR.highECS003.historical | [-] | 199. | 189. | 187. | 2.26 | 21.4 | 0.632 | 0.766 | 0.723 | 0.936 | 0.976 | 0.825 | ||||
| v3alt.LR.lowECS001.historical | [-] | 195. | 185. | 187. | -1.99 | 23.0 | 0.632 | 0.752 | 0.707 | 0.935 | 0.980 | 0.816 | ||||
| v3alt.LR.lowECS002.historical | [-] | 196. | 186. | 187. | -0.731 | 23.3 | 0.644 | 0.758 | 0.710 | 0.936 | 0.982 | 0.819 | ||||
| v3alt.LR.lowECS003.historical | [-] | 195. | 185. | 187. | -1.31 | 22.7 | 0.646 | 0.760 | 0.713 | 0.936 | 0.981 | 0.821 |
Download Data |
Period Mean (original grids) [Watt m-2] |
Model Period Mean (intersection) [Watt m-2] |
Benchmark Period Mean (intersection) [Watt m-2] |
Model Period Mean (complement) [Watt m-2] |
Benchmark Period Mean (complement) [Watt m-2] |
Bias [Watt m-2] |
RMSE [Watt m-2] |
Phase Shift [months] |
Bias Score [1] |
RMSE Score [1] |
Seasonal Cycle Score [1] |
Spatial Distribution Score [1] |
Overall Score [1] |
|||
|---|---|---|---|---|---|---|---|---|---|---|---|---|---|---|---|---|
| Benchmark | [-] | 178. | ||||||||||||||
| v3.LR.historical_0101 | [-] | 184. | 183. | 178. | 4.92 | 17.8 | 0.458 | 0.860 | 0.824 | 0.968 | 0.978 | 0.891 | ||||
| v3alt.LR.highECS001.historical | [-] | 182. | 182. | 178. | 3.12 | 16.1 | 0.520 | 0.875 | 0.841 | 0.963 | 0.995 | 0.903 | ||||
| v3alt.LR.highECS003.historical | [-] | 185. | 184. | 178. | 5.52 | 15.9 | 0.429 | 0.870 | 0.848 | 0.971 | 0.990 | 0.905 | ||||
| v3alt.LR.lowECS001.historical | [-] | 182. | 181. | 178. | 2.56 | 14.3 | 0.545 | 0.894 | 0.852 | 0.962 | 0.990 | 0.910 | ||||
| v3alt.LR.lowECS002.historical | [-] | 183. | 182. | 178. | 3.35 | 18.4 | 0.564 | 0.852 | 0.824 | 0.959 | 0.960 | 0.884 | ||||
| v3alt.LR.lowECS003.historical | [-] | 181. | 180. | 178. | 1.87 | 16.1 | 0.500 | 0.876 | 0.842 | 0.965 | 0.967 | 0.898 |
Temporally integrated period mean