Mean State
Download Data |
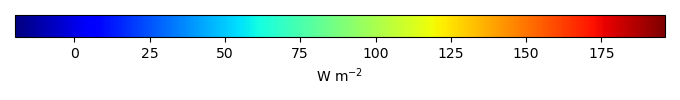
Period Mean (original grids) [W m-2] |
Model Period Mean (intersection) [W m-2] |
Benchmark Period Mean (intersection) [W m-2] |
Model Period Mean (complement) [W m-2] |
Benchmark Period Mean (complement) [W m-2] |
Bias [W m-2] |
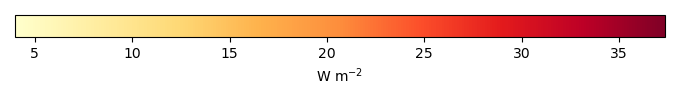
RMSE [W m-2] |
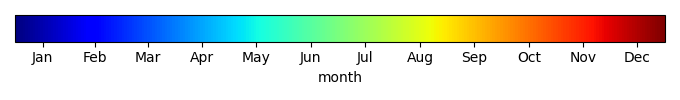
Phase Shift [months] |
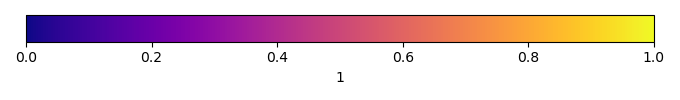
Bias Score [1] |
RMSE Score [1] |
Seasonal Cycle Score [1] |
Spatial Distribution Score [1] |
Overall Score [1] |
|||
|---|---|---|---|---|---|---|---|---|---|---|---|---|---|---|---|---|
| Benchmark | [-] | 36.0 | ||||||||||||||
| v3.LR.historical_0101 | [-] | 38.0 | 38.0 | 36.0 | 2.01 | 14.3 | 0.240 | 0.914 | 0.804 | 0.984 | 0.980 | 0.897 | ||||
| v3alt.LR.highECS001.historical | [-] | 42.8 | 42.8 | 36.0 | 6.85 | 18.4 | 0.264 | 0.864 | 0.768 | 0.983 | 0.971 | 0.871 | ||||
| v3alt.LR.highECS003.historical | [-] | 40.4 | 40.4 | 36.0 | 4.40 | 16.1 | 0.278 | 0.889 | 0.788 | 0.982 | 0.975 | 0.884 | ||||
| v3alt.LR.lowECS001.historical | [-] | 36.0 | 36.0 | 36.0 | -0.0297 | 15.7 | 0.267 | 0.906 | 0.786 | 0.982 | 0.961 | 0.884 | ||||
| v3alt.LR.lowECS002.historical | [-] | 31.9 | 31.9 | 36.0 | -4.09 | 14.8 | 0.190 | 0.905 | 0.806 | 0.987 | 0.978 | 0.896 | ||||
| v3alt.LR.lowECS003.historical | [-] | 32.5 | 32.5 | 36.0 | -3.51 | 14.7 | 0.136 | 0.908 | 0.806 | 0.991 | 0.976 | 0.897 |
Download Data |
Period Mean (original grids) [W m-2] |
Model Period Mean (intersection) [W m-2] |
Benchmark Period Mean (intersection) [W m-2] |
Model Period Mean (complement) [W m-2] |
Benchmark Period Mean (complement) [W m-2] |
Bias [W m-2] |
RMSE [W m-2] |
Phase Shift [months] |
Bias Score [1] |
RMSE Score [1] |
Seasonal Cycle Score [1] |
Spatial Distribution Score [1] |
Overall Score [1] |
|||
|---|---|---|---|---|---|---|---|---|---|---|---|---|---|---|---|---|
| Benchmark | [-] | 148. | ||||||||||||||
| v3.LR.historical_0101 | [-] | 151. | 150. | 148. | 1.51 | 14.9 | 0.833 | 0.787 | 0.719 | 0.917 | 0.915 | 0.812 | ||||
| v3alt.LR.highECS001.historical | [-] | 150. | 150. | 148. | 1.10 | 14.6 | 0.857 | 0.790 | 0.721 | 0.918 | 0.906 | 0.811 | ||||
| v3alt.LR.highECS003.historical | [-] | 151. | 150. | 148. | 1.79 | 13.5 | 0.791 | 0.806 | 0.737 | 0.918 | 0.944 | 0.828 | ||||
| v3alt.LR.lowECS001.historical | [-] | 143. | 142. | 148. | -6.43 | 17.5 | 0.917 | 0.722 | 0.684 | 0.903 | 0.877 | 0.774 | ||||
| v3alt.LR.lowECS002.historical | [-] | 142. | 141. | 148. | -7.22 | 18.9 | 0.876 | 0.702 | 0.669 | 0.909 | 0.823 | 0.755 | ||||
| v3alt.LR.lowECS003.historical | [-] | 144. | 143. | 148. | -5.01 | 15.0 | 0.876 | 0.756 | 0.726 | 0.899 | 0.912 | 0.804 |
Download Data |
Period Mean (original grids) [W m-2] |
Model Period Mean (intersection) [W m-2] |
Benchmark Period Mean (intersection) [W m-2] |
Model Period Mean (complement) [W m-2] |
Benchmark Period Mean (complement) [W m-2] |
Bias [W m-2] |
RMSE [W m-2] |
Phase Shift [months] |
Bias Score [1] |
RMSE Score [1] |
Seasonal Cycle Score [1] |
Spatial Distribution Score [1] |
Overall Score [1] |
|||
|---|---|---|---|---|---|---|---|---|---|---|---|---|---|---|---|---|
| Benchmark | [-] | 105. | ||||||||||||||
| v3.LR.historical_0101 | [-] | 105. | 105. | 105. | 0.394 | 10.6 | 0.525 | 0.900 | 0.862 | 0.960 | 0.998 | 0.916 | ||||
| v3alt.LR.highECS001.historical | [-] | 107. | 107. | 105. | 2.09 | 10.4 | 0.558 | 0.891 | 0.871 | 0.959 | 0.997 | 0.918 | ||||
| v3alt.LR.highECS003.historical | [-] | 107. | 107. | 105. | 1.97 | 10.2 | 0.532 | 0.897 | 0.872 | 0.960 | 0.999 | 0.920 | ||||
| v3alt.LR.lowECS001.historical | [-] | 102. | 102. | 105. | -2.54 | 10.4 | 0.603 | 0.894 | 0.871 | 0.955 | 0.998 | 0.918 | ||||
| v3alt.LR.lowECS002.historical | [-] | 98.7 | 98.7 | 105. | -5.85 | 12.8 | 0.531 | 0.860 | 0.854 | 0.960 | 0.998 | 0.905 | ||||
| v3alt.LR.lowECS003.historical | [-] | 99.5 | 99.5 | 105. | -5.07 | 11.7 | 0.541 | 0.872 | 0.864 | 0.960 | 0.998 | 0.911 |
Download Data |
Period Mean (original grids) [W m-2] |
Model Period Mean (intersection) [W m-2] |
Benchmark Period Mean (intersection) [W m-2] |
Model Period Mean (complement) [W m-2] |
Benchmark Period Mean (complement) [W m-2] |
Bias [W m-2] |
RMSE [W m-2] |
Phase Shift [months] |
Bias Score [1] |
RMSE Score [1] |
Seasonal Cycle Score [1] |
Spatial Distribution Score [1] |
Overall Score [1] |
|||
|---|---|---|---|---|---|---|---|---|---|---|---|---|---|---|---|---|
| Benchmark | [-] | 82.5 | ||||||||||||||
| v3.LR.historical_0101 | [-] | 92.5 | 83.4 | 82.5 | 0.847 | 14.1 | 0.794 | 0.761 | 0.730 | 0.907 | 0.992 | 0.824 | ||||
| v3alt.LR.highECS001.historical | [-] | 92.7 | 84.1 | 82.5 | 1.57 | 14.3 | 0.841 | 0.750 | 0.730 | 0.900 | 0.991 | 0.820 | ||||
| v3alt.LR.highECS003.historical | [-] | 92.0 | 83.3 | 82.5 | 0.784 | 14.1 | 0.813 | 0.754 | 0.734 | 0.903 | 0.992 | 0.823 | ||||
| v3alt.LR.lowECS001.historical | [-] | 87.9 | 79.3 | 82.5 | -3.28 | 15.0 | 0.836 | 0.738 | 0.724 | 0.898 | 0.993 | 0.815 | ||||
| v3alt.LR.lowECS002.historical | [-] | 86.8 | 77.8 | 82.5 | -4.80 | 15.3 | 0.807 | 0.733 | 0.725 | 0.902 | 0.993 | 0.816 | ||||
| v3alt.LR.lowECS003.historical | [-] | 87.1 | 78.1 | 82.5 | -4.48 | 14.9 | 0.781 | 0.737 | 0.730 | 0.908 | 0.993 | 0.820 |
Download Data |
Period Mean (original grids) [W m-2] |
Model Period Mean (intersection) [W m-2] |
Benchmark Period Mean (intersection) [W m-2] |
Model Period Mean (complement) [W m-2] |
Benchmark Period Mean (complement) [W m-2] |
Bias [W m-2] |
RMSE [W m-2] |
Phase Shift [months] |
Bias Score [1] |
RMSE Score [1] |
Seasonal Cycle Score [1] |
Spatial Distribution Score [1] |
Overall Score [1] |
|||
|---|---|---|---|---|---|---|---|---|---|---|---|---|---|---|---|---|
| Benchmark | [-] | 92.2 | ||||||||||||||
| v3.LR.historical_0101 | [-] | 93.5 | 92.6 | 92.2 | 0.467 | 10.1 | 0.408 | 0.913 | 0.874 | 0.972 | 0.998 | 0.926 | ||||
| v3alt.LR.highECS001.historical | [-] | 95.4 | 94.5 | 92.2 | 2.38 | 9.64 | 0.497 | 0.908 | 0.885 | 0.966 | 0.999 | 0.929 | ||||
| v3alt.LR.highECS003.historical | [-] | 94.8 | 93.9 | 92.2 | 1.77 | 9.52 | 0.453 | 0.909 | 0.885 | 0.969 | 0.997 | 0.929 | ||||
| v3alt.LR.lowECS001.historical | [-] | 90.6 | 89.7 | 92.2 | -2.44 | 9.59 | 0.547 | 0.912 | 0.883 | 0.963 | 0.999 | 0.928 | ||||
| v3alt.LR.lowECS002.historical | [-] | 87.3 | 86.4 | 92.2 | -5.78 | 12.3 | 0.482 | 0.882 | 0.857 | 0.967 | 0.995 | 0.911 | ||||
| v3alt.LR.lowECS003.historical | [-] | 87.6 | 86.7 | 92.2 | -5.51 | 11.6 | 0.500 | 0.884 | 0.866 | 0.966 | 0.995 | 0.915 |
Temporally integrated period mean