Mean State
Download Data |
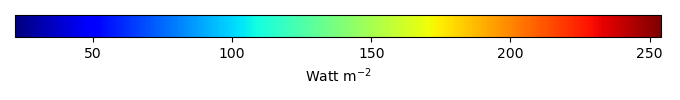
Period Mean (original grids) [Watt m-2] |
Model Period Mean (intersection) [Watt m-2] |
Benchmark Period Mean (intersection) [Watt m-2] |
Model Period Mean (complement) [Watt m-2] |
Benchmark Period Mean (complement) [Watt m-2] |
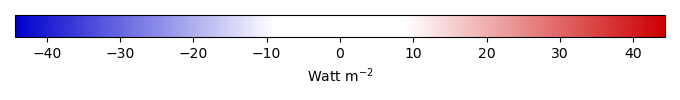
Bias [Watt m-2] |
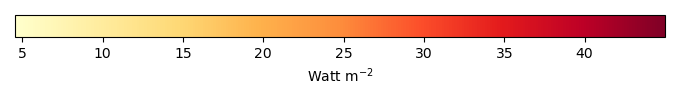
RMSE [Watt m-2] |
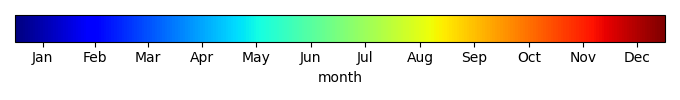
Phase Shift [months] |
Bias Score [1] |
RMSE Score [1] |
Seasonal Cycle Score [1] |
Spatial Distribution Score [1] |
Overall Score [1] |
|||
|---|---|---|---|---|---|---|---|---|---|---|---|---|---|---|---|---|
| Benchmark | [-] | 87.7 | ||||||||||||||
| v3.LR.historical_0101 | [-] | 73.6 | 73.6 | 87.7 | -14.1 | 18.4 | 0.303 | 0.803 | 0.800 | 0.980 | 0.925 | 0.862 | ||||
| v3alt.LR.highECS001.historical | [-] | 80.5 | 80.5 | 87.7 | -7.19 | 15.5 | 0.230 | 0.869 | 0.795 | 0.985 | 0.958 | 0.880 | ||||
| v3alt.LR.highECS003.historical | [-] | 77.6 | 77.6 | 87.7 | -10.1 | 15.5 | 0.319 | 0.846 | 0.807 | 0.979 | 0.938 | 0.875 | ||||
| v3alt.LR.lowECS001.historical | [-] | 73.4 | 73.4 | 87.7 | -14.3 | 18.9 | 0.366 | 0.801 | 0.792 | 0.976 | 0.949 | 0.862 | ||||
| v3alt.LR.lowECS002.historical | [-] | 67.8 | 67.8 | 87.7 | -19.8 | 24.6 | 0.262 | 0.736 | 0.764 | 0.983 | 0.943 | 0.838 | ||||
| v3alt.LR.lowECS003.historical | [-] | 68.9 | 68.9 | 87.7 | -18.8 | 23.4 | 0.187 | 0.748 | 0.771 | 0.988 | 0.937 | 0.843 |
Download Data |
Period Mean (original grids) [Watt m-2] |
Model Period Mean (intersection) [Watt m-2] |
Benchmark Period Mean (intersection) [Watt m-2] |
Model Period Mean (complement) [Watt m-2] |
Benchmark Period Mean (complement) [Watt m-2] |
Bias [Watt m-2] |
RMSE [Watt m-2] |
Phase Shift [months] |
Bias Score [1] |
RMSE Score [1] |
Seasonal Cycle Score [1] |
Spatial Distribution Score [1] |
Overall Score [1] |
|||
|---|---|---|---|---|---|---|---|---|---|---|---|---|---|---|---|---|
| Benchmark | [-] | 214. | ||||||||||||||
| v3.LR.historical_0101 | [-] | 216. | 215. | 214. | 1.42 | 19.2 | 0.779 | 0.749 | 0.709 | 0.935 | 0.738 | 0.768 | ||||
| v3alt.LR.highECS001.historical | [-] | 213. | 213. | 214. | -1.33 | 19.1 | 0.763 | 0.738 | 0.711 | 0.937 | 0.808 | 0.781 | ||||
| v3alt.LR.highECS003.historical | [-] | 213. | 213. | 214. | -1.26 | 17.6 | 0.668 | 0.755 | 0.728 | 0.948 | 0.753 | 0.782 | ||||
| v3alt.LR.lowECS001.historical | [-] | 205. | 204. | 214. | -9.64 | 21.5 | 0.610 | 0.686 | 0.686 | 0.954 | 0.837 | 0.770 | ||||
| v3alt.LR.lowECS002.historical | [-] | 208. | 207. | 214. | -6.76 | 20.8 | 0.691 | 0.703 | 0.684 | 0.949 | 0.731 | 0.750 | ||||
| v3alt.LR.lowECS003.historical | [-] | 209. | 208. | 214. | -5.95 | 17.8 | 0.547 | 0.739 | 0.727 | 0.958 | 0.868 | 0.804 |
Download Data |
Period Mean (original grids) [Watt m-2] |
Model Period Mean (intersection) [Watt m-2] |
Benchmark Period Mean (intersection) [Watt m-2] |
Model Period Mean (complement) [Watt m-2] |
Benchmark Period Mean (complement) [Watt m-2] |
Bias [Watt m-2] |
RMSE [Watt m-2] |
Phase Shift [months] |
Bias Score [1] |
RMSE Score [1] |
Seasonal Cycle Score [1] |
Spatial Distribution Score [1] |
Overall Score [1] |
|||
|---|---|---|---|---|---|---|---|---|---|---|---|---|---|---|---|---|
| Benchmark | [-] | 169. | ||||||||||||||
| v3.LR.historical_0101 | [-] | 169. | 169. | 169. | -0.352 | 16.1 | 0.521 | 0.865 | 0.806 | 0.960 | 0.994 | 0.886 | ||||
| v3alt.LR.highECS001.historical | [-] | 168. | 168. | 169. | -0.626 | 15.2 | 0.594 | 0.857 | 0.824 | 0.954 | 0.998 | 0.891 | ||||
| v3alt.LR.highECS003.historical | [-] | 170. | 170. | 169. | 1.09 | 14.3 | 0.543 | 0.867 | 0.829 | 0.960 | 0.997 | 0.897 | ||||
| v3alt.LR.lowECS001.historical | [-] | 166. | 166. | 169. | -2.64 | 14.9 | 0.581 | 0.862 | 0.828 | 0.955 | 0.992 | 0.893 | ||||
| v3alt.LR.lowECS002.historical | [-] | 164. | 164. | 169. | -5.33 | 17.5 | 0.595 | 0.851 | 0.805 | 0.953 | 0.984 | 0.880 | ||||
| v3alt.LR.lowECS003.historical | [-] | 164. | 164. | 169. | -4.94 | 15.6 | 0.522 | 0.860 | 0.828 | 0.960 | 0.984 | 0.892 |
Download Data |
Period Mean (original grids) [Watt m-2] |
Model Period Mean (intersection) [Watt m-2] |
Benchmark Period Mean (intersection) [Watt m-2] |
Model Period Mean (complement) [Watt m-2] |
Benchmark Period Mean (complement) [Watt m-2] |
Bias [Watt m-2] |
RMSE [Watt m-2] |
Phase Shift [months] |
Bias Score [1] |
RMSE Score [1] |
Seasonal Cycle Score [1] |
Spatial Distribution Score [1] |
Overall Score [1] |
|||
|---|---|---|---|---|---|---|---|---|---|---|---|---|---|---|---|---|
| Benchmark | [-] | 145. | ||||||||||||||
| v3.LR.historical_0101 | [-] | 161. | 148. | 145. | 2.84 | 19.7 | 0.682 | 0.725 | 0.697 | 0.931 | 0.957 | 0.802 | ||||
| v3alt.LR.highECS001.historical | [-] | 159. | 147. | 145. | 2.14 | 18.1 | 0.719 | 0.754 | 0.707 | 0.927 | 0.967 | 0.812 | ||||
| v3alt.LR.highECS003.historical | [-] | 158. | 146. | 145. | 1.26 | 17.7 | 0.679 | 0.758 | 0.714 | 0.932 | 0.968 | 0.817 | ||||
| v3alt.LR.lowECS001.historical | [-] | 154. | 142. | 145. | -2.75 | 18.5 | 0.666 | 0.753 | 0.703 | 0.934 | 0.975 | 0.814 | ||||
| v3alt.LR.lowECS002.historical | [-] | 153. | 141. | 145. | -4.09 | 19.5 | 0.650 | 0.745 | 0.702 | 0.936 | 0.971 | 0.811 | ||||
| v3alt.LR.lowECS003.historical | [-] | 154. | 141. | 145. | -3.77 | 18.8 | 0.634 | 0.748 | 0.709 | 0.938 | 0.972 | 0.815 |
Download Data |
Period Mean (original grids) [Watt m-2] |
Model Period Mean (intersection) [Watt m-2] |
Benchmark Period Mean (intersection) [Watt m-2] |
Model Period Mean (complement) [Watt m-2] |
Benchmark Period Mean (complement) [Watt m-2] |
Bias [Watt m-2] |
RMSE [Watt m-2] |
Phase Shift [months] |
Bias Score [1] |
RMSE Score [1] |
Seasonal Cycle Score [1] |
Spatial Distribution Score [1] |
Overall Score [1] |
|||
|---|---|---|---|---|---|---|---|---|---|---|---|---|---|---|---|---|
| Benchmark | [-] | 155. | ||||||||||||||
| v3.LR.historical_0101 | [-] | 155. | 154. | 155. | -1.12 | 16.4 | 0.448 | 0.883 | 0.808 | 0.968 | 0.975 | 0.888 | ||||
| v3alt.LR.highECS001.historical | [-] | 155. | 154. | 155. | -1.06 | 14.3 | 0.525 | 0.886 | 0.837 | 0.962 | 0.990 | 0.903 | ||||
| v3alt.LR.highECS003.historical | [-] | 157. | 156. | 155. | 0.658 | 13.6 | 0.439 | 0.893 | 0.842 | 0.970 | 0.988 | 0.907 | ||||
| v3alt.LR.lowECS001.historical | [-] | 153. | 152. | 155. | -3.45 | 13.5 | 0.523 | 0.897 | 0.847 | 0.963 | 0.981 | 0.907 | ||||
| v3alt.LR.lowECS002.historical | [-] | 150. | 149. | 155. | -6.57 | 18.7 | 0.563 | 0.857 | 0.800 | 0.957 | 0.955 | 0.874 | ||||
| v3alt.LR.lowECS003.historical | [-] | 150. | 149. | 155. | -6.39 | 16.8 | 0.501 | 0.865 | 0.824 | 0.964 | 0.960 | 0.888 |
Temporally integrated period mean