Mean State
Download Data |
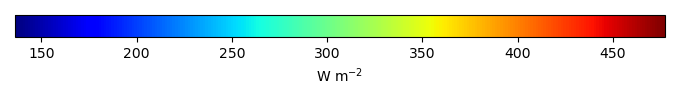
Period Mean (original grids) [W m-2] |
Model Period Mean (intersection) [W m-2] |
Benchmark Period Mean (intersection) [W m-2] |
Model Period Mean (complement) [W m-2] |
Benchmark Period Mean (complement) [W m-2] |
Bias [W m-2] |
RMSE [W m-2] |
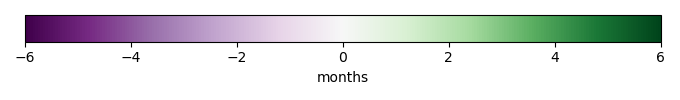
Phase Shift [months] |
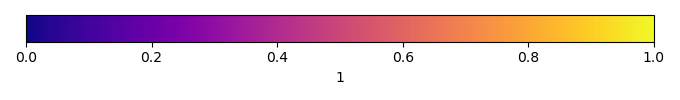
Bias Score [1] |
RMSE Score [1] |
Seasonal Cycle Score [1] |
Spatial Distribution Score [1] |
Overall Score [1] |
|||
|---|---|---|---|---|---|---|---|---|---|---|---|---|---|---|---|---|
| Benchmark | [-] | 299. | ||||||||||||||
| v3.LR.historical_0101 | [-] | 309. | 309. | 299. | 9.62 | 16.2 | 0.238 | 0.782 | 0.805 | 0.981 | 0.990 | 0.873 | ||||
| v3alt.LR.highECS001.historical | [-] | 316. | 316. | 299. | 16.6 | 23.1 | 0.413 | 0.676 | 0.744 | 0.958 | 0.999 | 0.824 | ||||
| v3alt.LR.highECS003.historical | [-] | 314. | 314. | 299. | 14.7 | 21.1 | 0.380 | 0.713 | 0.763 | 0.960 | 1.00 | 0.840 | ||||
| v3alt.LR.lowECS001.historical | [-] | 306. | 306. | 299. | 6.88 | 14.9 | 0.278 | 0.833 | 0.790 | 0.975 | 0.999 | 0.877 | ||||
| v3alt.LR.lowECS002.historical | [-] | 286. | 286. | 299. | -13.6 | 17.1 | 0.215 | 0.718 | 0.802 | 0.985 | 0.993 | 0.860 | ||||
| v3alt.LR.lowECS003.historical | [-] | 293. | 293. | 299. | -6.79 | 12.8 | 0.216 | 0.828 | 0.814 | 0.985 | 0.991 | 0.886 |
Download Data |
Period Mean (original grids) [W m-2] |
Model Period Mean (intersection) [W m-2] |
Benchmark Period Mean (intersection) [W m-2] |
Model Period Mean (complement) [W m-2] |
Benchmark Period Mean (complement) [W m-2] |
Bias [W m-2] |
RMSE [W m-2] |
Phase Shift [months] |
Bias Score [1] |
RMSE Score [1] |
Seasonal Cycle Score [1] |
Spatial Distribution Score [1] |
Overall Score [1] |
|||
|---|---|---|---|---|---|---|---|---|---|---|---|---|---|---|---|---|
| Benchmark | [-] | 450. | ||||||||||||||
| v3.LR.historical_0101 | [-] | 456. | 456. | 450. | 6.08 | 11.5 | 0.793 | 0.540 | 0.649 | 0.919 | 0.990 | 0.749 | ||||
| v3alt.LR.highECS001.historical | [-] | 455. | 454. | 450. | 4.73 | 11.1 | 0.852 | 0.540 | 0.649 | 0.913 | 0.985 | 0.747 | ||||
| v3alt.LR.highECS003.historical | [-] | 458. | 457. | 450. | 7.47 | 11.9 | 0.720 | 0.478 | 0.679 | 0.925 | 0.985 | 0.749 | ||||
| v3alt.LR.lowECS001.historical | [-] | 453. | 452. | 450. | 2.72 | 10.1 | 0.781 | 0.601 | 0.642 | 0.920 | 0.980 | 0.757 | ||||
| v3alt.LR.lowECS002.historical | [-] | 444. | 443. | 450. | -6.61 | 11.6 | 0.833 | 0.498 | 0.629 | 0.915 | 0.977 | 0.729 | ||||
| v3alt.LR.lowECS003.historical | [-] | 447. | 446. | 450. | -3.33 | 10.1 | 0.813 | 0.565 | 0.659 | 0.914 | 0.971 | 0.753 |
Download Data |
Period Mean (original grids) [W m-2] |
Model Period Mean (intersection) [W m-2] |
Benchmark Period Mean (intersection) [W m-2] |
Model Period Mean (complement) [W m-2] |
Benchmark Period Mean (complement) [W m-2] |
Bias [W m-2] |
RMSE [W m-2] |
Phase Shift [months] |
Bias Score [1] |
RMSE Score [1] |
Seasonal Cycle Score [1] |
Spatial Distribution Score [1] |
Overall Score [1] |
|||
|---|---|---|---|---|---|---|---|---|---|---|---|---|---|---|---|---|
| Benchmark | [-] | 393. | ||||||||||||||
| v3.LR.historical_0101 | [-] | 398. | 398. | 393. | 4.89 | 12.7 | 0.317 | 0.755 | 0.779 | 0.978 | 1.00 | 0.858 | ||||
| v3alt.LR.highECS001.historical | [-] | 400. | 400. | 393. | 6.37 | 14.5 | 0.691 | 0.721 | 0.777 | 0.951 | 0.997 | 0.845 | ||||
| v3alt.LR.highECS003.historical | [-] | 403. | 403. | 393. | 9.22 | 14.9 | 0.364 | 0.689 | 0.793 | 0.973 | 0.998 | 0.849 | ||||
| v3alt.LR.lowECS001.historical | [-] | 397. | 397. | 393. | 3.24 | 12.3 | 0.312 | 0.759 | 0.787 | 0.978 | 1.00 | 0.862 | ||||
| v3alt.LR.lowECS002.historical | [-] | 383. | 383. | 393. | -10.8 | 14.6 | 0.208 | 0.713 | 0.791 | 0.985 | 0.997 | 0.855 | ||||
| v3alt.LR.lowECS003.historical | [-] | 388. | 388. | 393. | -5.71 | 11.7 | 0.394 | 0.804 | 0.798 | 0.973 | 0.998 | 0.874 |
Download Data |
Period Mean (original grids) [W m-2] |
Model Period Mean (intersection) [W m-2] |
Benchmark Period Mean (intersection) [W m-2] |
Model Period Mean (complement) [W m-2] |
Benchmark Period Mean (complement) [W m-2] |
Bias [W m-2] |
RMSE [W m-2] |
Phase Shift [months] |
Bias Score [1] |
RMSE Score [1] |
Seasonal Cycle Score [1] |
Spatial Distribution Score [1] |
Overall Score [1] |
|||
|---|---|---|---|---|---|---|---|---|---|---|---|---|---|---|---|---|
| Benchmark | [-] | 377. | ||||||||||||||
| v3.LR.historical_0101 | [-] | 394. | 381. | 377. | 3.53 | 12.9 | 0.503 | 0.713 | 0.750 | 0.950 | 1.00 | 0.832 | ||||
| v3alt.LR.highECS001.historical | [-] | 394. | 381. | 377. | 4.35 | 14.3 | 0.586 | 0.694 | 0.744 | 0.940 | 0.999 | 0.824 | ||||
| v3alt.LR.highECS003.historical | [-] | 398. | 384. | 377. | 6.96 | 14.6 | 0.531 | 0.675 | 0.750 | 0.945 | 0.999 | 0.824 | ||||
| v3alt.LR.lowECS001.historical | [-] | 392. | 378. | 377. | 1.36 | 12.8 | 0.513 | 0.724 | 0.745 | 0.946 | 1.00 | 0.832 | ||||
| v3alt.LR.lowECS002.historical | [-] | 380. | 365. | 377. | -12.1 | 16.5 | 0.503 | 0.651 | 0.745 | 0.946 | 0.998 | 0.817 | ||||
| v3alt.LR.lowECS003.historical | [-] | 384. | 369. | 377. | -7.86 | 14.1 | 0.519 | 0.704 | 0.751 | 0.947 | 0.999 | 0.830 |
Download Data |
Period Mean (original grids) [W m-2] |
Model Period Mean (intersection) [W m-2] |
Benchmark Period Mean (intersection) [W m-2] |
Model Period Mean (complement) [W m-2] |
Benchmark Period Mean (complement) [W m-2] |
Bias [W m-2] |
RMSE [W m-2] |
Phase Shift [months] |
Bias Score [1] |
RMSE Score [1] |
Seasonal Cycle Score [1] |
Spatial Distribution Score [1] |
Overall Score [1] |
|||
|---|---|---|---|---|---|---|---|---|---|---|---|---|---|---|---|---|
| Benchmark | [-] | 376. | ||||||||||||||
| v3.LR.historical_0101 | [-] | 382. | 381. | 376. | 4.57 | 13.0 | 0.339 | 0.801 | 0.810 | 0.977 | 0.998 | 0.879 | ||||
| v3alt.LR.highECS001.historical | [-] | 384. | 383. | 376. | 6.64 | 15.3 | 0.767 | 0.760 | 0.809 | 0.947 | 0.994 | 0.864 | ||||
| v3alt.LR.highECS003.historical | [-] | 387. | 386. | 376. | 9.67 | 15.6 | 0.377 | 0.740 | 0.823 | 0.974 | 0.996 | 0.871 | ||||
| v3alt.LR.lowECS001.historical | [-] | 381. | 379. | 376. | 2.91 | 12.7 | 0.257 | 0.803 | 0.818 | 0.982 | 0.999 | 0.884 | ||||
| v3alt.LR.lowECS002.historical | [-] | 366. | 364. | 376. | -12.2 | 15.6 | 0.189 | 0.750 | 0.812 | 0.987 | 0.999 | 0.872 | ||||
| v3alt.LR.lowECS003.historical | [-] | 371. | 370. | 376. | -6.60 | 12.5 | 0.390 | 0.826 | 0.819 | 0.974 | 0.999 | 0.888 |
Temporally integrated period mean