Mean State
Download Data |
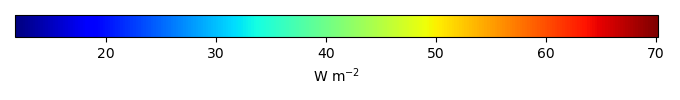
Period Mean (original grids) [W m-2] |
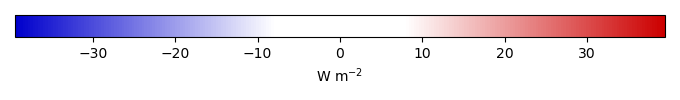
Bias [W m-2] |
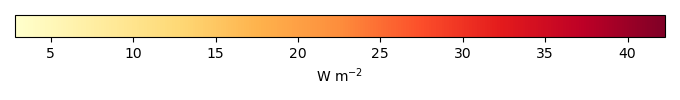
RMSE [W m-2] |
Phase Shift [months] |
Bias Score [1] |
RMSE Score [1] |
Seasonal Cycle Score [1] |
Overall Score [1] |
|||
|---|---|---|---|---|---|---|---|---|---|---|---|
| Benchmark | [-] | 22.0 | |||||||||
| v3.LR.historical_0101 | [-] | 17.7 | -4.26 | 13.4 | 1.31 | 0.634 | 0.468 | 0.819 | 0.598 | ||
| v3alt.LR.highECS001.historical | [-] | 17.6 | -4.41 | 13.2 | 1.31 | 0.635 | 0.477 | 0.819 | 0.602 | ||
| v3alt.LR.highECS003.historical | [-] | 17.5 | -4.48 | 13.1 | 1.31 | 0.634 | 0.485 | 0.819 | 0.606 | ||
| v3alt.LR.lowECS001.historical | [-] | 18.4 | -3.54 | 13.5 | 1.38 | 0.628 | 0.467 | 0.815 | 0.594 | ||
| v3alt.LR.lowECS002.historical | [-] | 20.7 | -1.24 | 12.9 | 1.38 | 0.617 | 0.432 | 0.815 | 0.574 | ||
| v3alt.LR.lowECS003.historical | [-] | 19.7 | -2.24 | 12.7 | 1.38 | 0.627 | 0.447 | 0.815 | 0.584 |
Download Data |
Period Mean (original grids) [W m-2] |
Bias [W m-2] |
RMSE [W m-2] |
Phase Shift [months] |
Bias Score [1] |
RMSE Score [1] |
Seasonal Cycle Score [1] |
Overall Score [1] |
|||
|---|---|---|---|---|---|---|---|---|---|---|---|
| Benchmark | [-] | 34.1 | |||||||||
| v3.LR.historical_0101 | [-] | 31.7 | -2.38 | 15.1 | 1.66 | 0.559 | 0.439 | 0.754 | 0.548 | ||
| v3alt.LR.highECS001.historical | [-] | 30.1 | -3.96 | 15.2 | 1.66 | 0.546 | 0.435 | 0.755 | 0.543 | ||
| v3alt.LR.highECS003.historical | [-] | 30.5 | -3.63 | 14.7 | 1.52 | 0.550 | 0.453 | 0.771 | 0.557 | ||
| v3alt.LR.lowECS001.historical | [-] | 31.3 | -2.80 | 16.4 | 1.79 | 0.552 | 0.395 | 0.715 | 0.514 | ||
| v3alt.LR.lowECS002.historical | [-] | 36.1 | 1.96 | 21.3 | 2.27 | 0.525 | 0.308 | 0.638 | 0.445 | ||
| v3alt.LR.lowECS003.historical | [-] | 34.6 | 0.562 | 19.5 | 2.24 | 0.551 | 0.352 | 0.643 | 0.475 |
Download Data |
Period Mean (original grids) [W m-2] |
Bias [W m-2] |
RMSE [W m-2] |
Phase Shift [months] |
Bias Score [1] |
RMSE Score [1] |
Seasonal Cycle Score [1] |
Overall Score [1] |
|||
|---|---|---|---|---|---|---|---|---|---|---|---|
| Benchmark | [-] | 29.1 | |||||||||
| v3.LR.historical_0101 | [-] | 26.8 | -2.29 | 13.3 | 1.18 | 0.555 | 0.466 | 0.838 | 0.581 | ||
| v3alt.LR.highECS001.historical | [-] | 26.2 | -2.97 | 13.4 | 1.17 | 0.548 | 0.461 | 0.840 | 0.578 | ||
| v3alt.LR.highECS003.historical | [-] | 26.1 | -3.03 | 13.3 | 1.19 | 0.548 | 0.474 | 0.838 | 0.583 | ||
| v3alt.LR.lowECS001.historical | [-] | 26.1 | -3.02 | 13.7 | 1.24 | 0.547 | 0.455 | 0.824 | 0.570 | ||
| v3alt.LR.lowECS002.historical | [-] | 29.6 | 0.428 | 16.0 | 1.61 | 0.543 | 0.390 | 0.759 | 0.521 | ||
| v3alt.LR.lowECS003.historical | [-] | 28.4 | -0.784 | 15.2 | 1.51 | 0.548 | 0.416 | 0.780 | 0.540 |
Download Data |
Period Mean (original grids) [W m-2] |
Bias [W m-2] |
RMSE [W m-2] |
Phase Shift [months] |
Bias Score [1] |
RMSE Score [1] |
Seasonal Cycle Score [1] |
Overall Score [1] |
|||
|---|---|---|---|---|---|---|---|---|---|---|---|
| Benchmark | [-] | 34.1 | |||||||||
| v3.LR.historical_0101 | [-] | 31.7 | -2.38 | 15.1 | 1.66 | 0.559 | 0.439 | 0.754 | 0.548 | ||
| v3alt.LR.highECS001.historical | [-] | 30.1 | -3.96 | 15.2 | 1.66 | 0.546 | 0.435 | 0.755 | 0.543 | ||
| v3alt.LR.highECS003.historical | [-] | 30.5 | -3.63 | 14.7 | 1.52 | 0.550 | 0.453 | 0.771 | 0.557 | ||
| v3alt.LR.lowECS001.historical | [-] | 31.3 | -2.80 | 16.4 | 1.79 | 0.552 | 0.395 | 0.715 | 0.514 | ||
| v3alt.LR.lowECS002.historical | [-] | 36.1 | 1.96 | 21.3 | 2.27 | 0.525 | 0.308 | 0.638 | 0.445 | ||
| v3alt.LR.lowECS003.historical | [-] | 34.6 | 0.562 | 19.5 | 2.24 | 0.551 | 0.352 | 0.643 | 0.475 |
Temporally integrated period mean