Mean State
Download Data |
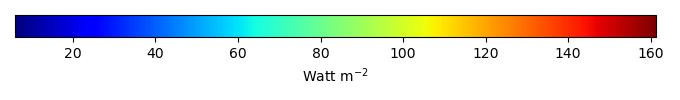
Period Mean (original grids) [Watt m-2] |
Model Period Mean (intersection) [Watt m-2] |
Benchmark Period Mean (intersection) [Watt m-2] |
Model Period Mean (complement) [Watt m-2] |
Benchmark Period Mean (complement) [Watt m-2] |
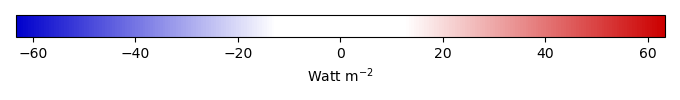
Bias [Watt m-2] |
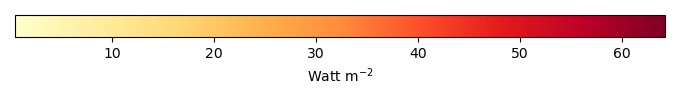
RMSE [Watt m-2] |
Phase Shift [months] |
Bias Score [1] |
RMSE Score [1] |
Seasonal Cycle Score [1] |
Spatial Distribution Score [1] |
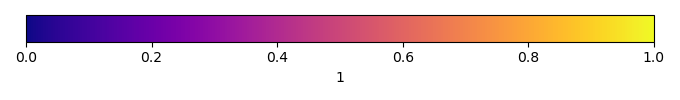
Overall Score [1] |
|||
|---|---|---|---|---|---|---|---|---|---|---|---|---|---|---|---|---|
| Benchmark | [-] | 31.9 | ||||||||||||||
| v3.LR.historical_0101 | [-] | 29.4 | 29.4 | 31.9 | -2.49 | 16.0 | 0.527 | 0.788 | 0.631 | 0.959 | 0.920 | 0.786 | ||||
| v3alt.LR.highECS001.historical | [-] | 28.6 | 28.6 | 31.9 | -3.32 | 16.6 | 0.547 | 0.796 | 0.635 | 0.957 | 0.893 | 0.783 | ||||
| v3alt.LR.highECS003.historical | [-] | 28.1 | 28.1 | 31.9 | -3.81 | 16.7 | 0.555 | 0.791 | 0.631 | 0.956 | 0.877 | 0.777 | ||||
| v3alt.LR.lowECS001.historical | [-] | 29.6 | 29.6 | 31.9 | -2.30 | 16.2 | 0.596 | 0.791 | 0.609 | 0.950 | 0.908 | 0.773 | ||||
| v3alt.LR.lowECS002.historical | [-] | 38.0 | 38.0 | 31.9 | 6.06 | 19.7 | 0.532 | 0.725 | 0.565 | 0.946 | 0.981 | 0.756 | ||||
| v3alt.LR.lowECS003.historical | [-] | 35.1 | 35.1 | 31.9 | 3.19 | 17.7 | 0.538 | 0.757 | 0.585 | 0.947 | 0.975 | 0.770 |
Download Data |
Period Mean (original grids) [Watt m-2] |
Model Period Mean (intersection) [Watt m-2] |
Benchmark Period Mean (intersection) [Watt m-2] |
Model Period Mean (complement) [Watt m-2] |
Benchmark Period Mean (complement) [Watt m-2] |
Bias [Watt m-2] |
RMSE [Watt m-2] |
Phase Shift [months] |
Bias Score [1] |
RMSE Score [1] |
Seasonal Cycle Score [1] |
Spatial Distribution Score [1] |
Overall Score [1] |
|||
|---|---|---|---|---|---|---|---|---|---|---|---|---|---|---|---|---|
| Benchmark | [-] | 18.6 | ||||||||||||||
| v3.LR.historical_0101 | [-] | 18.8 | 19.1 | 18.6 | 0.454 | 3.20 | 1.15 | 0.690 | 0.667 | 0.865 | 0.983 | 0.774 | ||||
| v3alt.LR.highECS001.historical | [-] | 18.5 | 18.7 | 18.6 | 0.0850 | 3.18 | 1.07 | 0.682 | 0.668 | 0.877 | 0.989 | 0.777 | ||||
| v3alt.LR.highECS003.historical | [-] | 18.5 | 18.8 | 18.6 | 0.125 | 3.24 | 1.15 | 0.685 | 0.656 | 0.864 | 0.988 | 0.770 | ||||
| v3alt.LR.lowECS001.historical | [-] | 17.7 | 17.9 | 18.6 | -0.700 | 3.39 | 1.02 | 0.664 | 0.630 | 0.884 | 0.994 | 0.760 | ||||
| v3alt.LR.lowECS002.historical | [-] | 18.0 | 18.3 | 18.6 | -0.341 | 3.37 | 1.01 | 0.665 | 0.639 | 0.886 | 0.990 | 0.764 | ||||
| v3alt.LR.lowECS003.historical | [-] | 17.9 | 18.1 | 18.6 | -0.533 | 3.35 | 1.07 | 0.677 | 0.634 | 0.879 | 0.994 | 0.763 |
Download Data |
Period Mean (original grids) [Watt m-2] |
Model Period Mean (intersection) [Watt m-2] |
Benchmark Period Mean (intersection) [Watt m-2] |
Model Period Mean (complement) [Watt m-2] |
Benchmark Period Mean (complement) [Watt m-2] |
Bias [Watt m-2] |
RMSE [Watt m-2] |
Phase Shift [months] |
Bias Score [1] |
RMSE Score [1] |
Seasonal Cycle Score [1] |
Spatial Distribution Score [1] |
Overall Score [1] |
|||
|---|---|---|---|---|---|---|---|---|---|---|---|---|---|---|---|---|
| Benchmark | [-] | 21.4 | ||||||||||||||
| v3.LR.historical_0101 | [-] | 26.0 | 26.0 | 21.4 | 4.59 | 7.24 | 1.13 | 0.632 | 0.630 | 0.846 | 0.869 | 0.722 | ||||
| v3alt.LR.highECS001.historical | [-] | 24.6 | 24.6 | 21.4 | 3.18 | 5.96 | 1.07 | 0.673 | 0.645 | 0.863 | 0.934 | 0.752 | ||||
| v3alt.LR.highECS003.historical | [-] | 25.2 | 25.2 | 21.4 | 3.73 | 6.06 | 1.07 | 0.649 | 0.666 | 0.857 | 0.914 | 0.751 | ||||
| v3alt.LR.lowECS001.historical | [-] | 25.8 | 25.8 | 21.4 | 4.40 | 7.45 | 1.26 | 0.633 | 0.596 | 0.825 | 0.869 | 0.704 | ||||
| v3alt.LR.lowECS002.historical | [-] | 28.7 | 28.7 | 21.4 | 7.24 | 11.0 | 1.45 | 0.573 | 0.540 | 0.792 | 0.722 | 0.634 | ||||
| v3alt.LR.lowECS003.historical | [-] | 27.5 | 27.5 | 21.4 | 6.02 | 9.46 | 1.38 | 0.609 | 0.562 | 0.804 | 0.777 | 0.663 |
Download Data |
Period Mean (original grids) [Watt m-2] |
Model Period Mean (intersection) [Watt m-2] |
Benchmark Period Mean (intersection) [Watt m-2] |
Model Period Mean (complement) [Watt m-2] |
Benchmark Period Mean (complement) [Watt m-2] |
Bias [Watt m-2] |
RMSE [Watt m-2] |
Phase Shift [months] |
Bias Score [1] |
RMSE Score [1] |
Seasonal Cycle Score [1] |
Spatial Distribution Score [1] |
Overall Score [1] |
|||
|---|---|---|---|---|---|---|---|---|---|---|---|---|---|---|---|---|
| Benchmark | [-] | 42.2 | ||||||||||||||
| v3.LR.historical_0101 | [-] | 42.1 | 43.9 | 42.2 | 1.68 | 12.8 | 0.977 | 0.602 | 0.628 | 0.874 | 0.893 | 0.725 | ||||
| v3alt.LR.highECS001.historical | [-] | 41.3 | 43.0 | 42.2 | 0.718 | 12.6 | 0.967 | 0.609 | 0.629 | 0.880 | 0.900 | 0.730 | ||||
| v3alt.LR.highECS003.historical | [-] | 41.3 | 43.0 | 42.2 | 0.733 | 12.5 | 0.959 | 0.605 | 0.633 | 0.880 | 0.896 | 0.729 | ||||
| v3alt.LR.lowECS001.historical | [-] | 40.9 | 42.7 | 42.2 | 0.494 | 13.3 | 1.01 | 0.596 | 0.607 | 0.869 | 0.903 | 0.717 | ||||
| v3alt.LR.lowECS002.historical | [-] | 42.2 | 45.3 | 42.2 | 3.09 | 15.2 | 1.02 | 0.559 | 0.584 | 0.863 | 0.882 | 0.694 | ||||
| v3alt.LR.lowECS003.historical | [-] | 41.6 | 44.4 | 42.2 | 2.20 | 14.4 | 1.03 | 0.572 | 0.589 | 0.862 | 0.887 | 0.700 |
Download Data |
Period Mean (original grids) [Watt m-2] |
Model Period Mean (intersection) [Watt m-2] |
Benchmark Period Mean (intersection) [Watt m-2] |
Model Period Mean (complement) [Watt m-2] |
Benchmark Period Mean (complement) [Watt m-2] |
Bias [Watt m-2] |
RMSE [Watt m-2] |
Phase Shift [months] |
Bias Score [1] |
RMSE Score [1] |
Seasonal Cycle Score [1] |
Spatial Distribution Score [1] |
Overall Score [1] |
|||
|---|---|---|---|---|---|---|---|---|---|---|---|---|---|---|---|---|
| Benchmark | [-] | 23.1 | ||||||||||||||
| v3.LR.historical_0101 | [-] | 28.9 | 29.1 | 23.1 | 6.05 | 8.93 | 1.15 | 0.575 | 0.618 | 0.831 | 0.847 | 0.698 | ||||
| v3alt.LR.highECS001.historical | [-] | 27.1 | 27.3 | 23.1 | 4.18 | 7.16 | 1.11 | 0.633 | 0.640 | 0.849 | 0.922 | 0.737 | ||||
| v3alt.LR.highECS003.historical | [-] | 27.8 | 27.9 | 23.1 | 4.87 | 7.26 | 1.08 | 0.603 | 0.669 | 0.845 | 0.899 | 0.737 | ||||
| v3alt.LR.lowECS001.historical | [-] | 28.9 | 29.1 | 23.1 | 6.00 | 9.25 | 1.31 | 0.578 | 0.585 | 0.807 | 0.842 | 0.680 | ||||
| v3alt.LR.lowECS002.historical | [-] | 32.7 | 33.0 | 23.1 | 9.92 | 14.3 | 1.63 | 0.492 | 0.494 | 0.750 | 0.688 | 0.584 | ||||
| v3alt.LR.lowECS003.historical | [-] | 31.1 | 31.3 | 23.1 | 8.26 | 12.1 | 1.50 | 0.532 | 0.532 | 0.773 | 0.741 | 0.622 |
Temporally integrated period mean