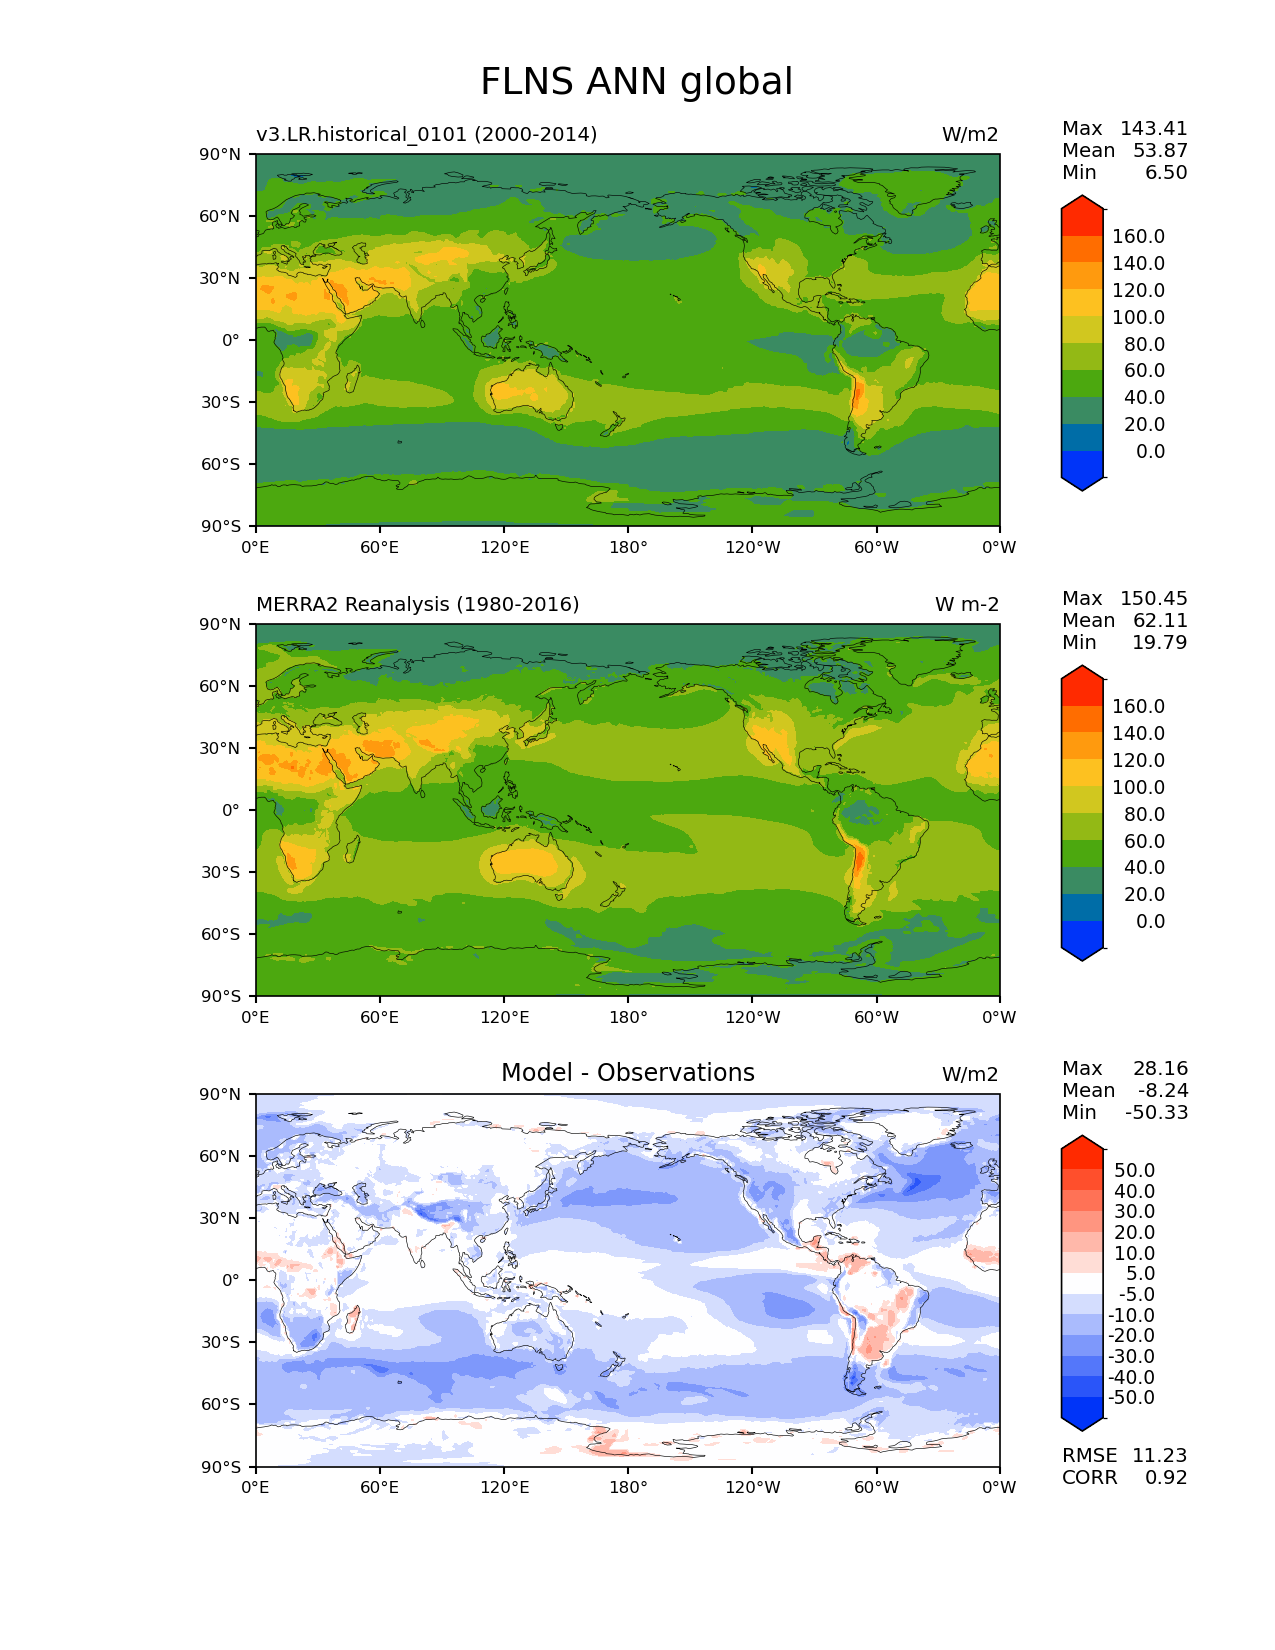
| Use this command to recreate this image: | e3sm_diags lat_lon --no_viewer --reference_data_path '/global/cfs/cdirs/e3sm/diagnostics/observations/Atm/climatology/' --test_data_path '/global/cfs/cdirs/e3sm/chengzhu/tutorial2024/v3.LR.historical_0101/post/atm/180x360_aave/clim/15yr' --results_dir '/global/cfs/cdirs/e3sm/www/chengzhu/tutorial2024/e3sm_diags_extended' --case_id 'MERRA2' --run_type 'model_vs_obs' --sets 'lat_lon' --variables 'FLNS' --seasons 'ANN' --regions 'global' --regrid_tool 'esmf' --regrid_method 'conservative' --multiprocessing --num_workers '24' --main_title 'FLNS ANN global' --backend 'mpl' --output_format 'png' --canvas_size_w '1212' --canvas_size_h '1628' --figsize '8.5' '11.0' --dpi '150' --arrows --contour_levels '0' '20' '40' '60' '80' '100' '120' '140' '160' --test_name 'extendedOutput.v3.LR.historical_0101' --short_test_name 'v3.LR.historical_0101' --test_colormap 'cet_rainbow.rgb' --ref_name 'MERRA2' --reference_name 'MERRA2 Reanalysis' --reference_colormap 'cet_rainbow.rgb' --diff_title 'Model - Observations' --diff_colormap 'diverging_bwr.rgb' --diff_levels '-50' '-40' '-30' '-20' '-10' '-5' '5' '10' '20' '30' '40' '50' --granulate 'variables' 'seasons' 'plevs' 'regions' --selectors 'sets' 'seasons' |