ACME Coupled Diagnostic Plots
ACME Coupled Priority Metrics
20180129.DECKv1b_piControl.ne30_oEC.edison
(Climatological years: 451-500) vs. obs (climo)
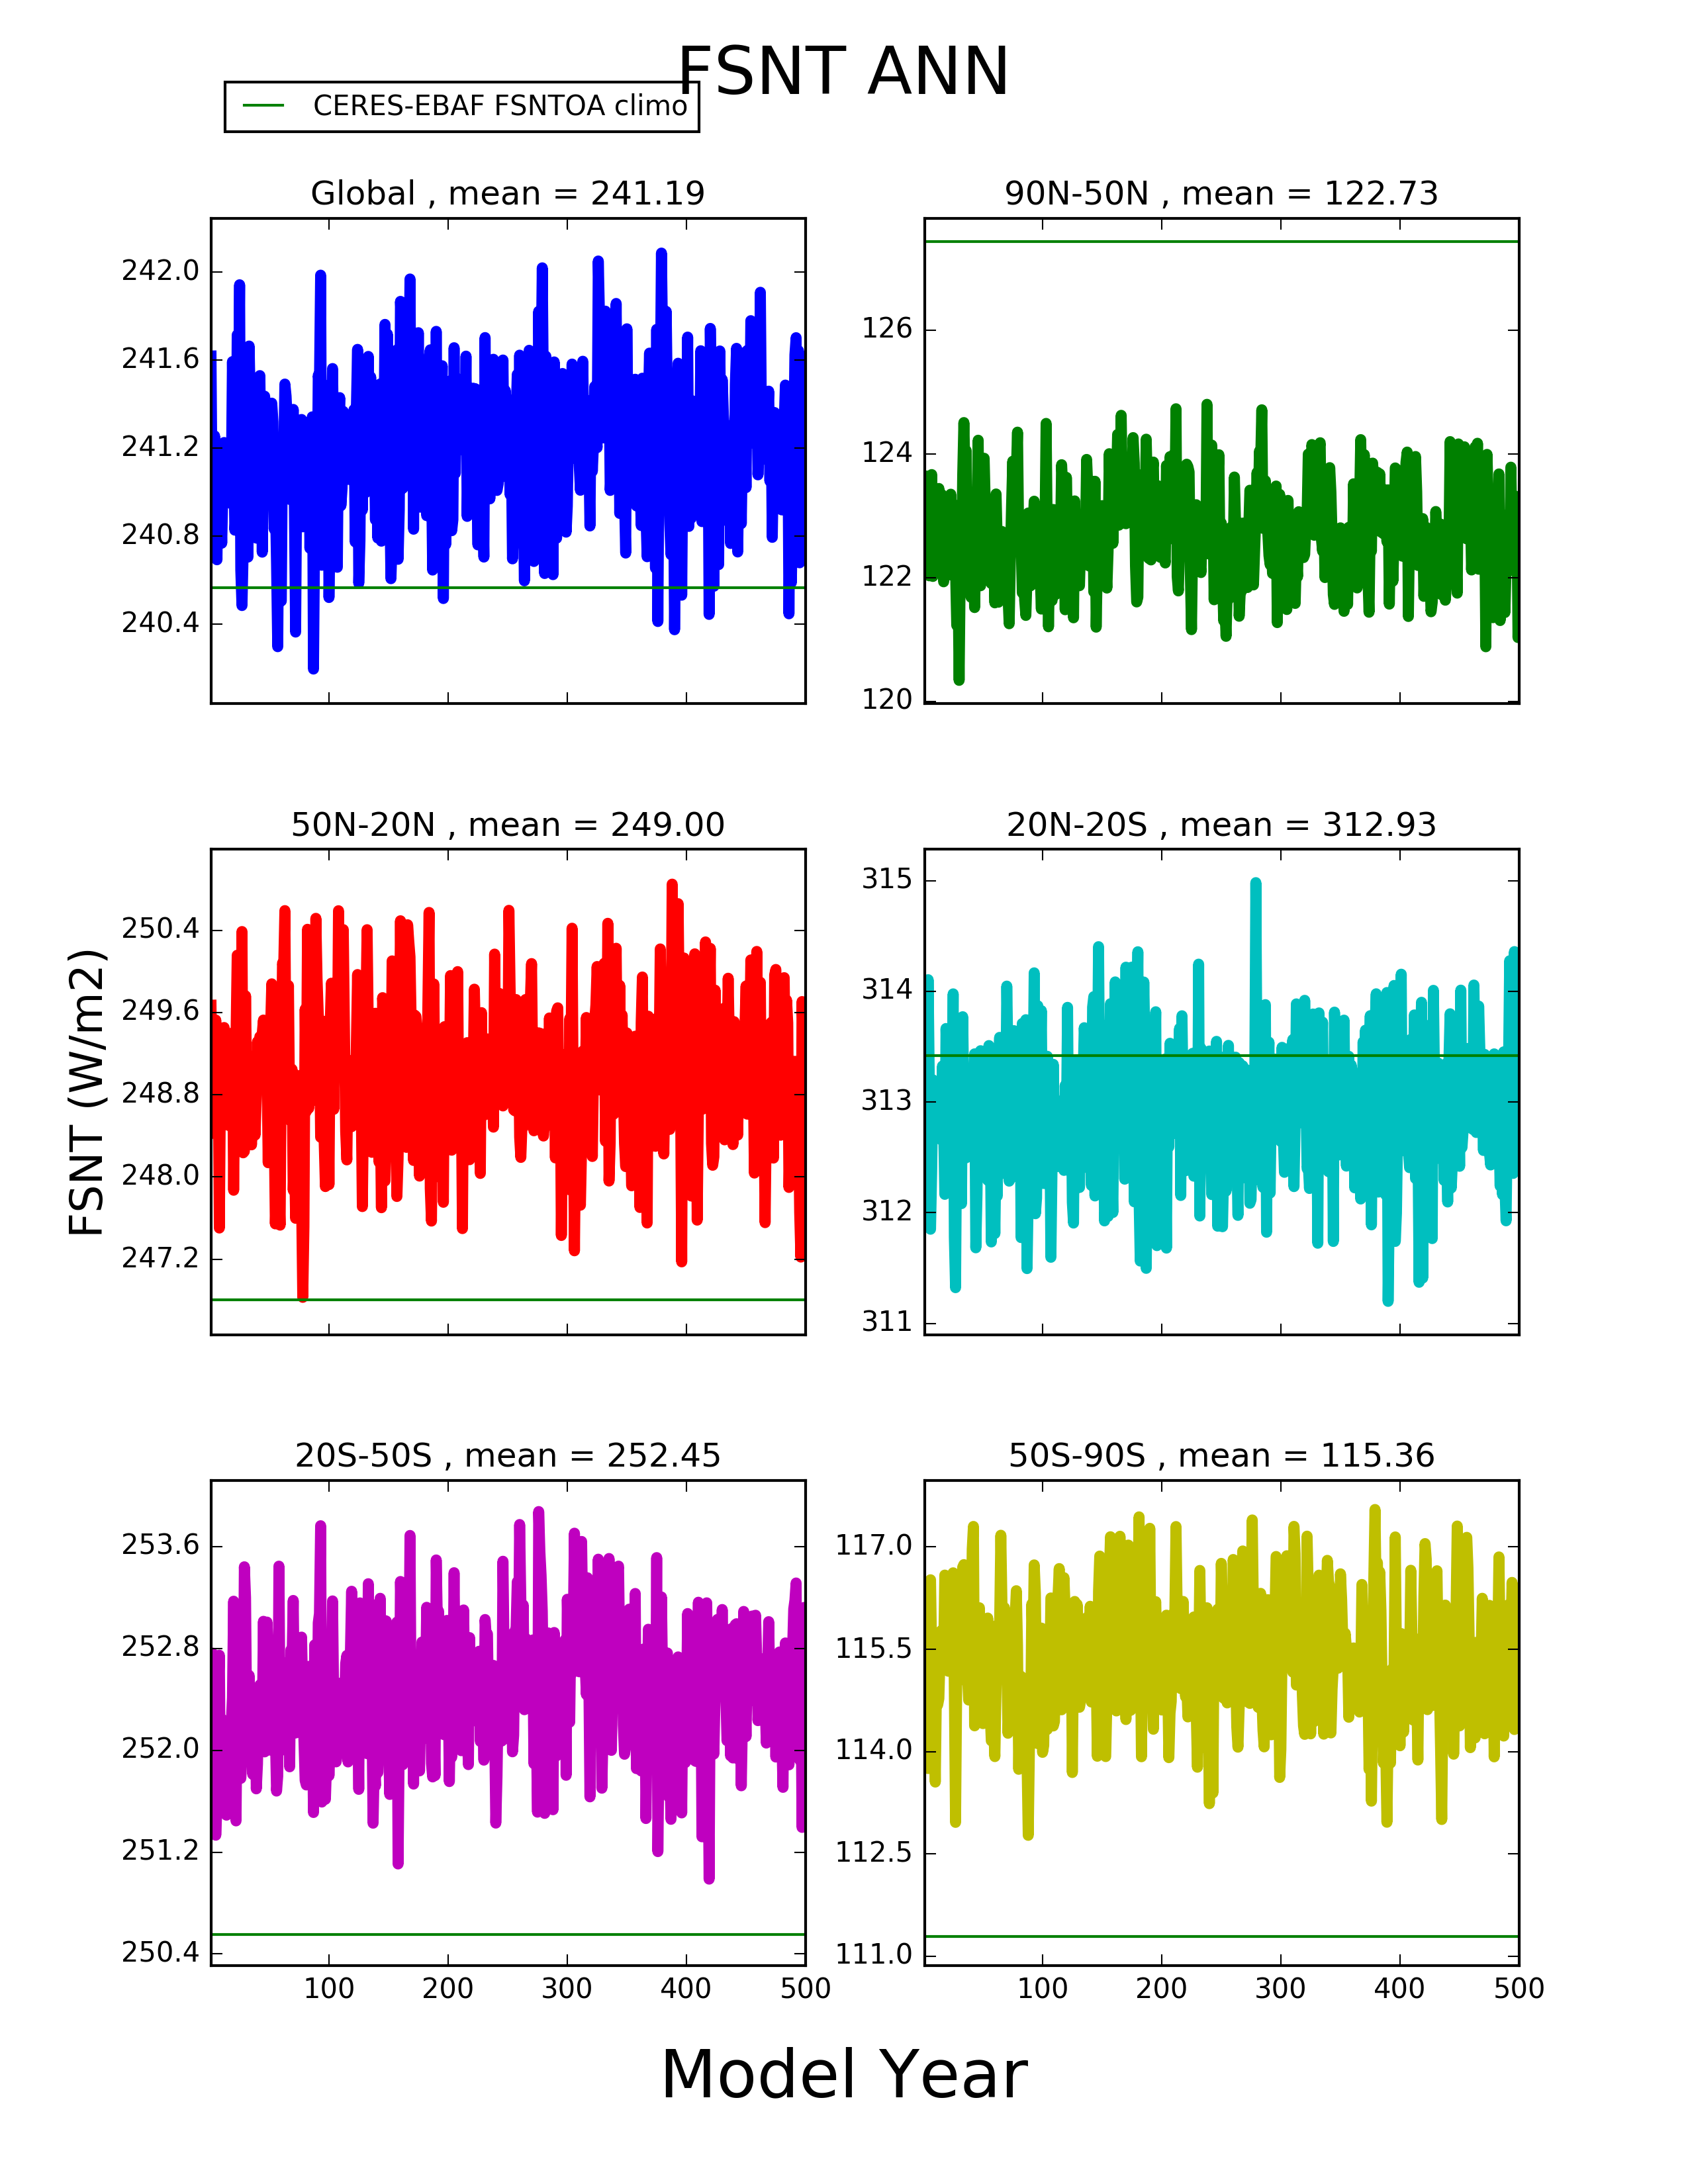
Time Series Plots: Global and Zonal-band means (ATM)
20180129.DECKv1b_piControl.ne30_oEC.edison (Years: 1-500)
obs (climo)
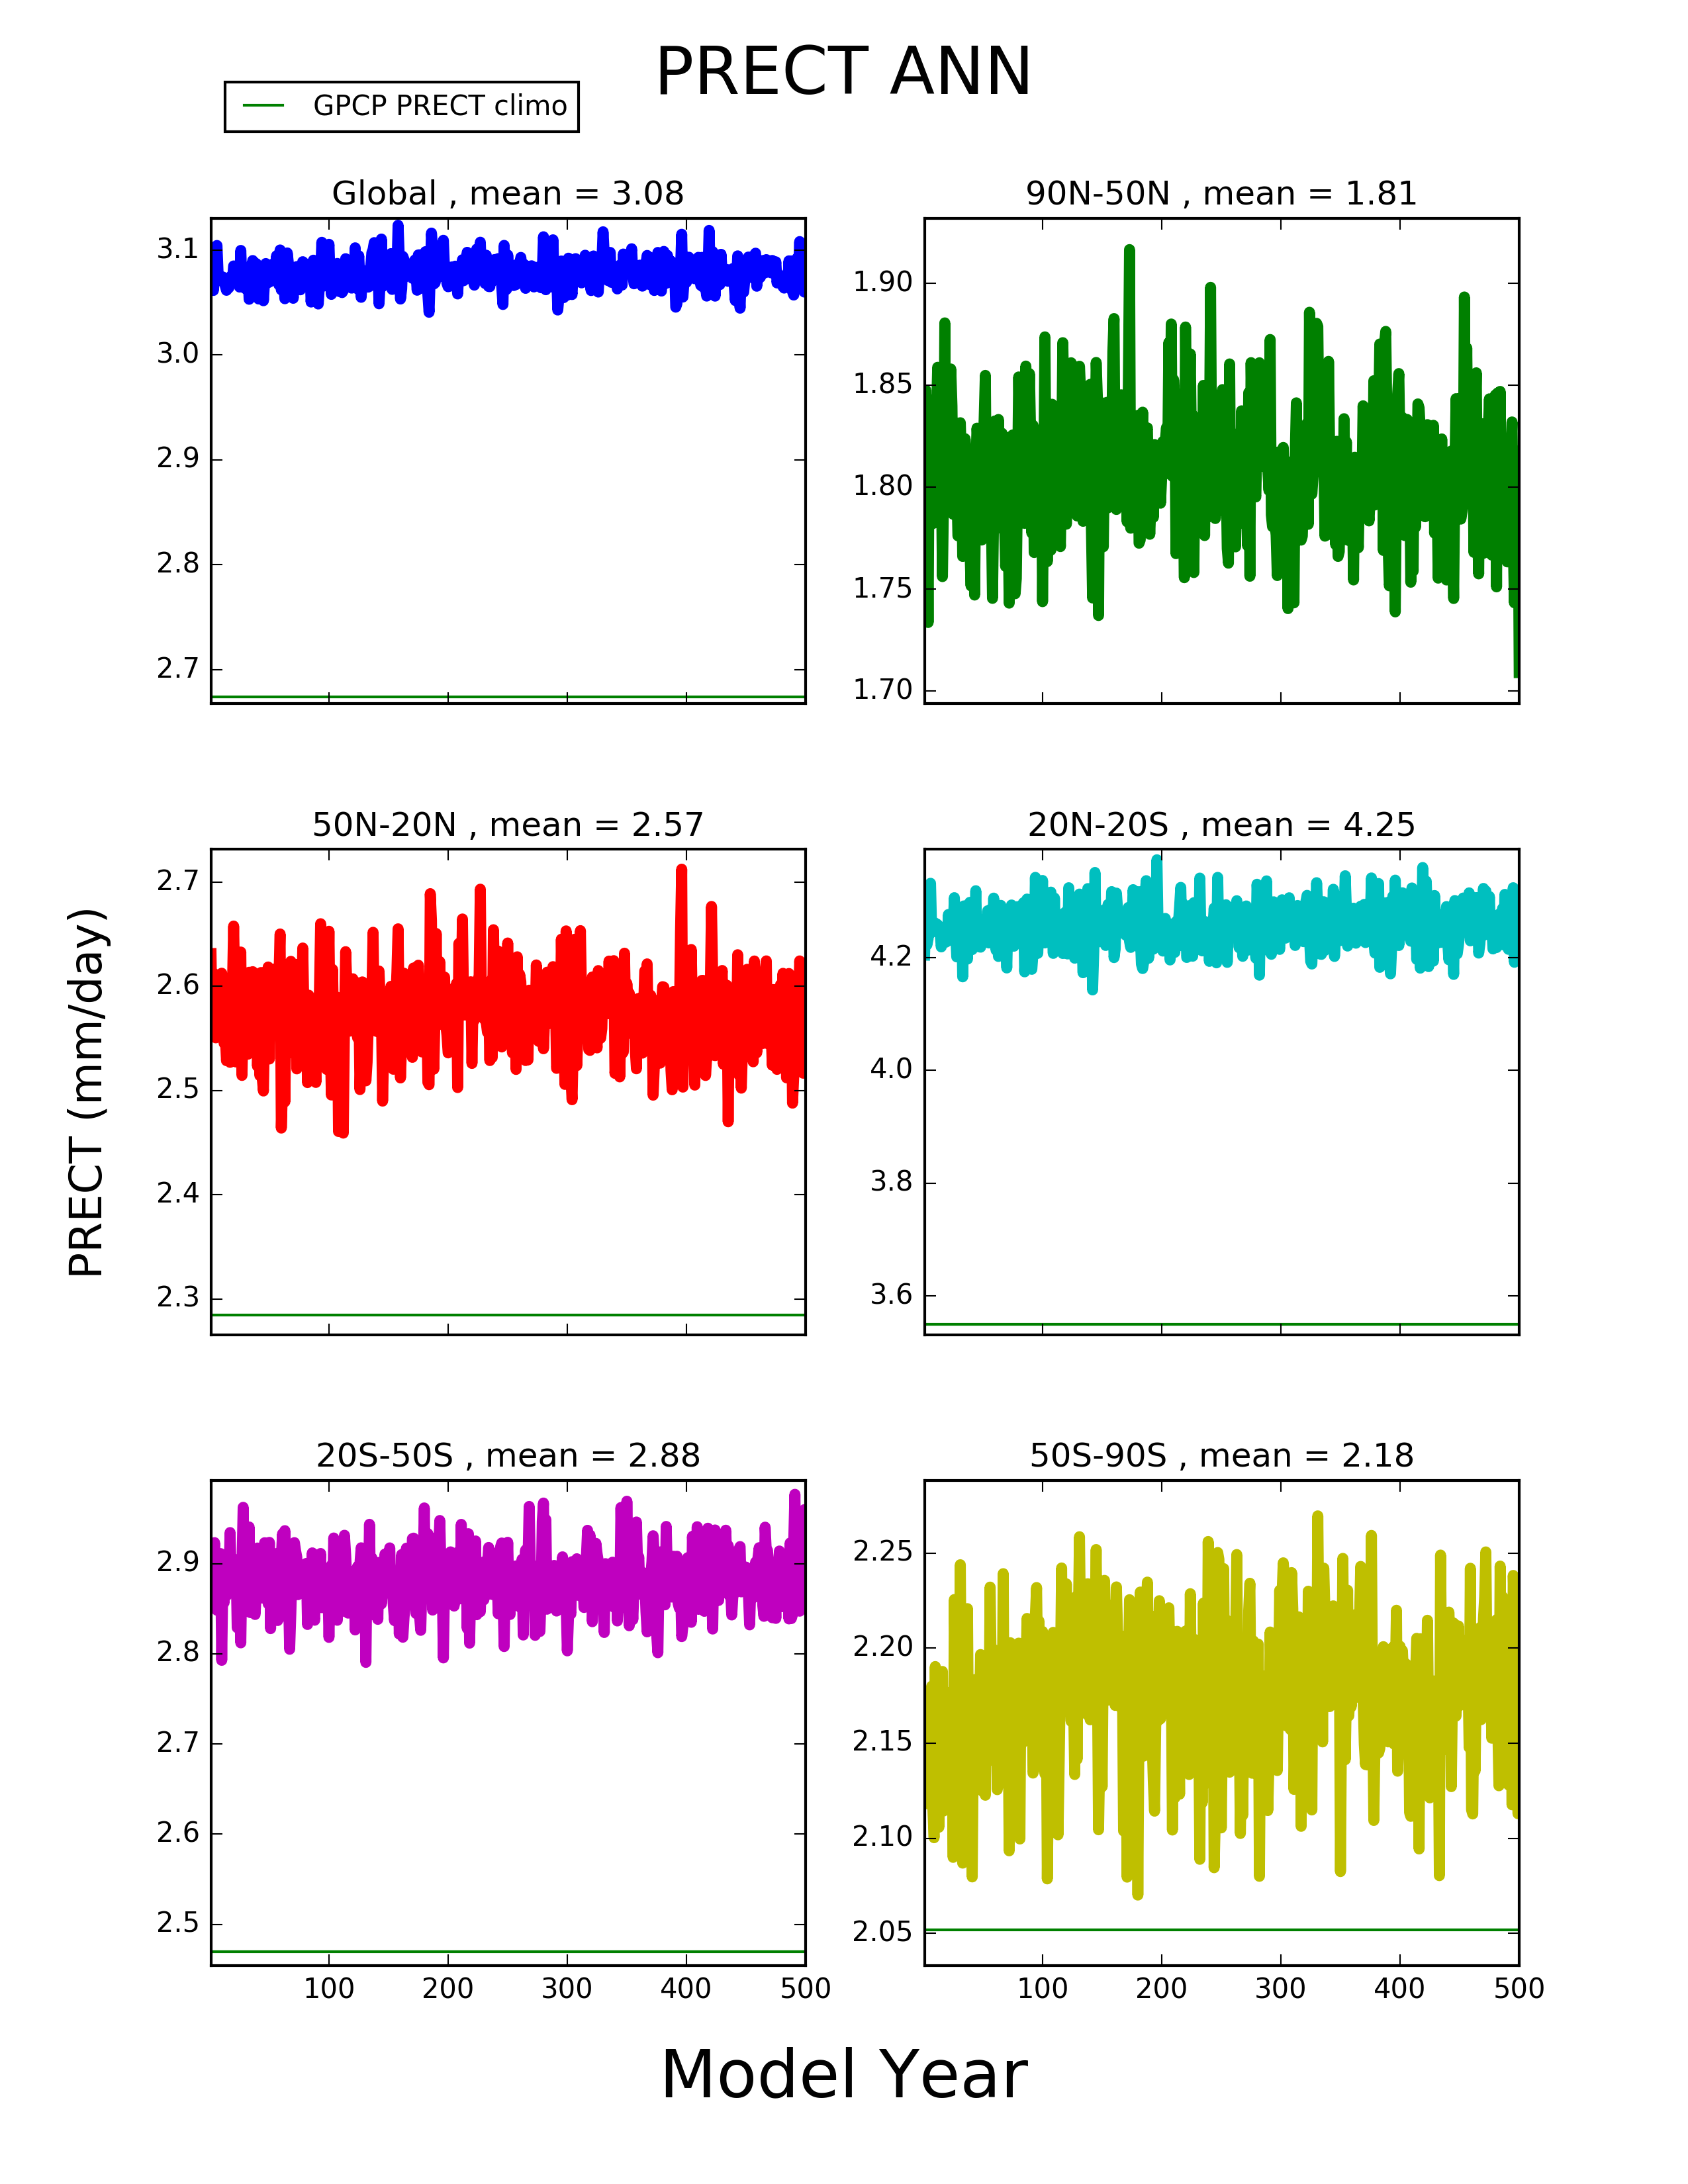
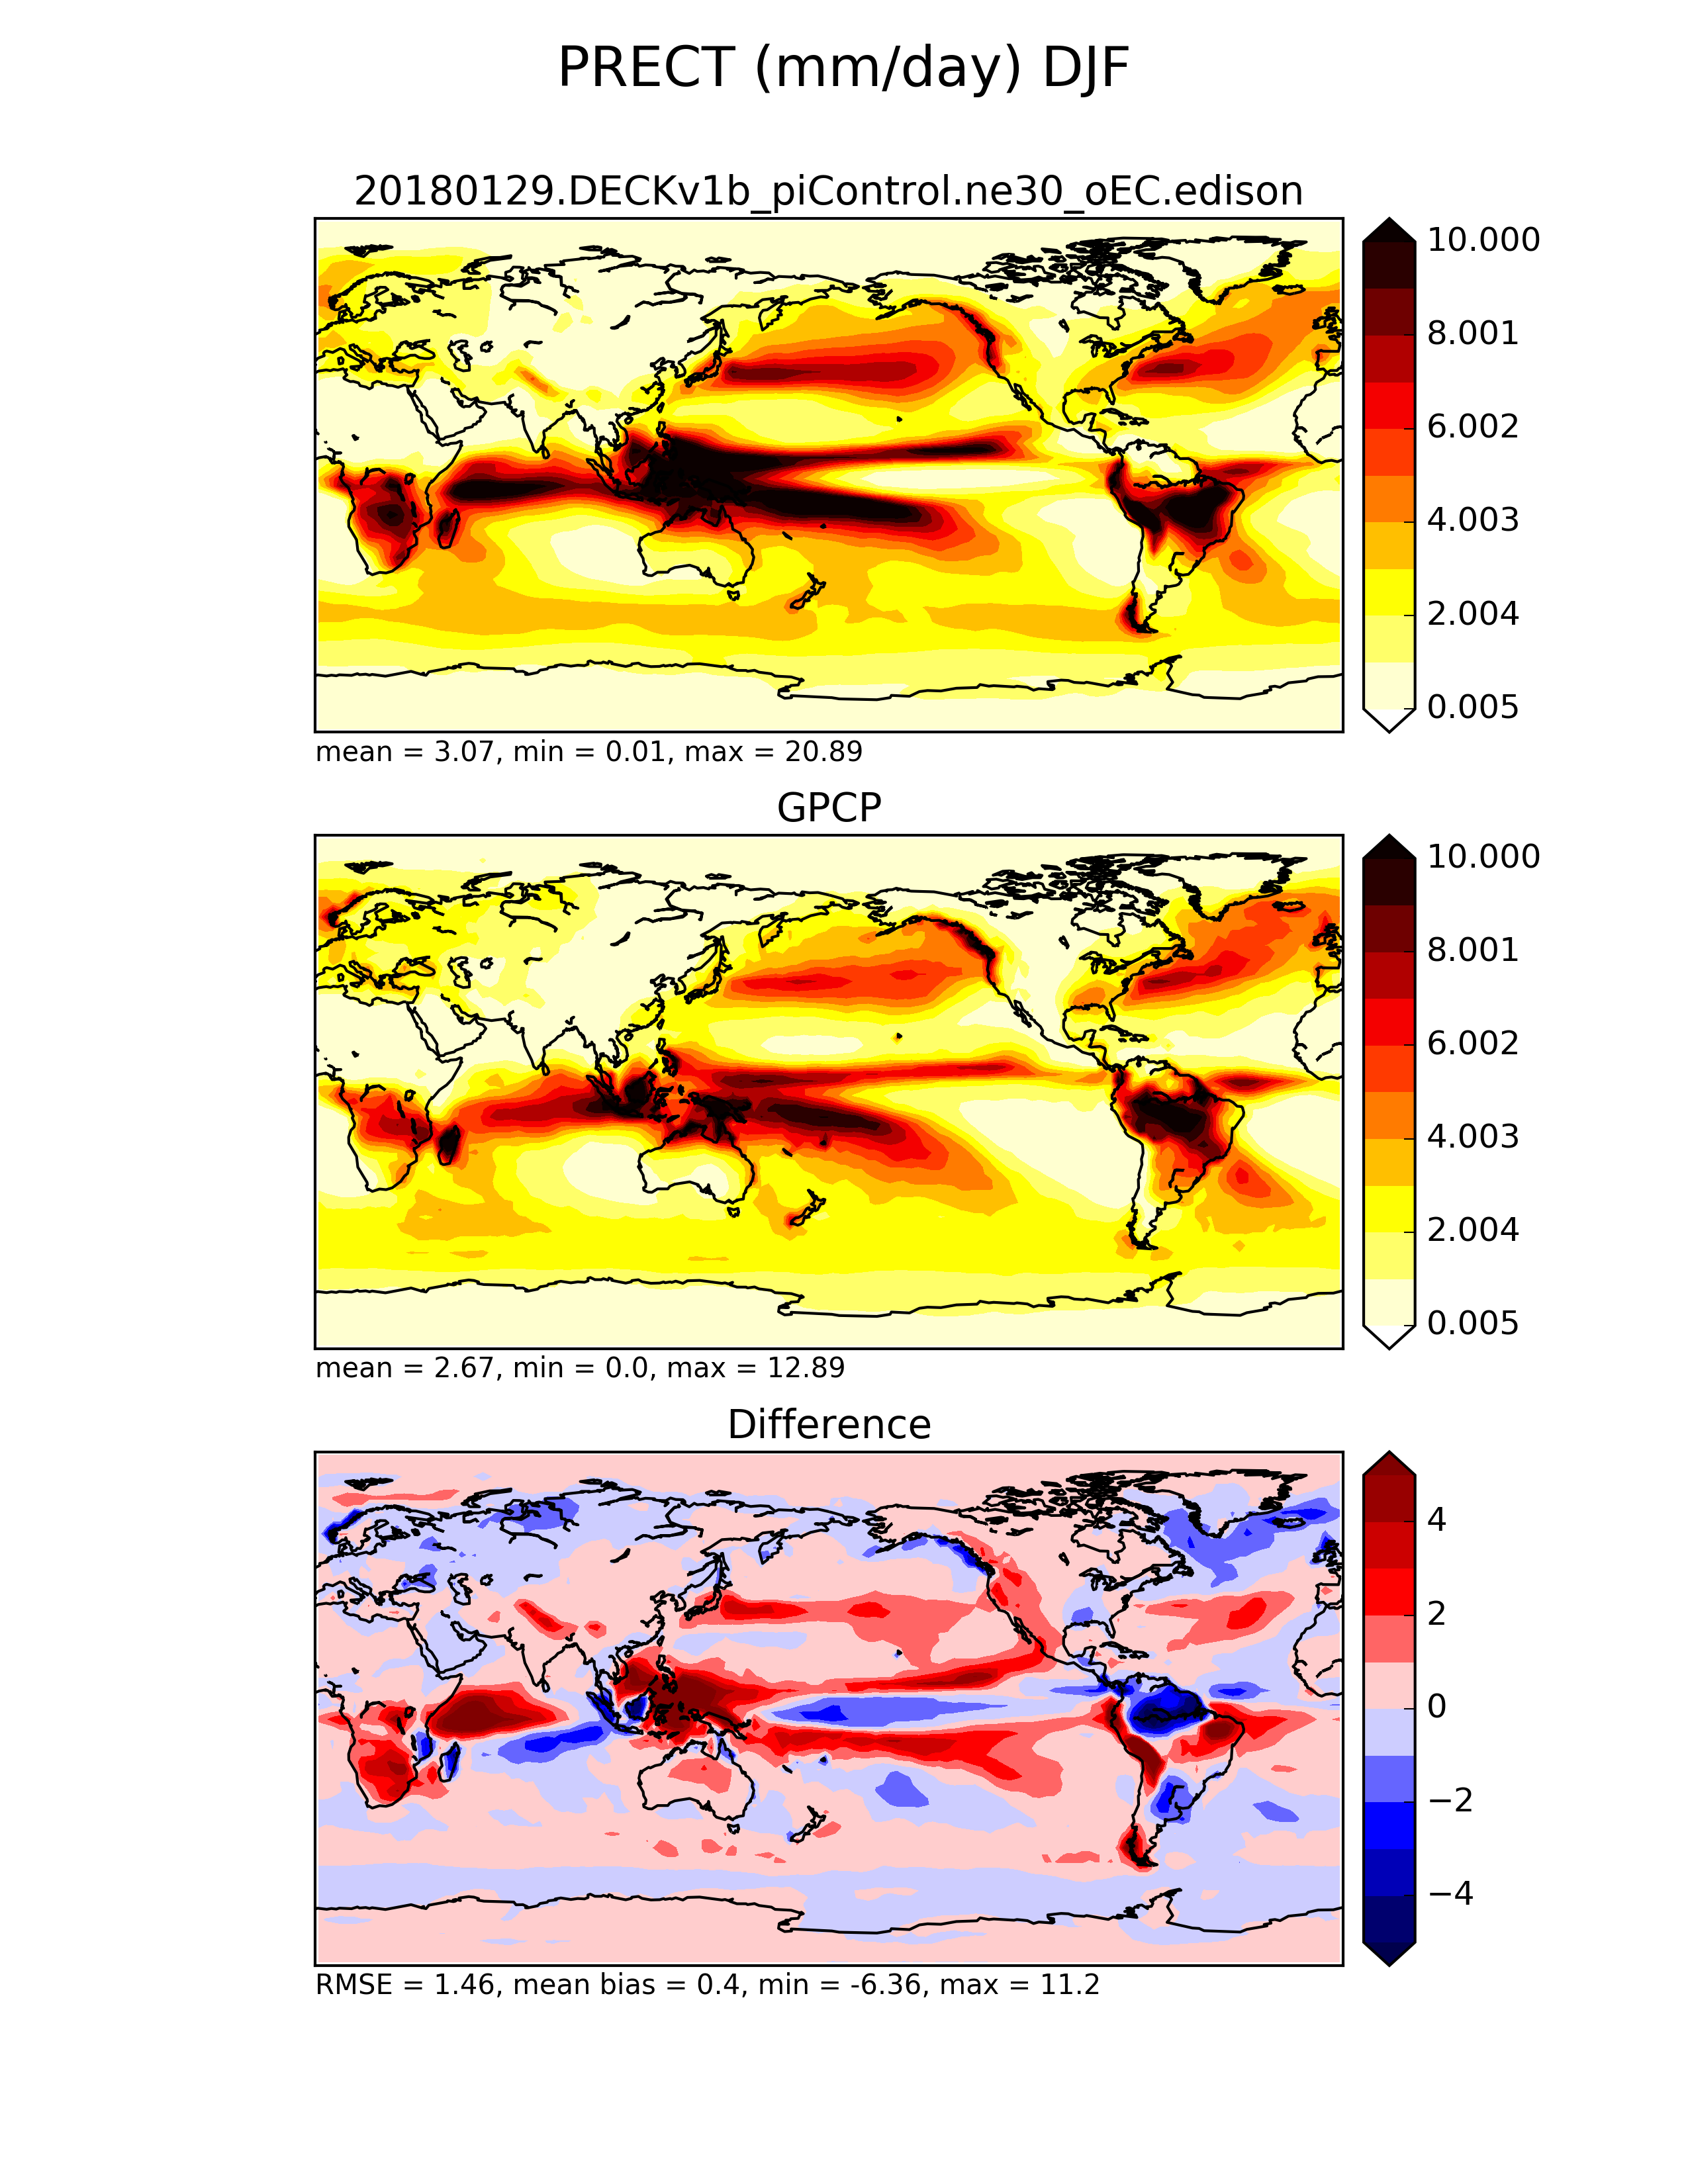
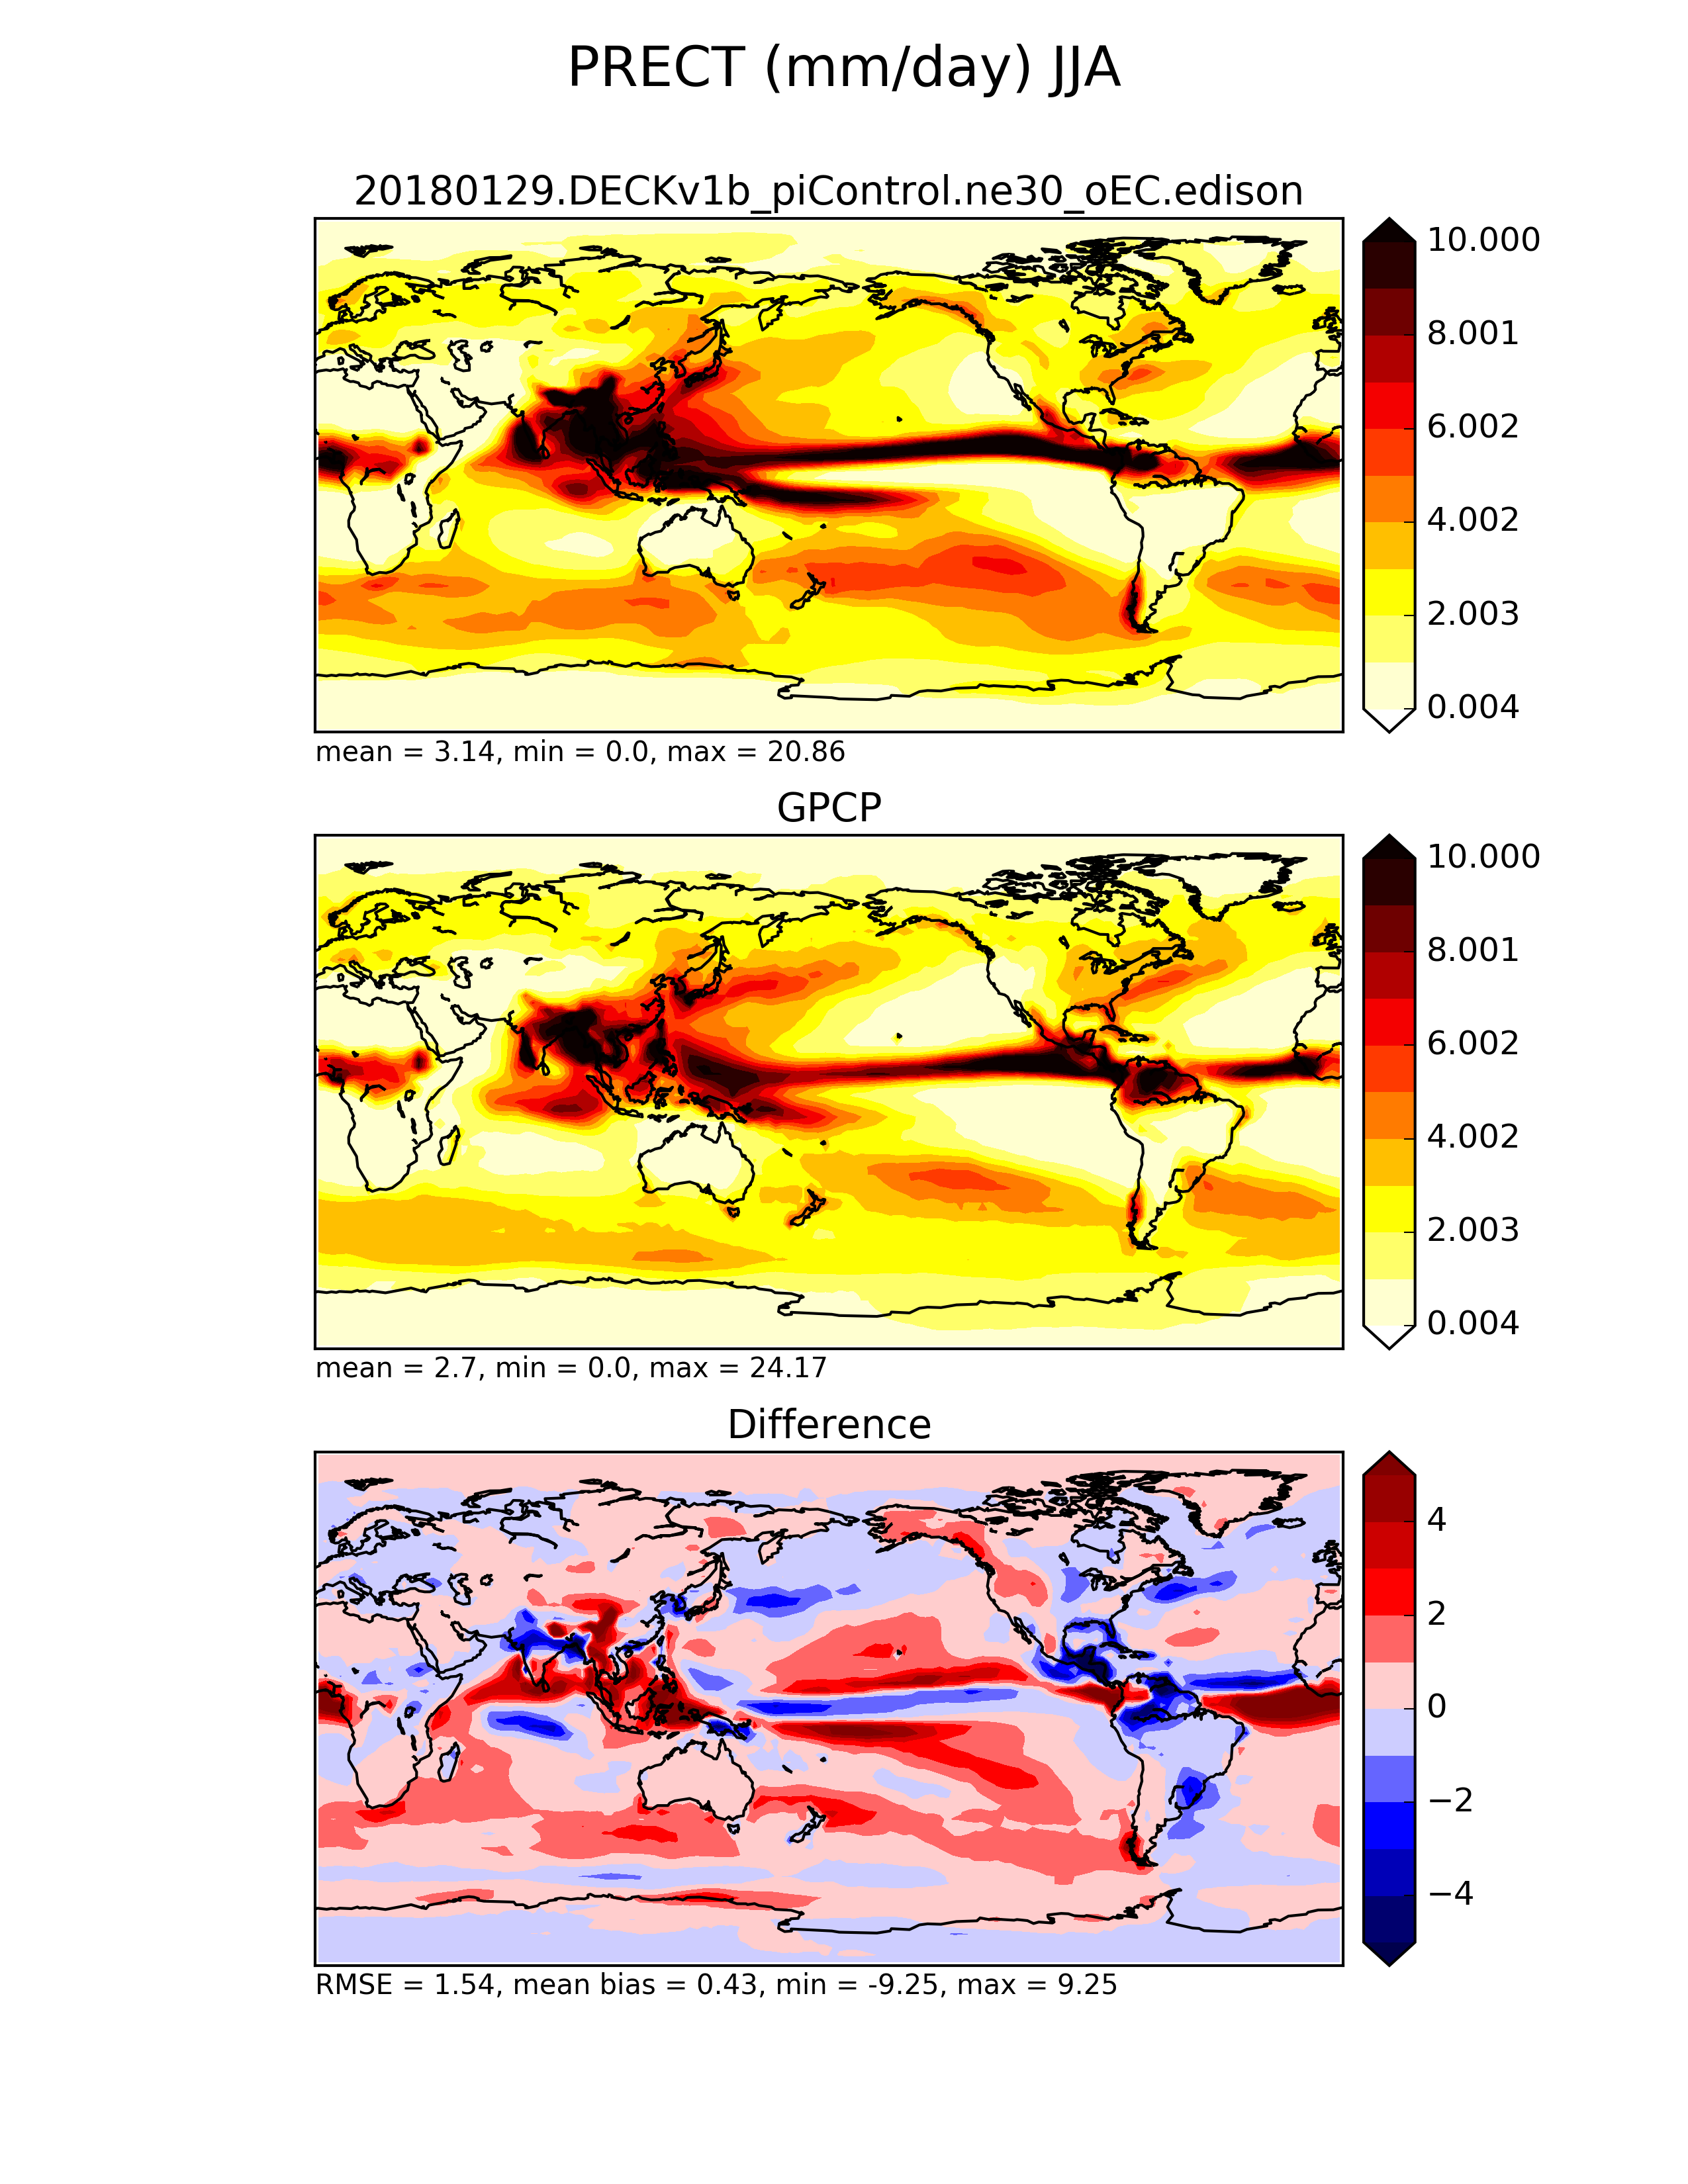
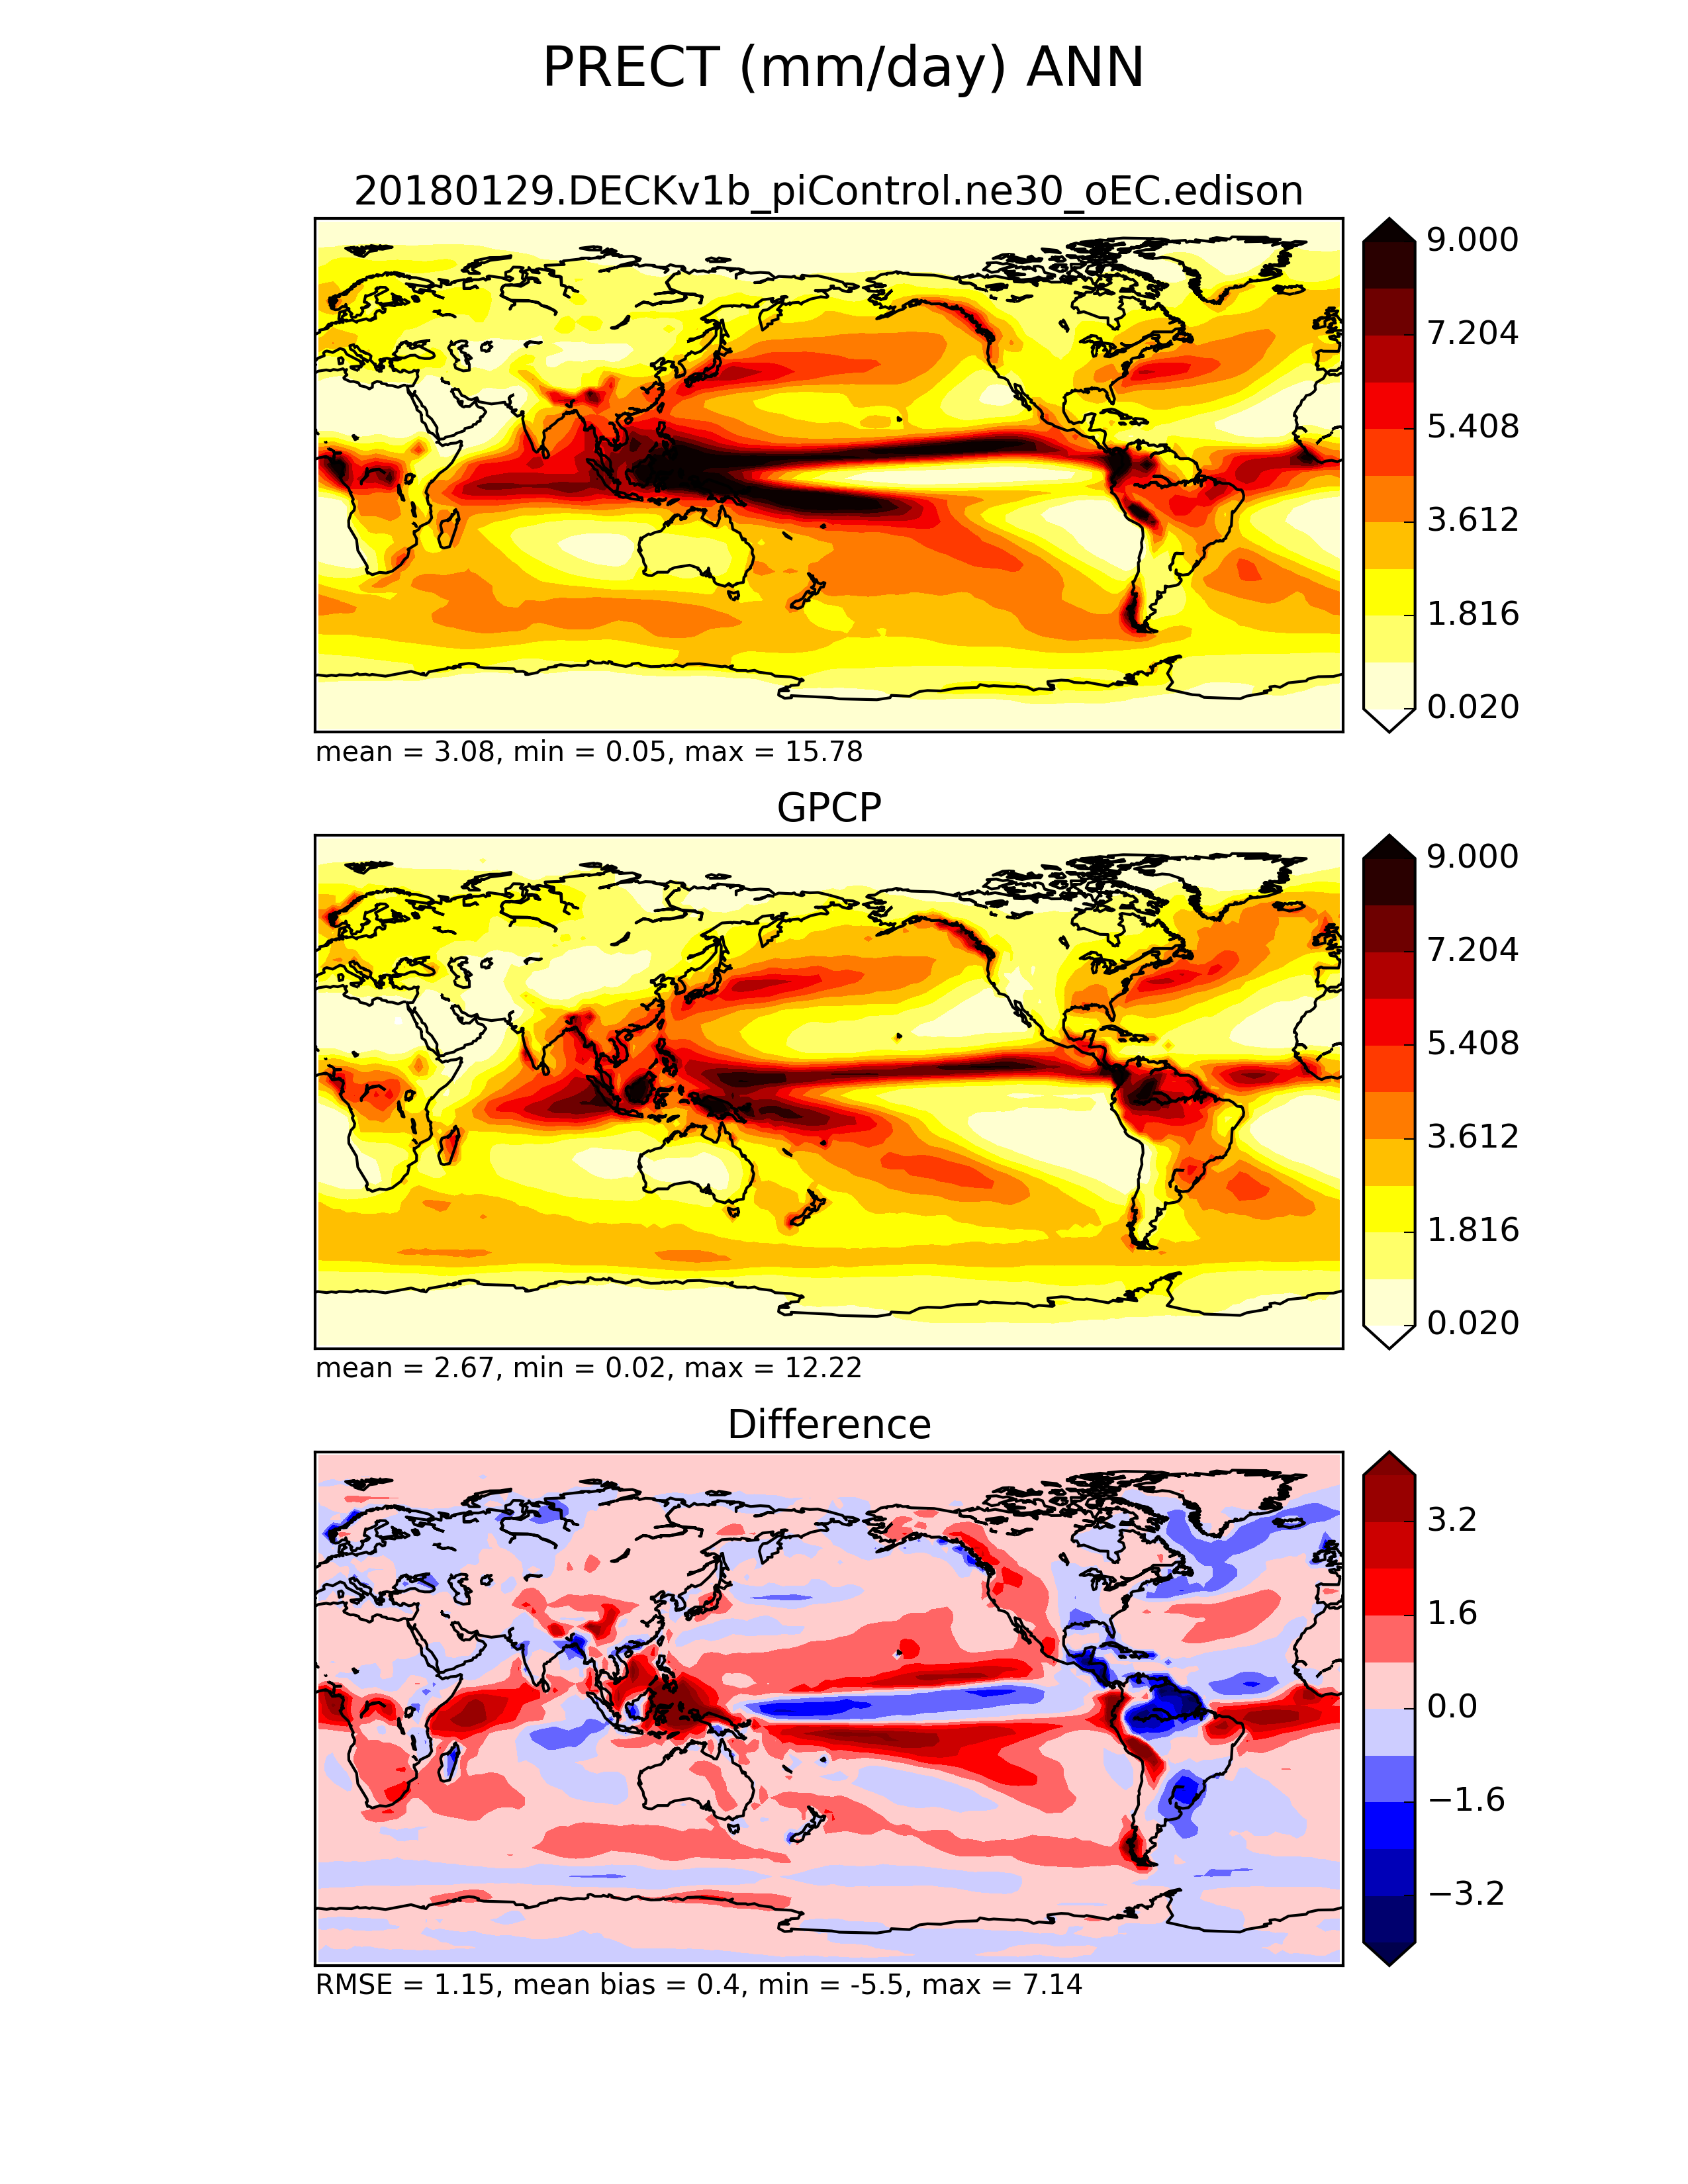
| Precipitation (GPCP)
|
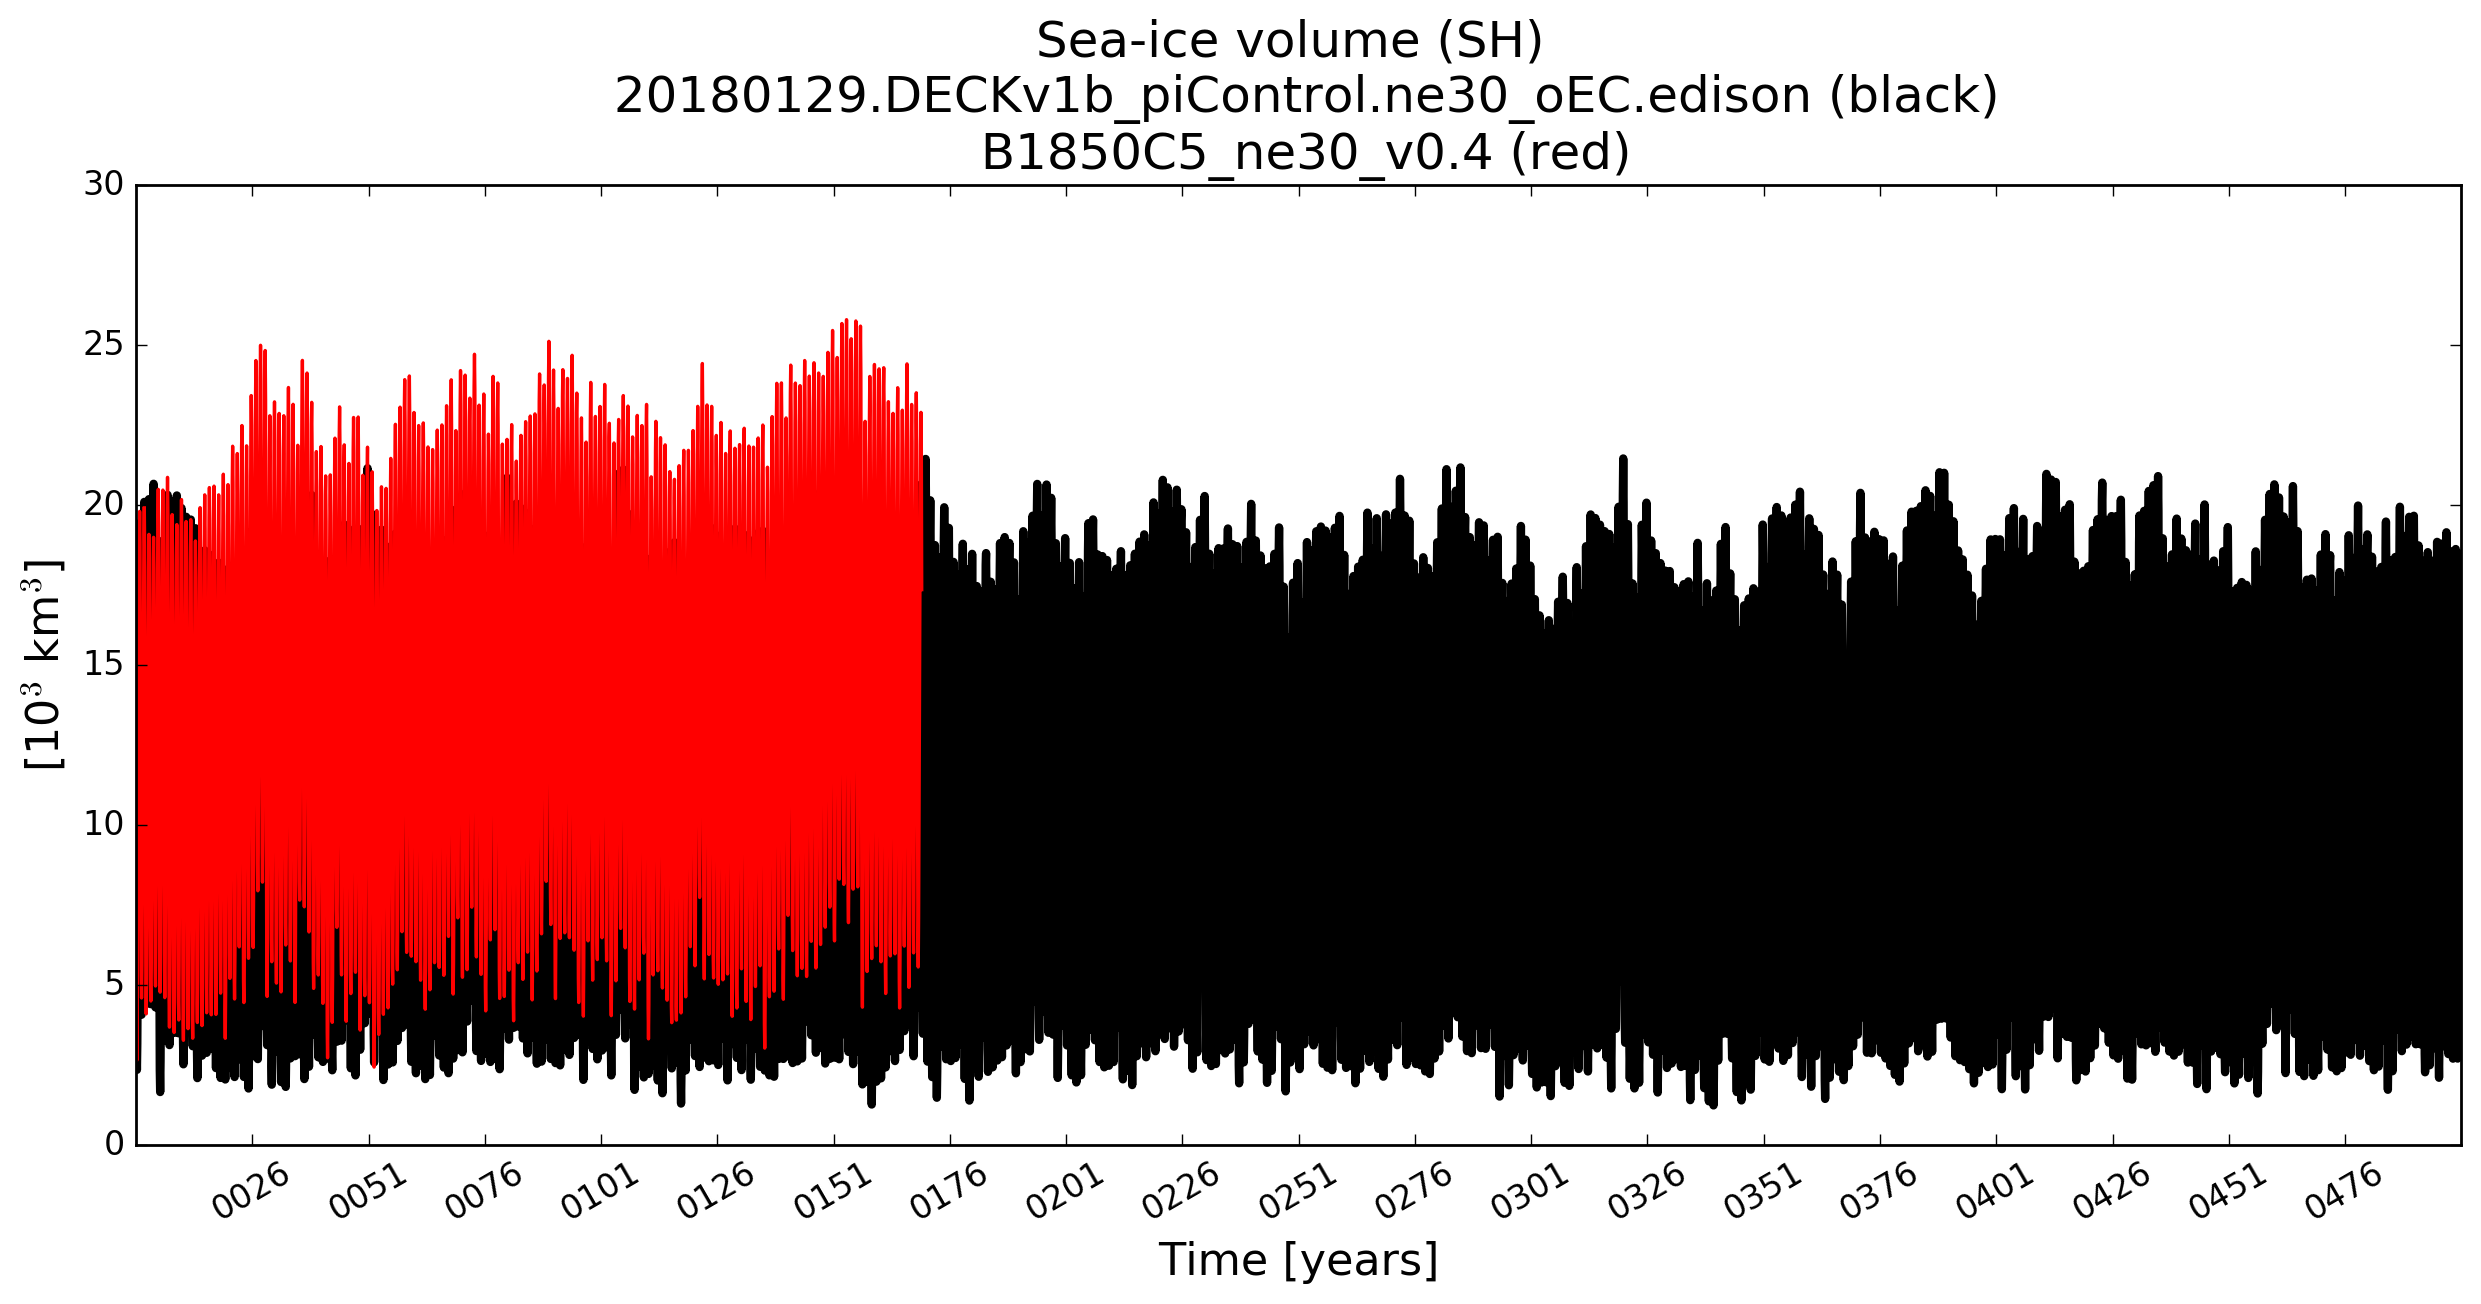
| PRECT
| Precipitation Rate
|
|
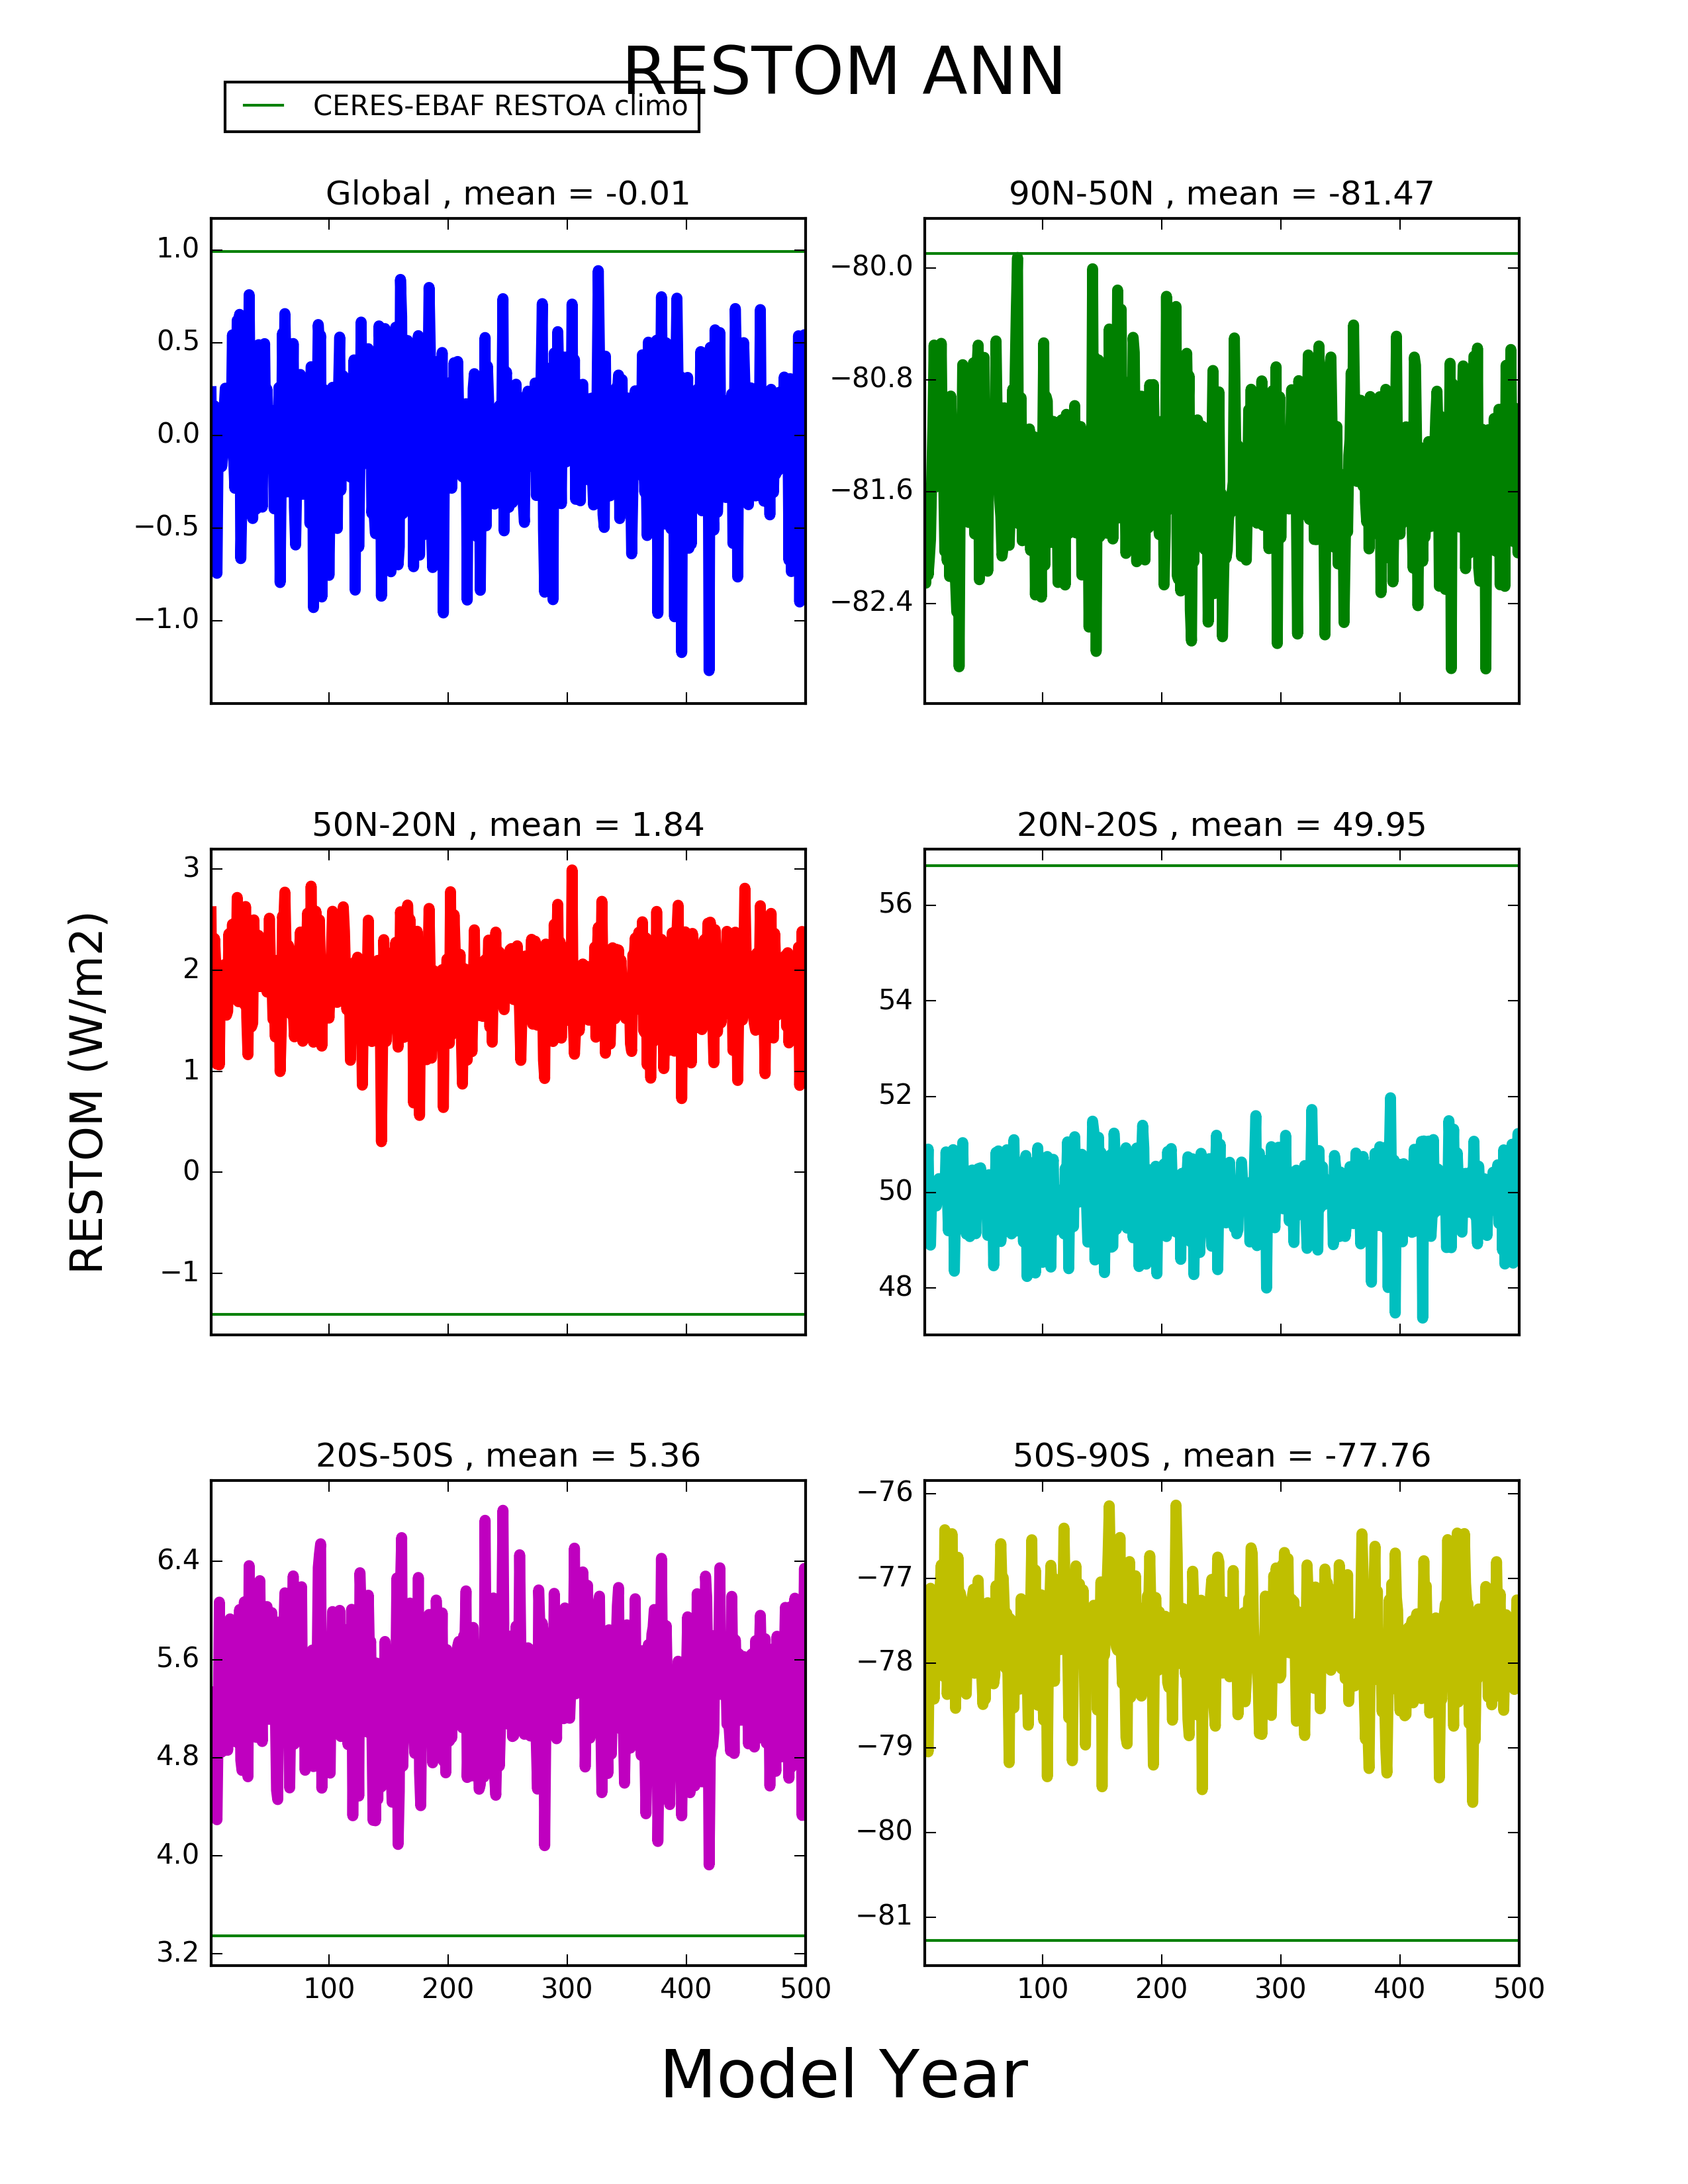
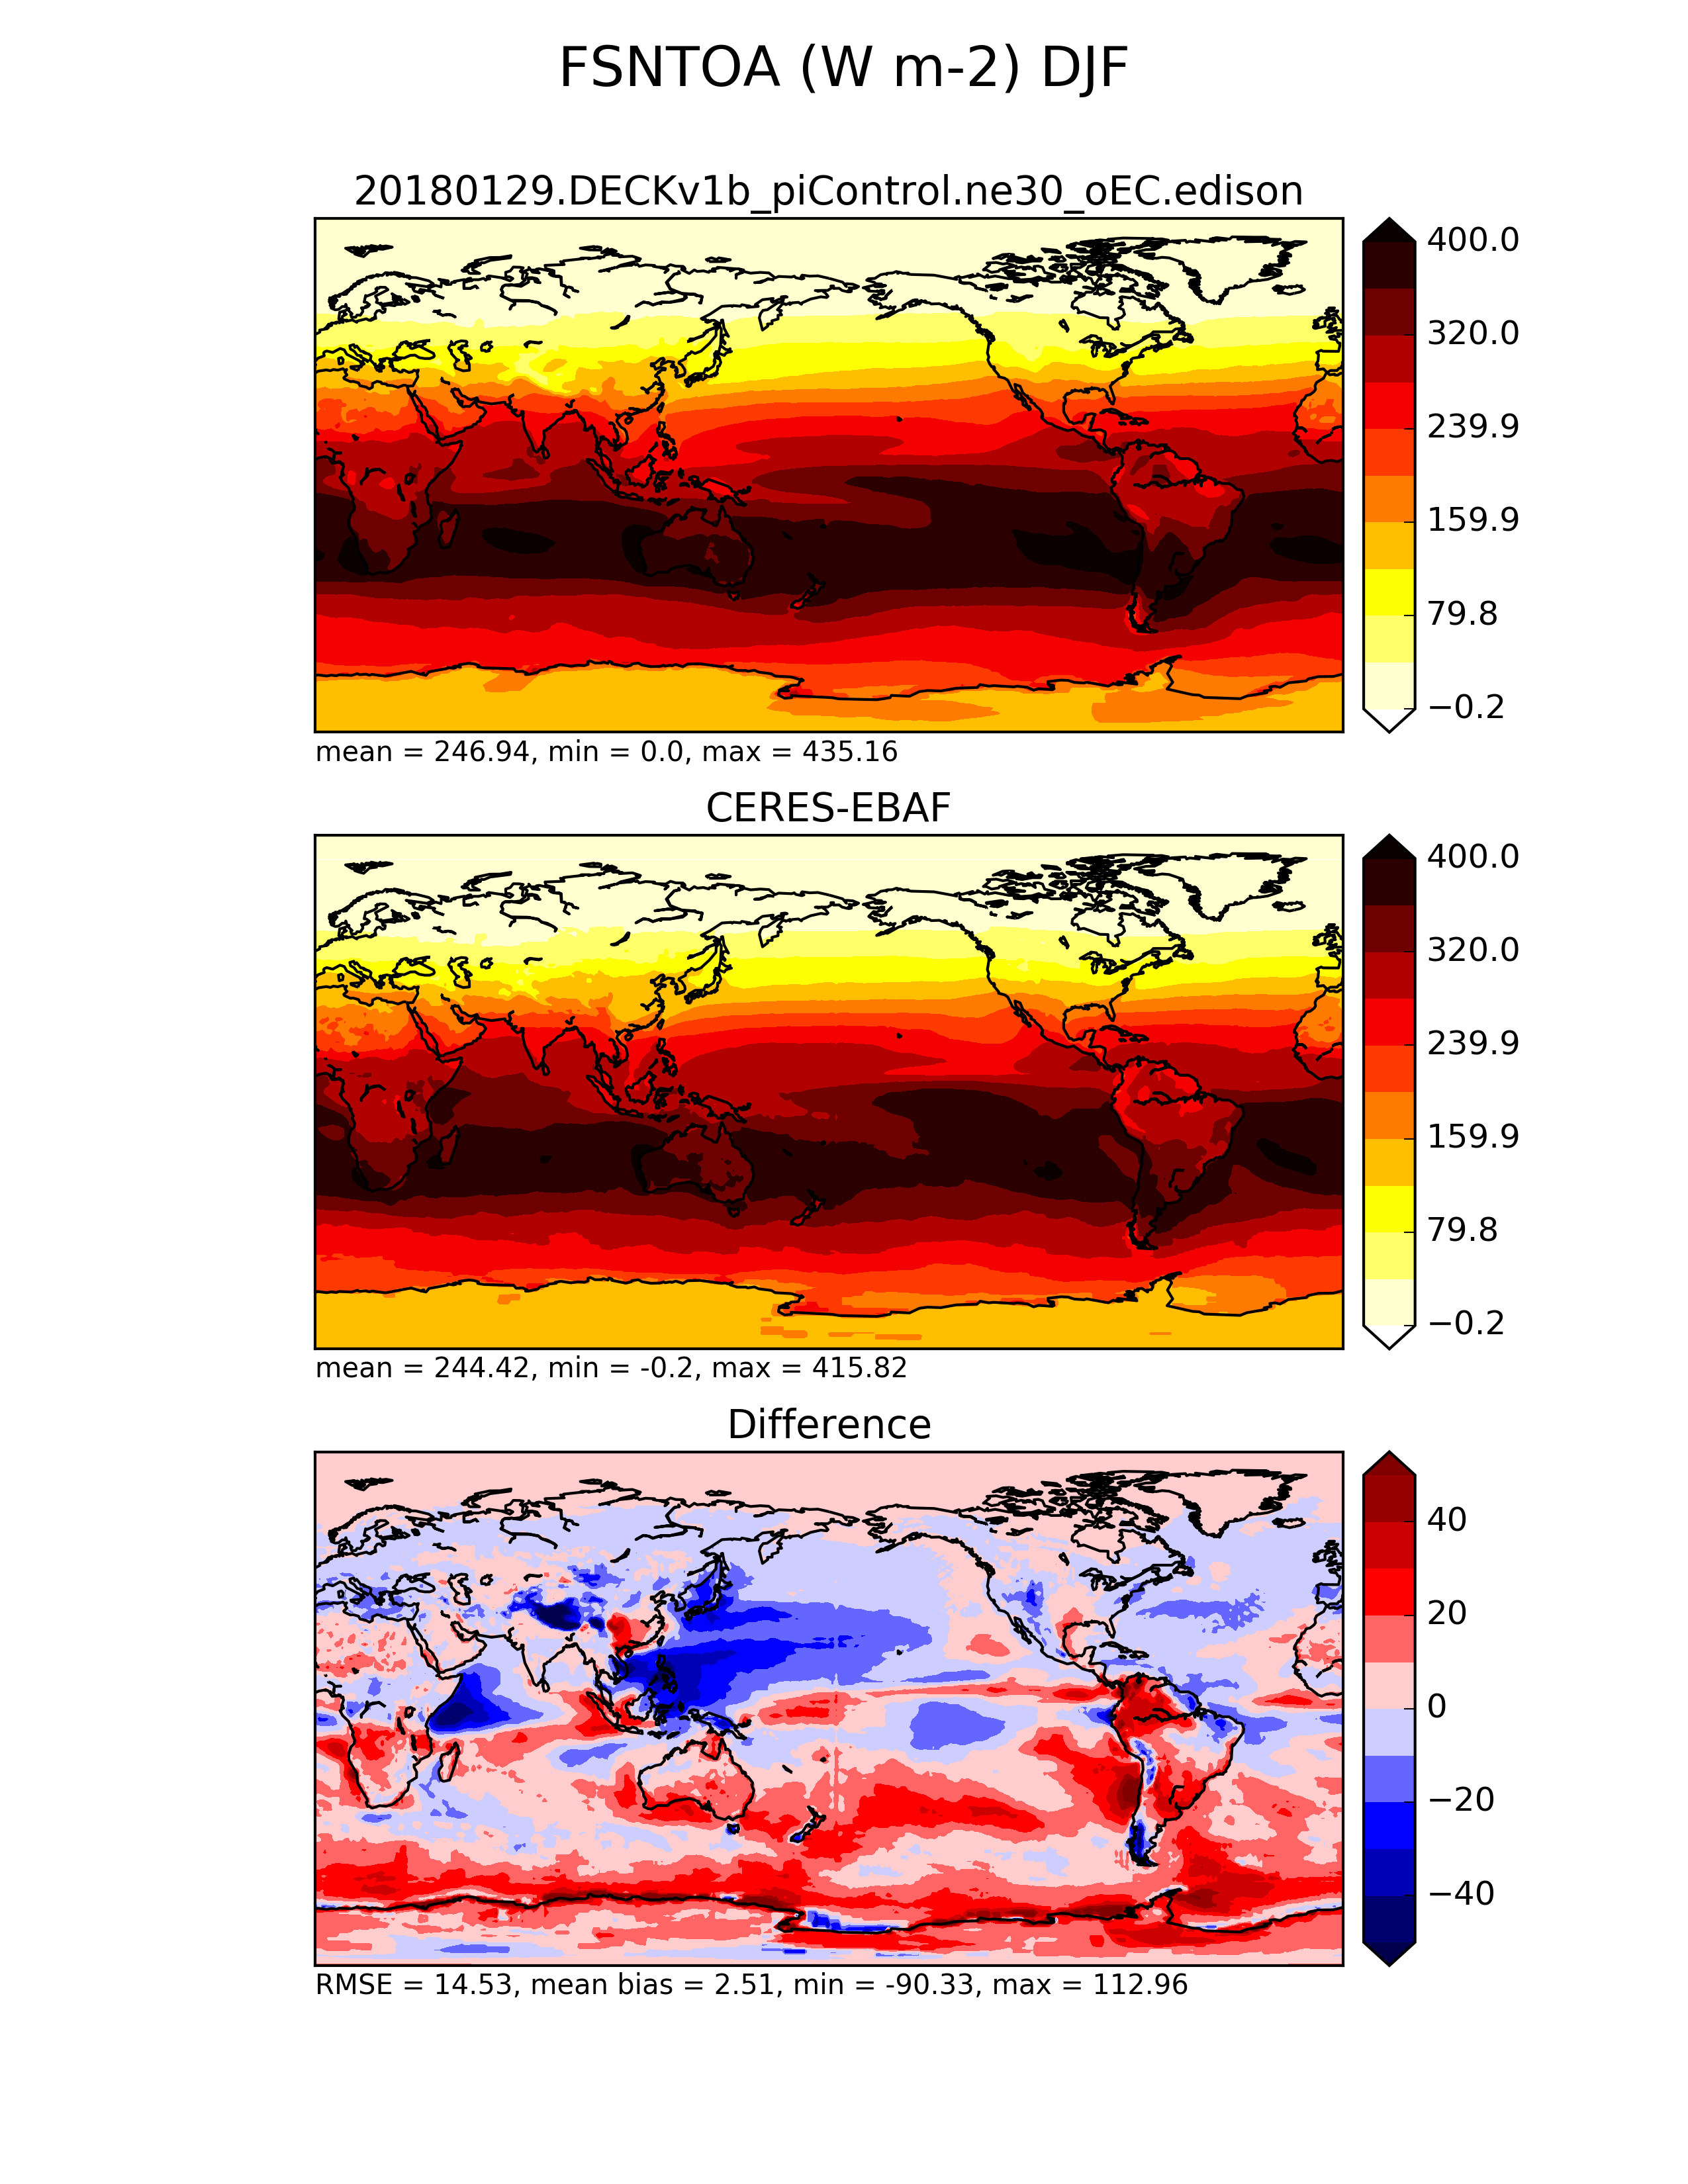
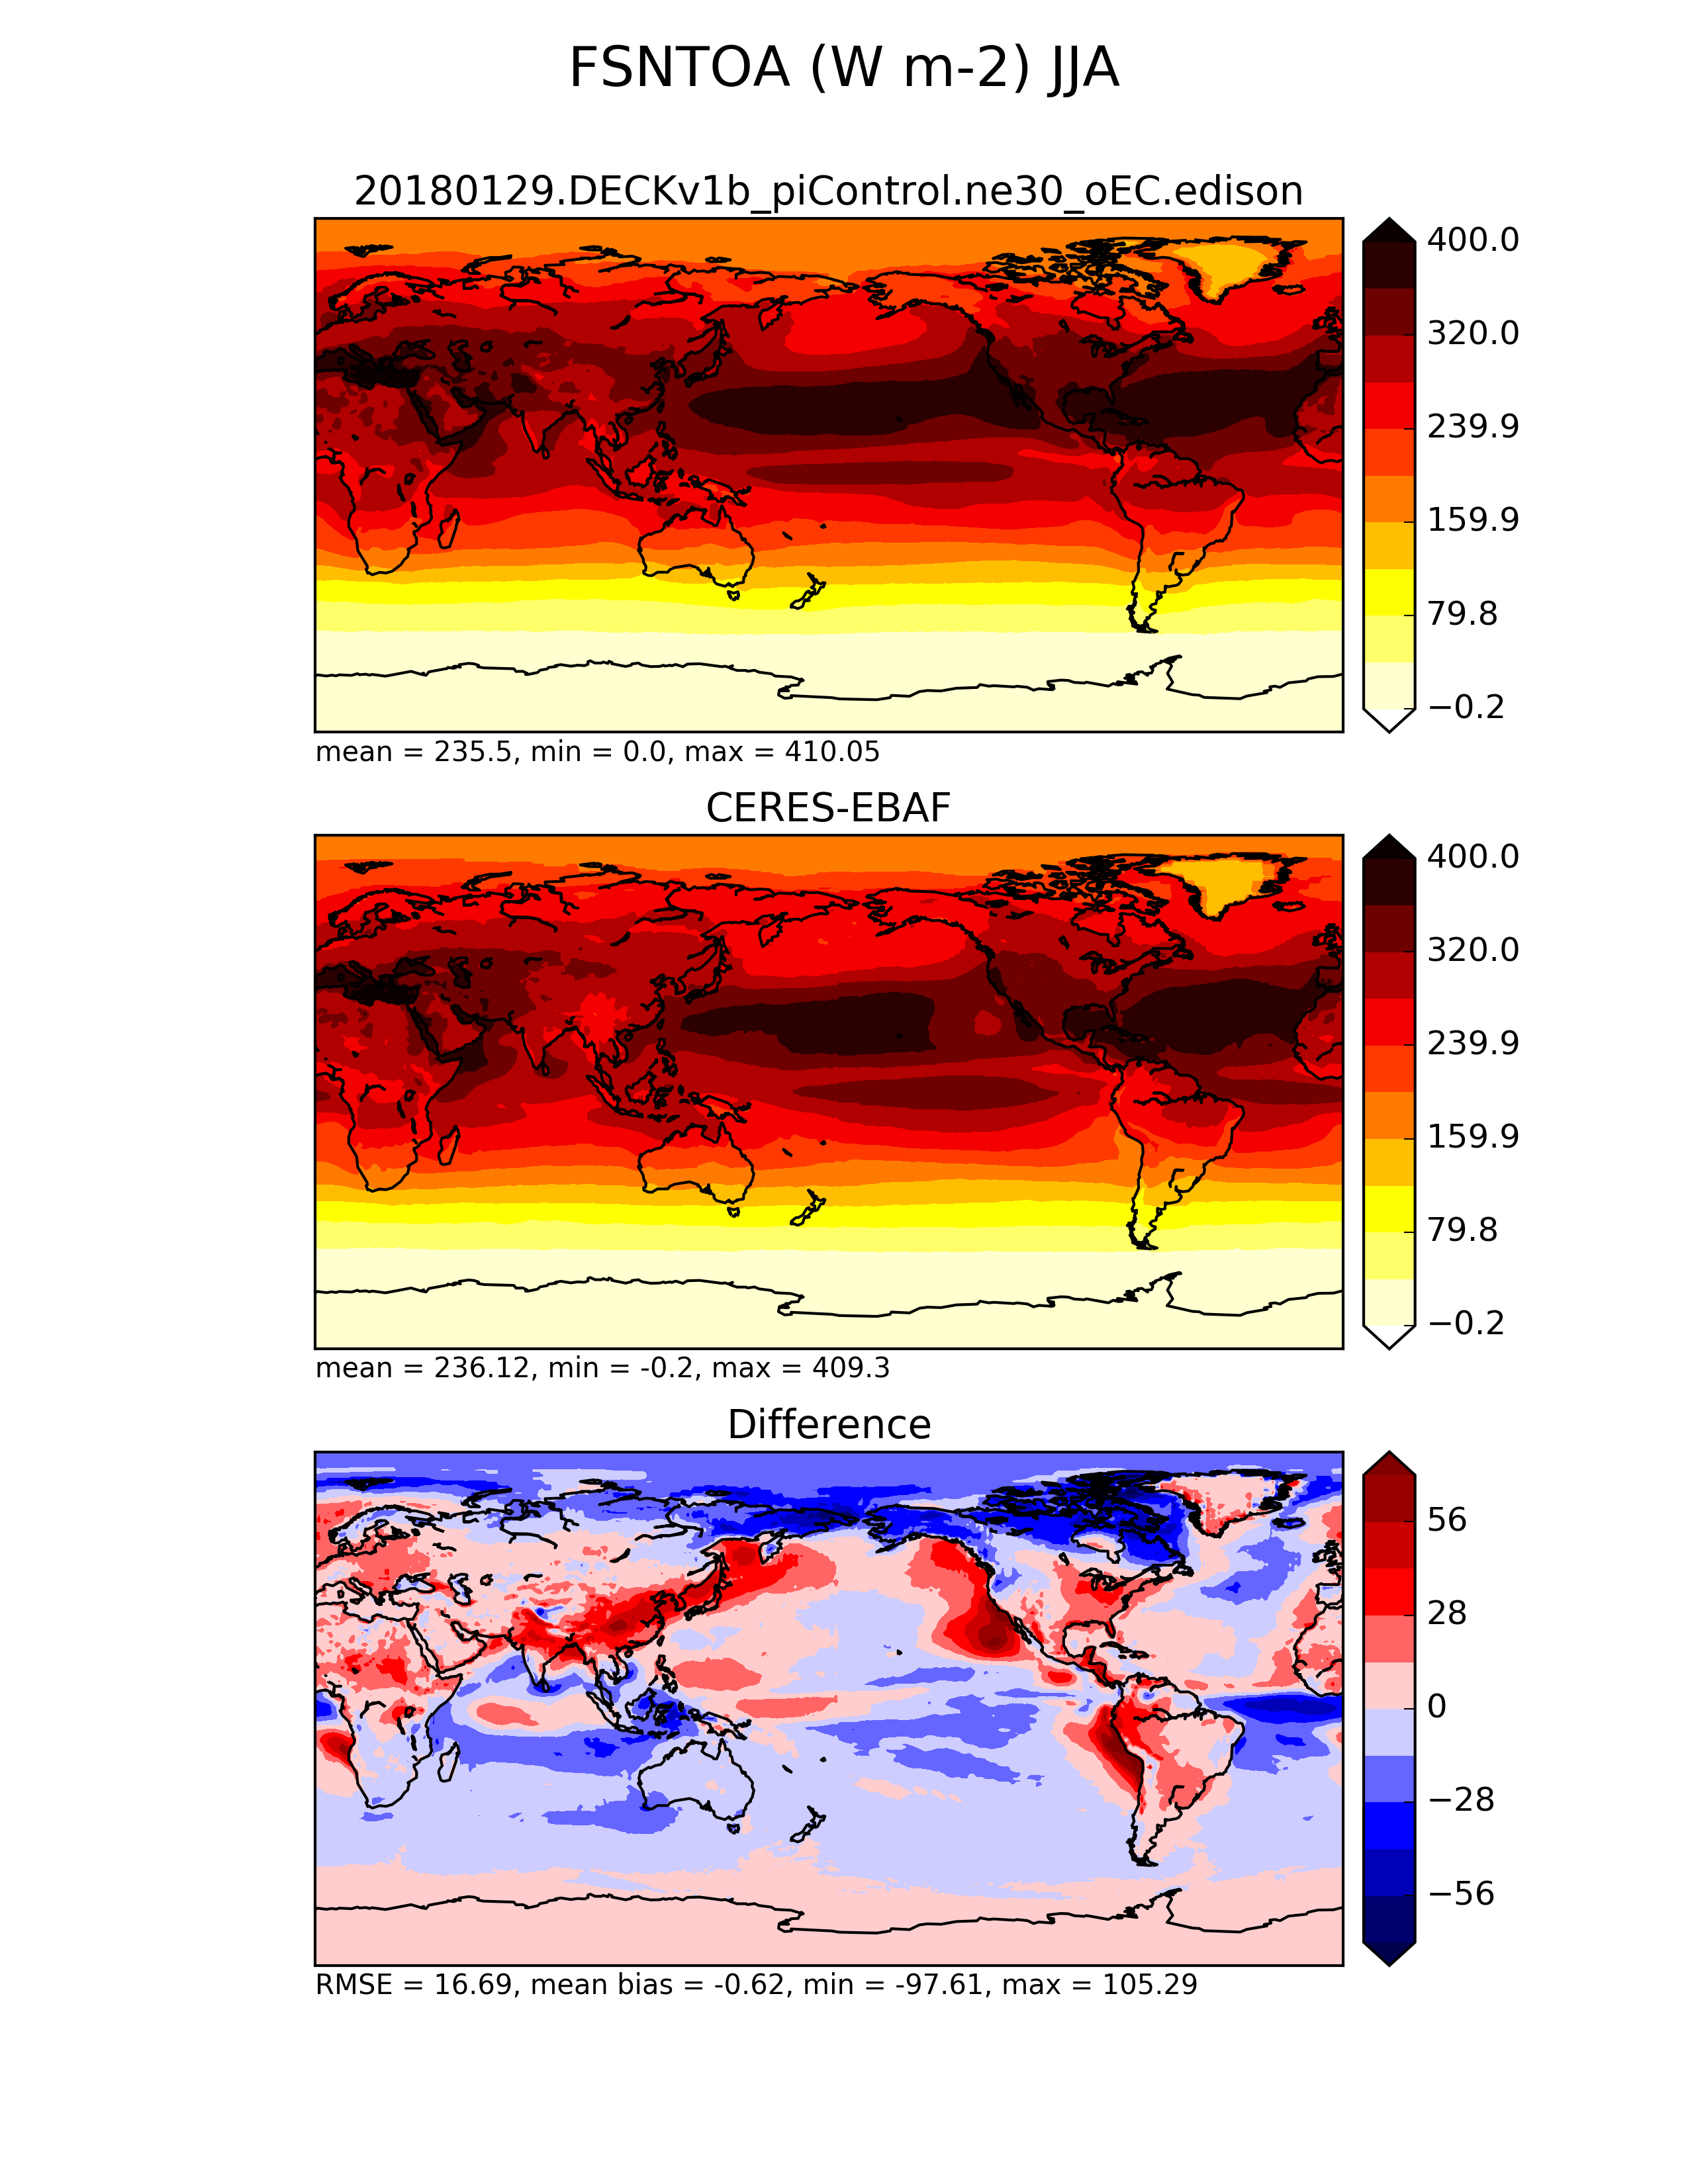
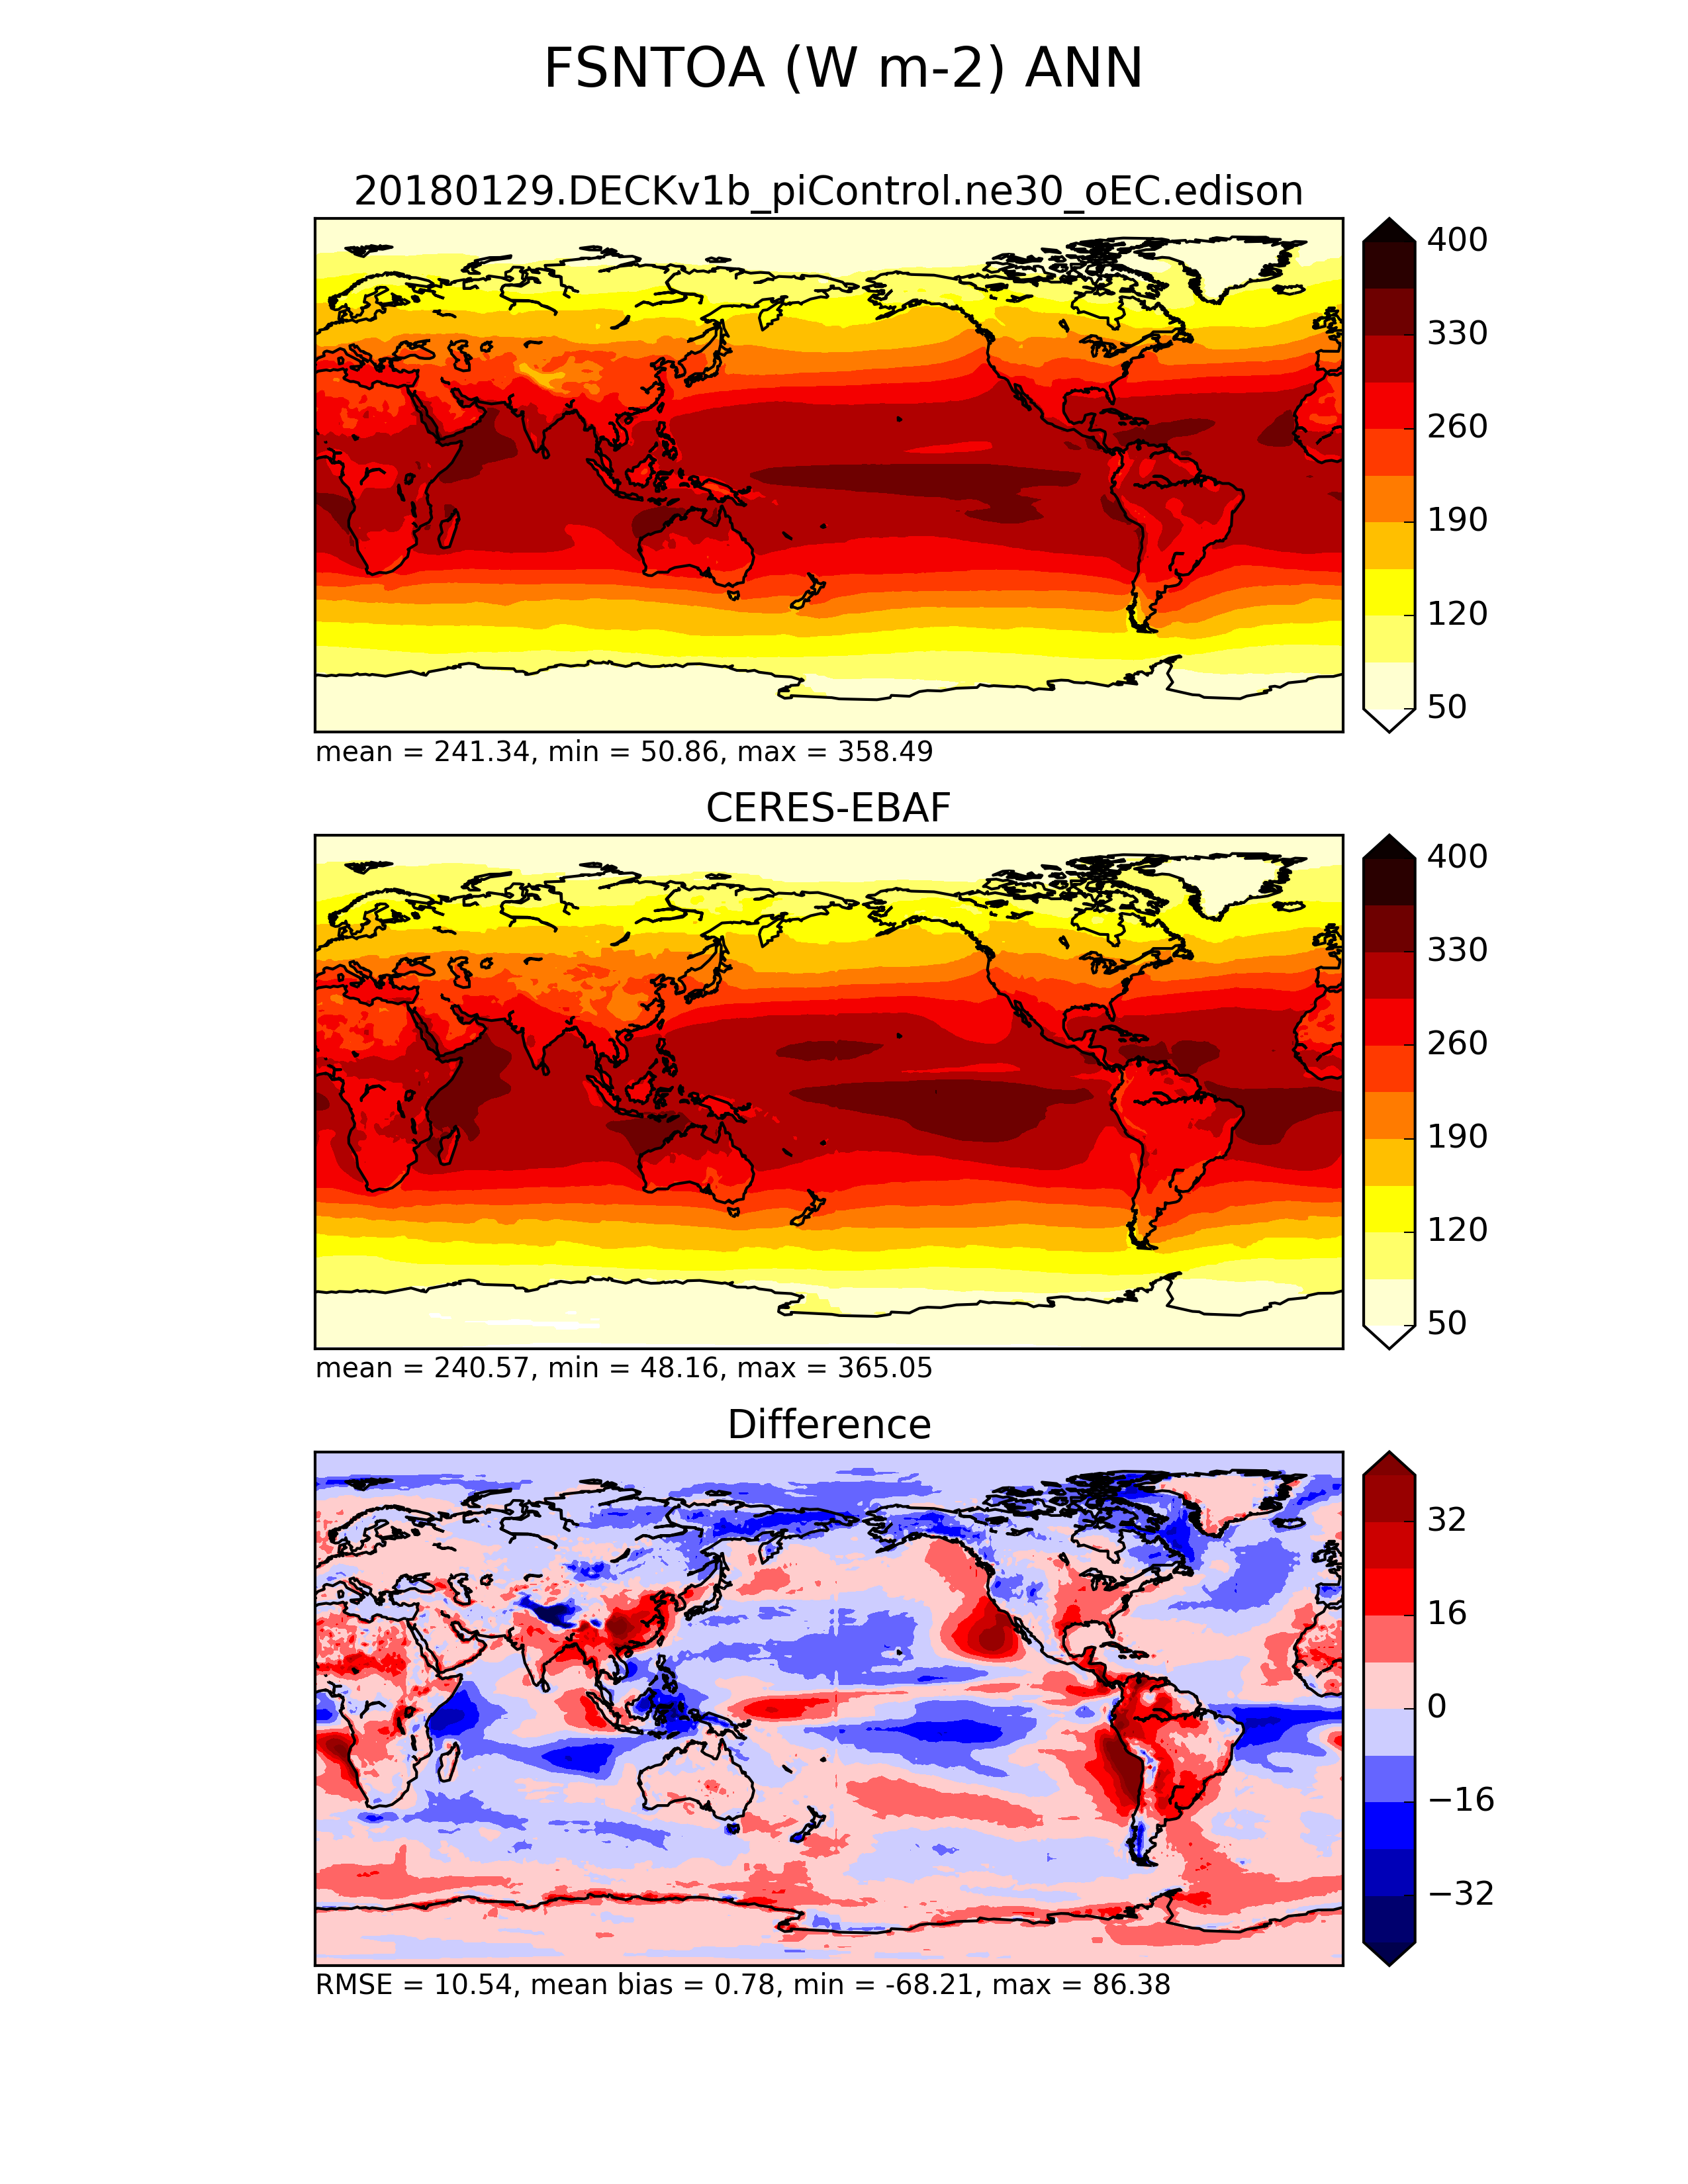
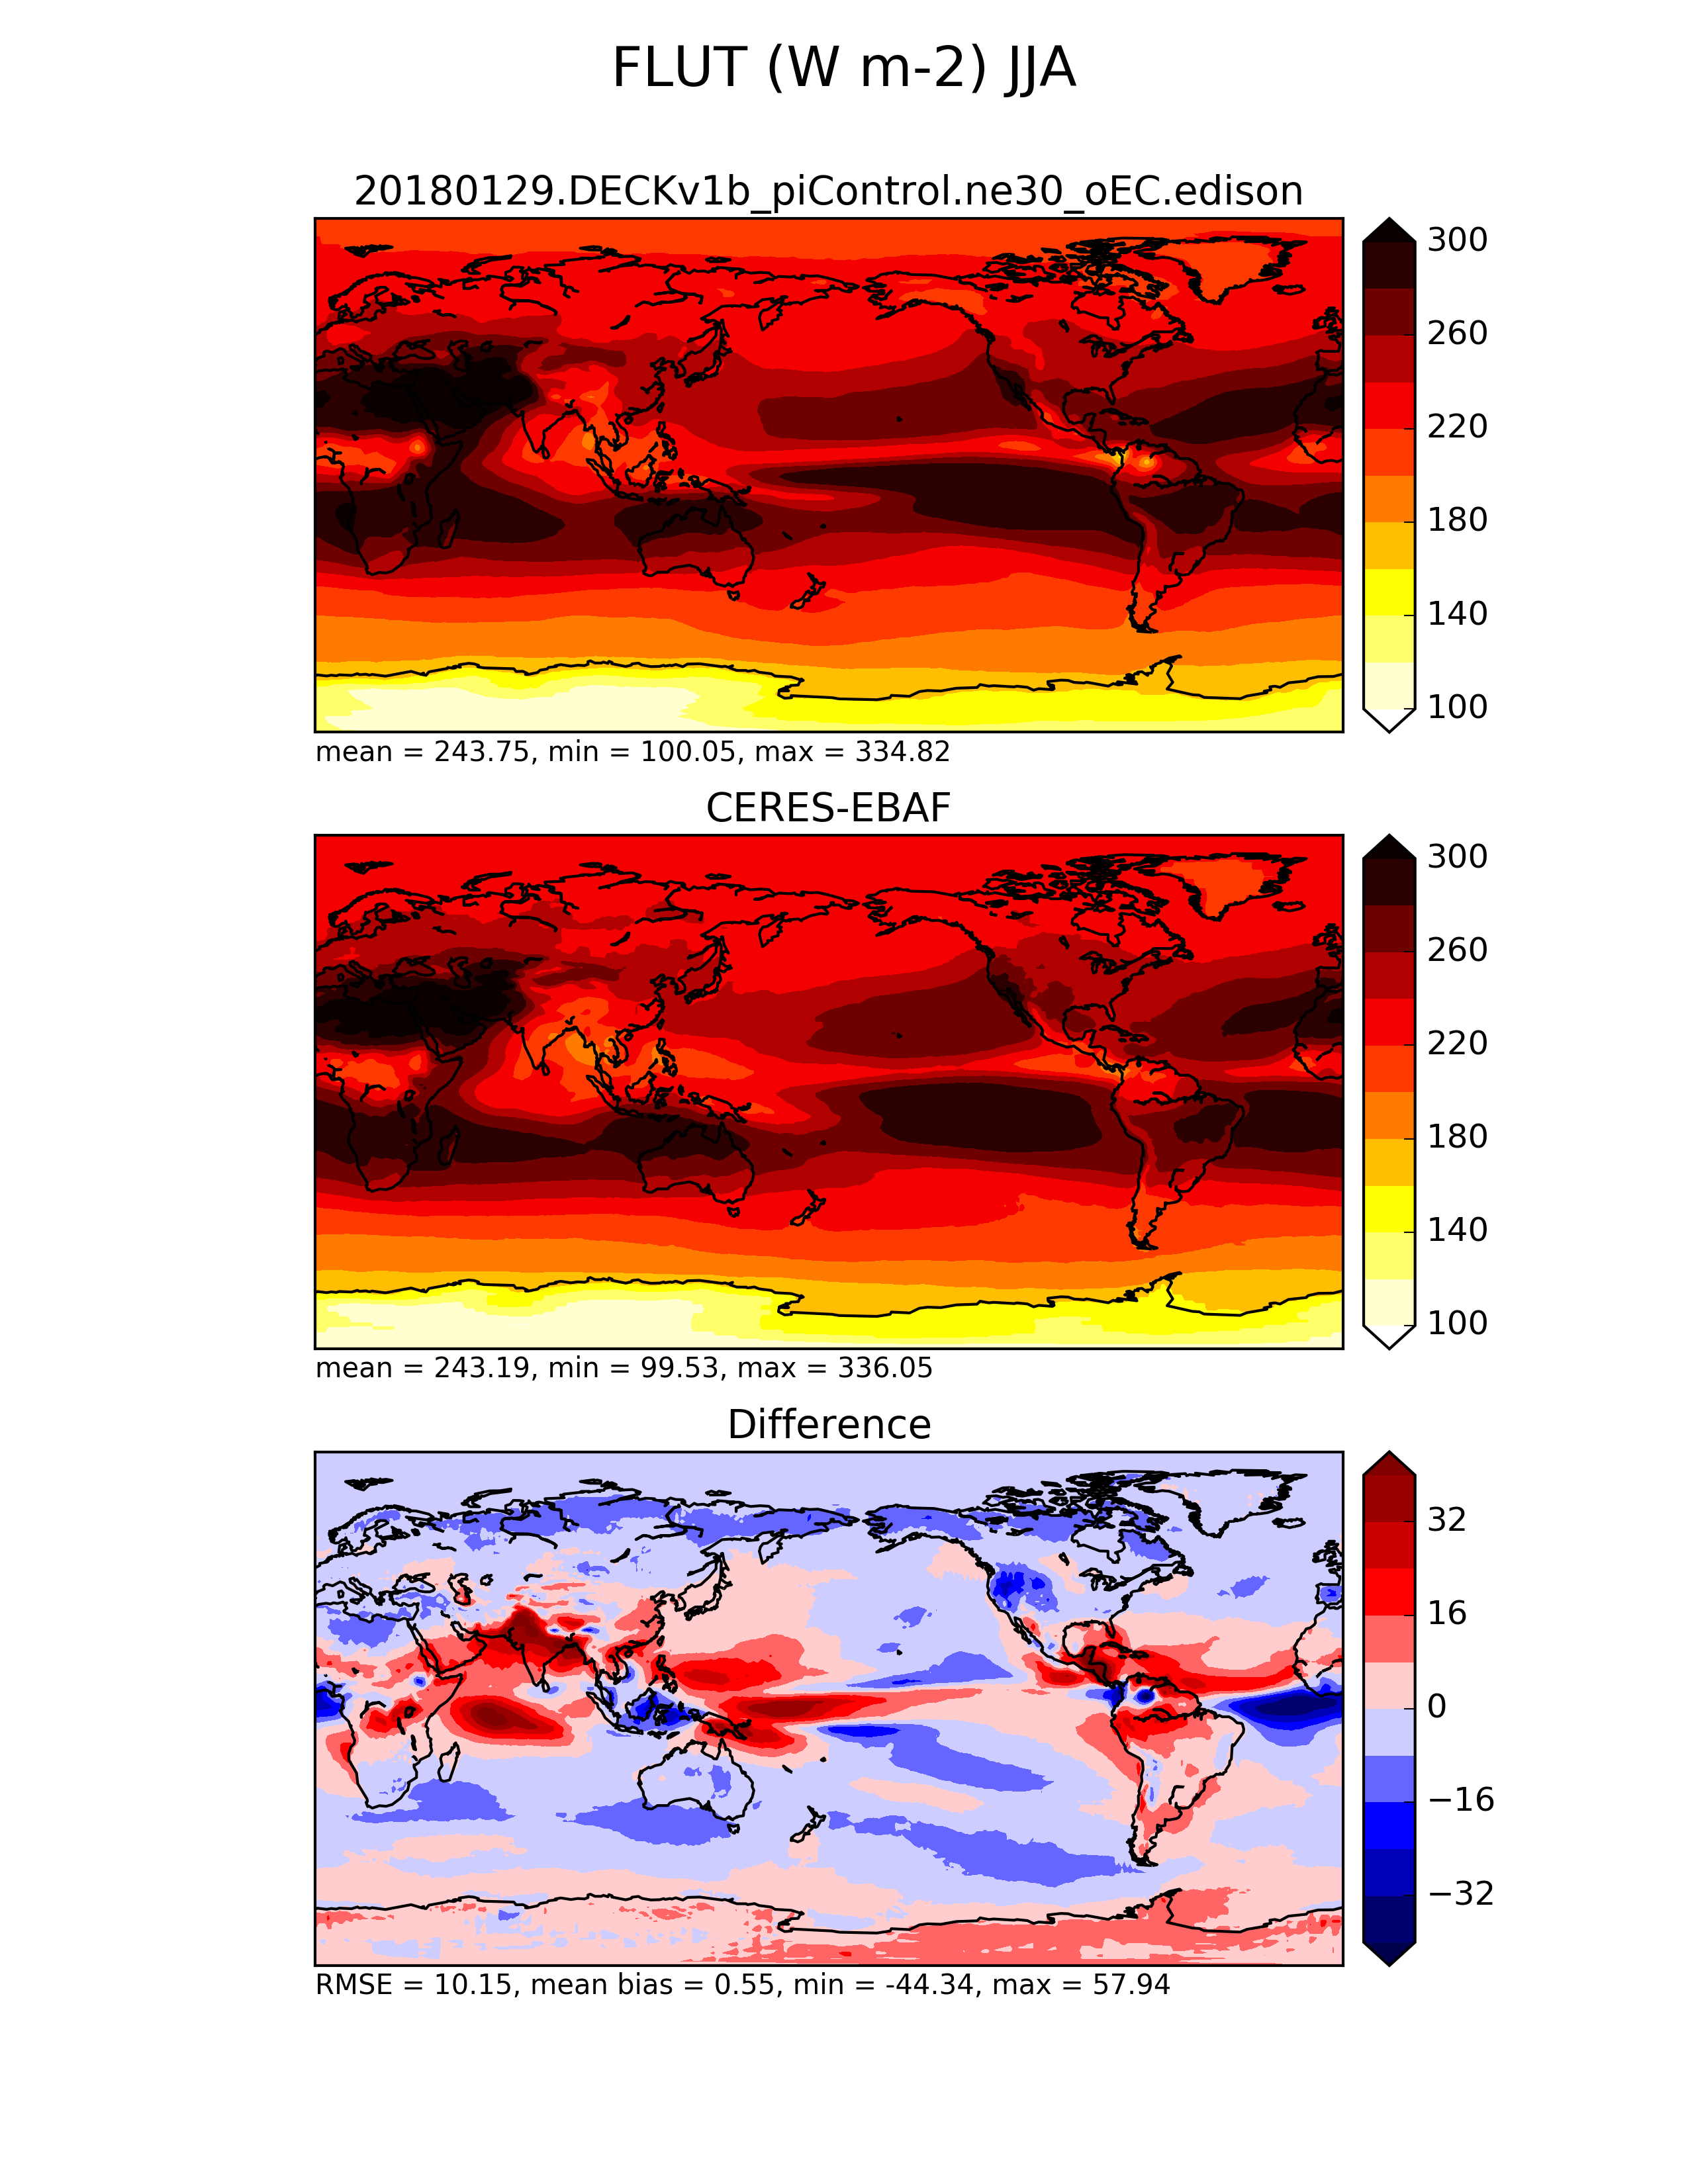
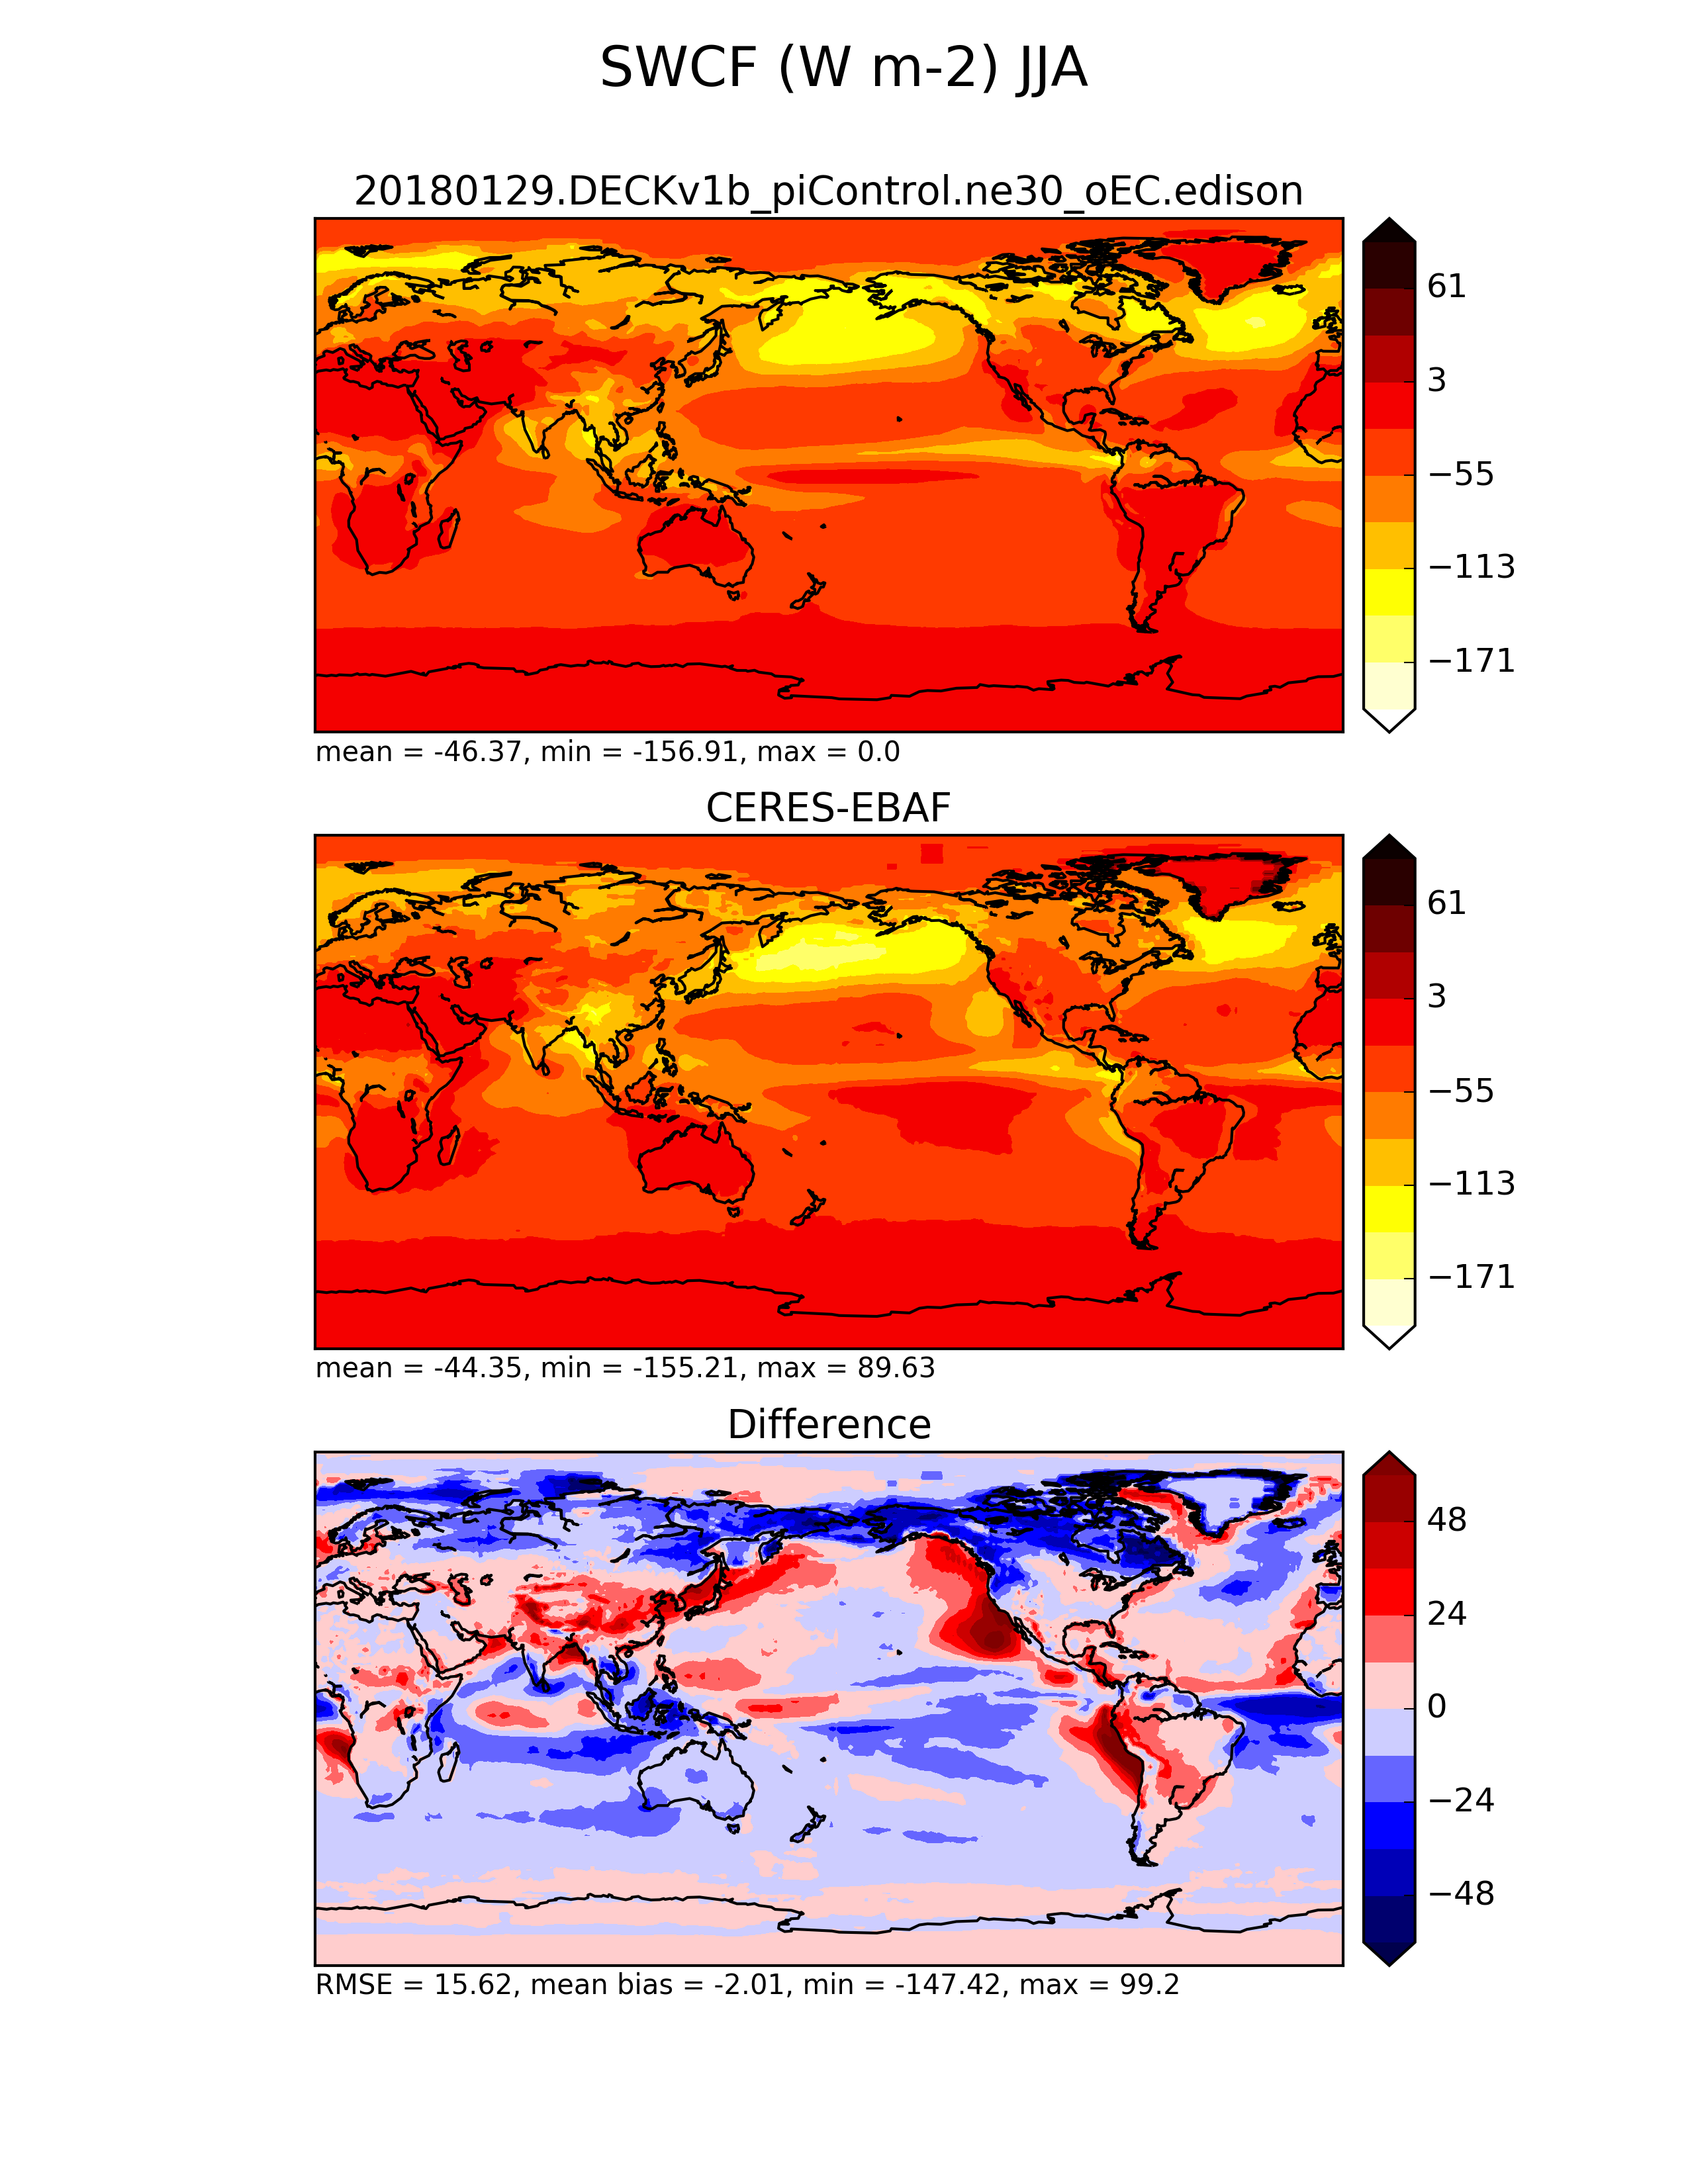
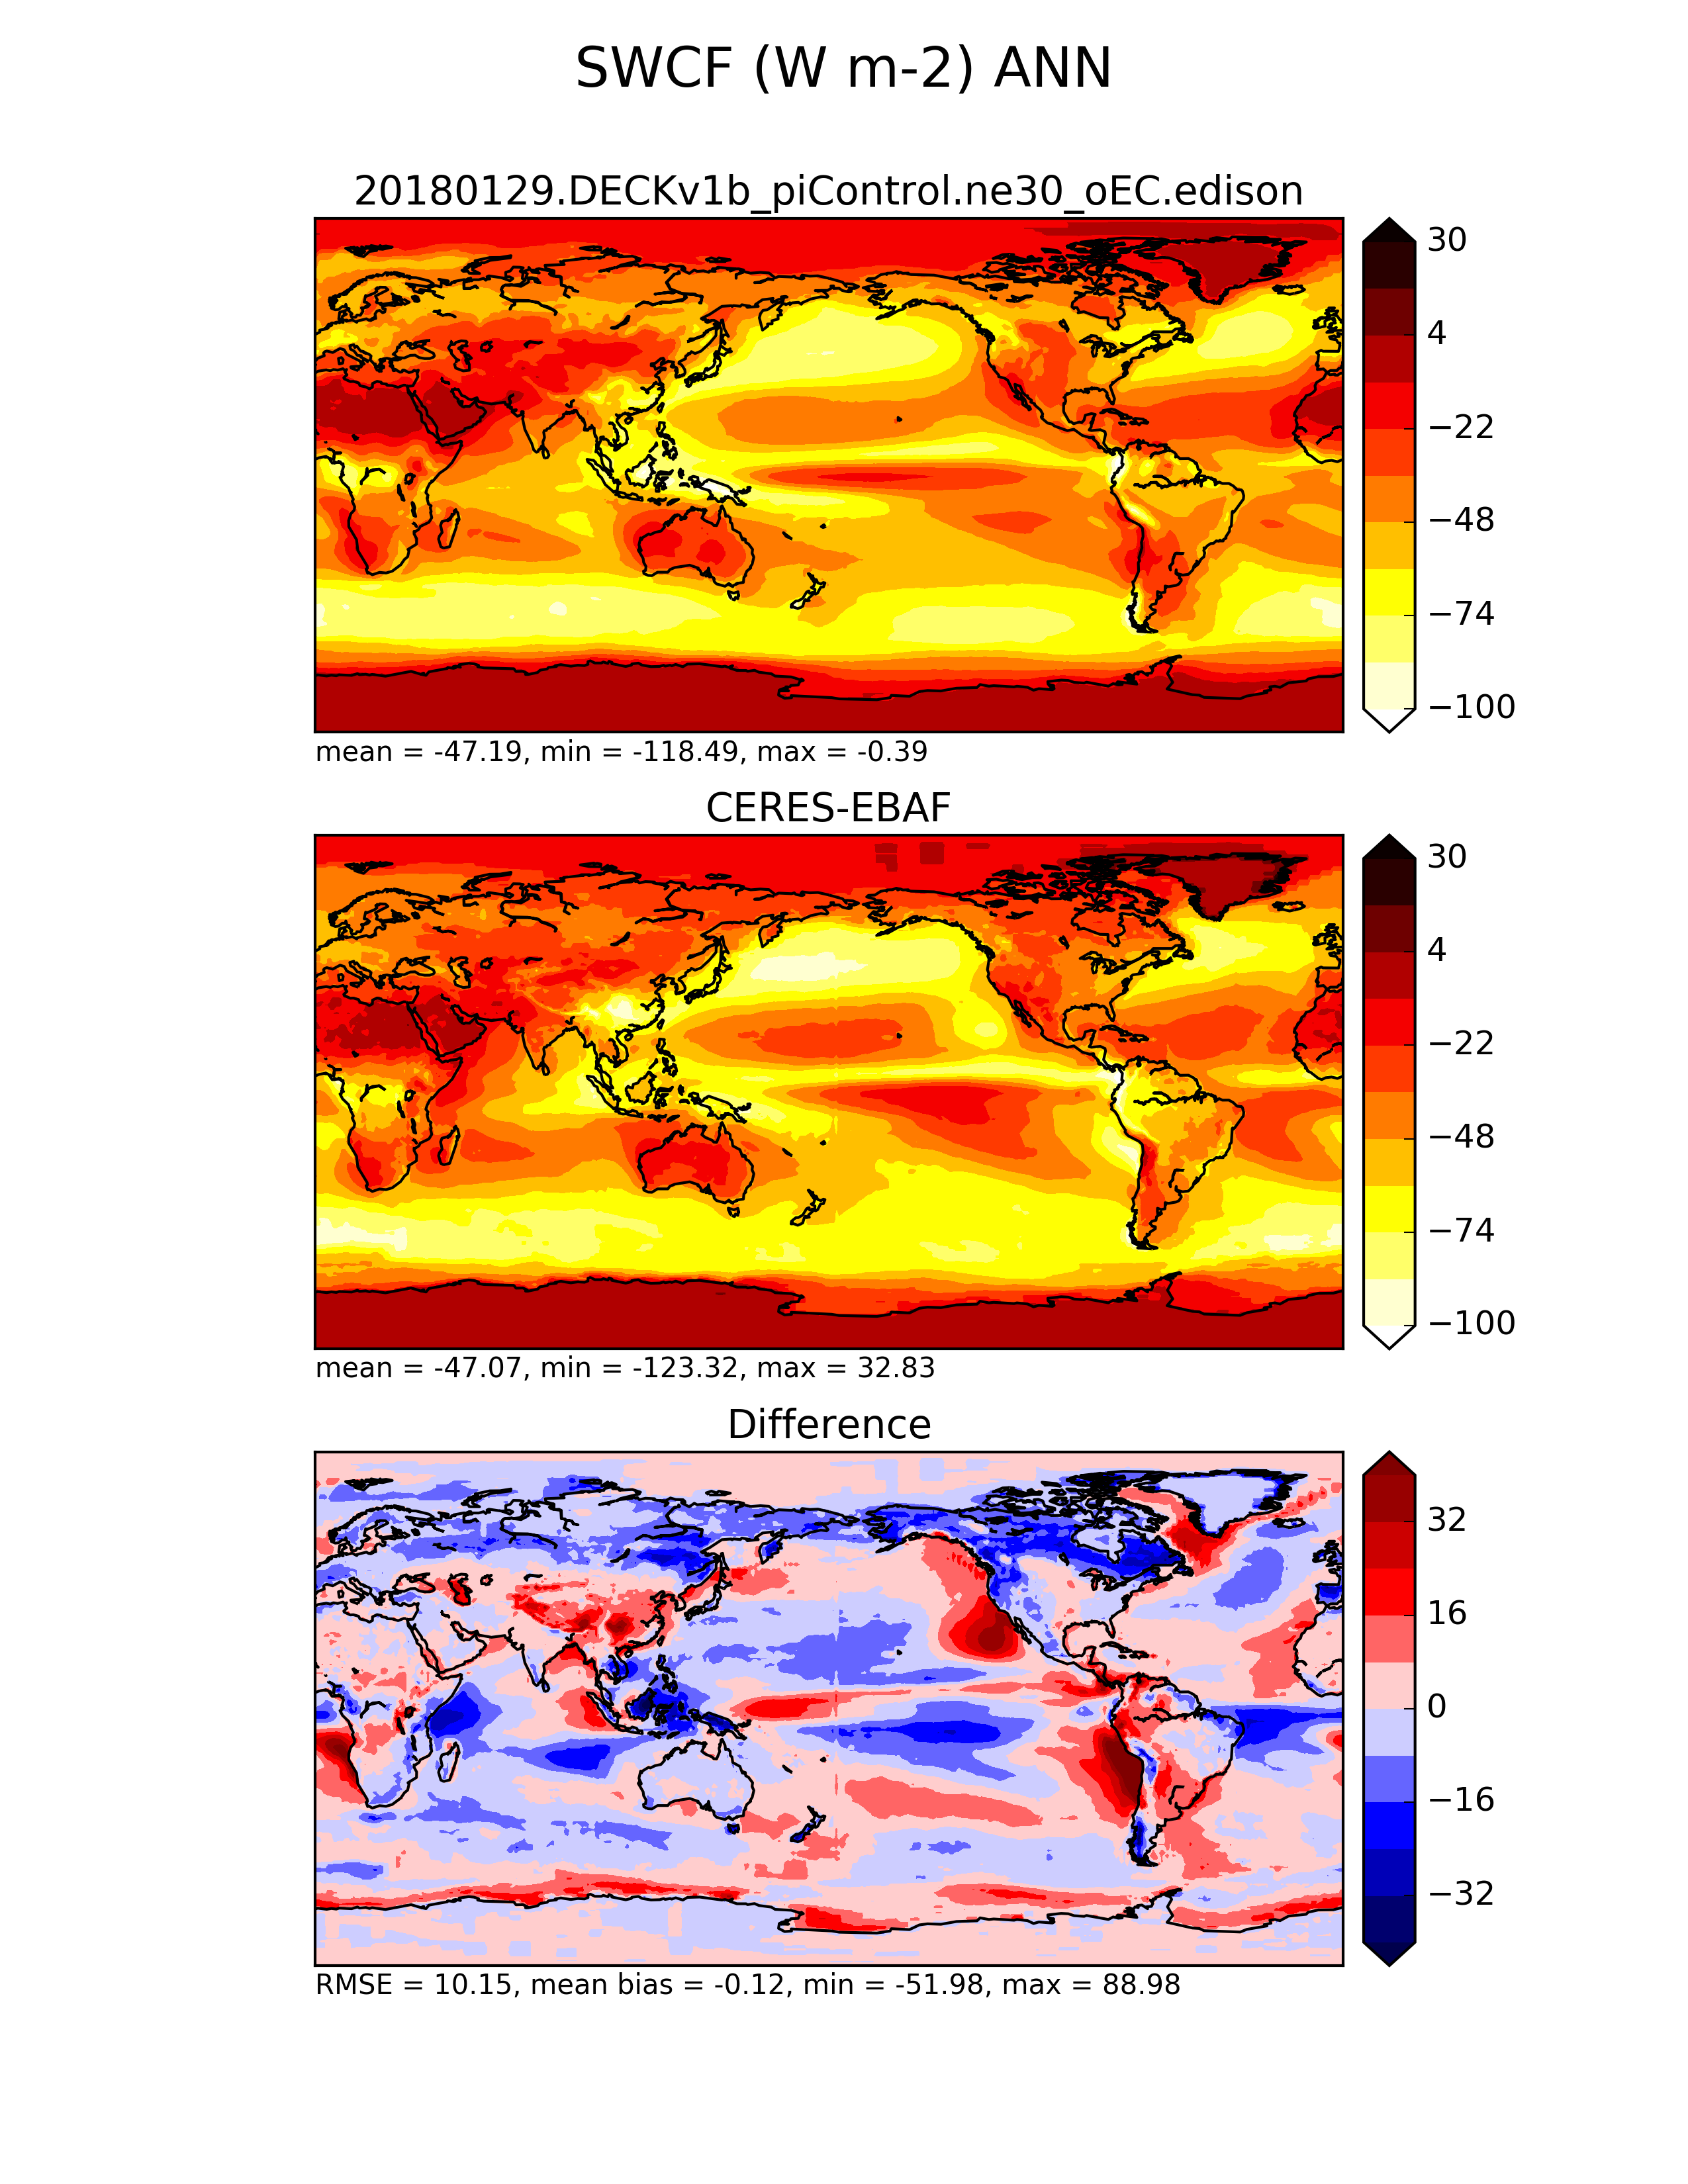
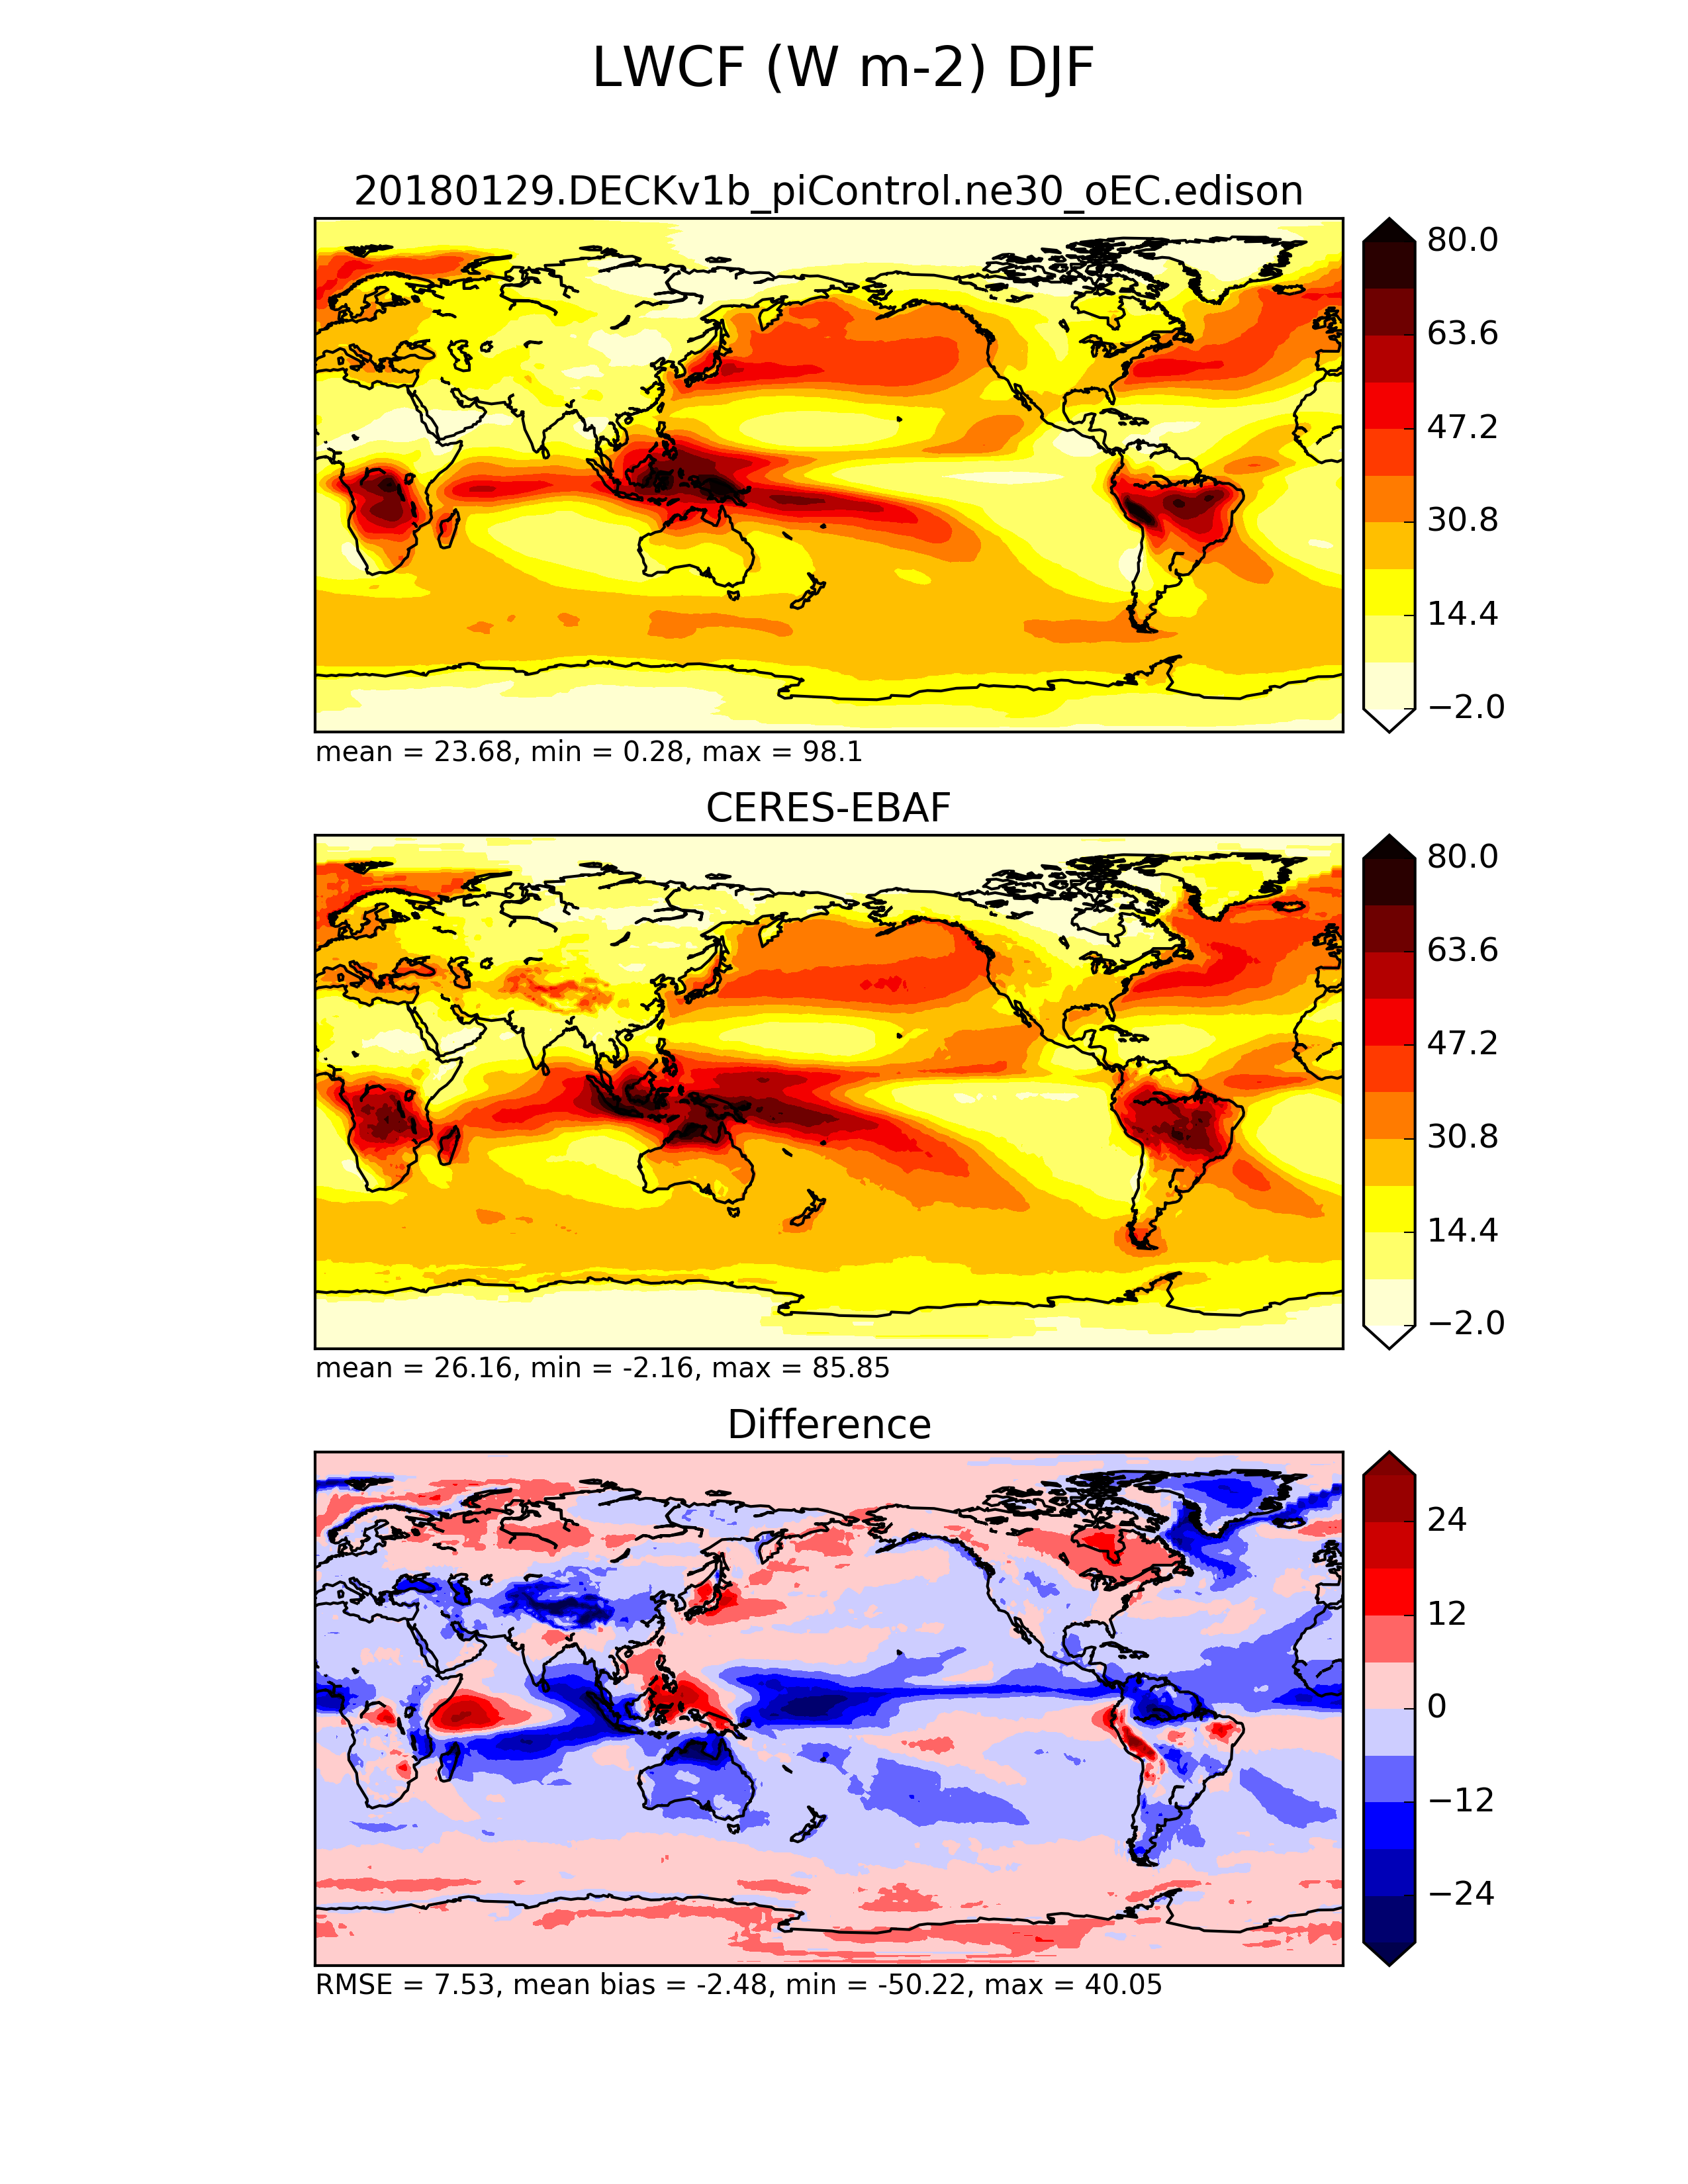
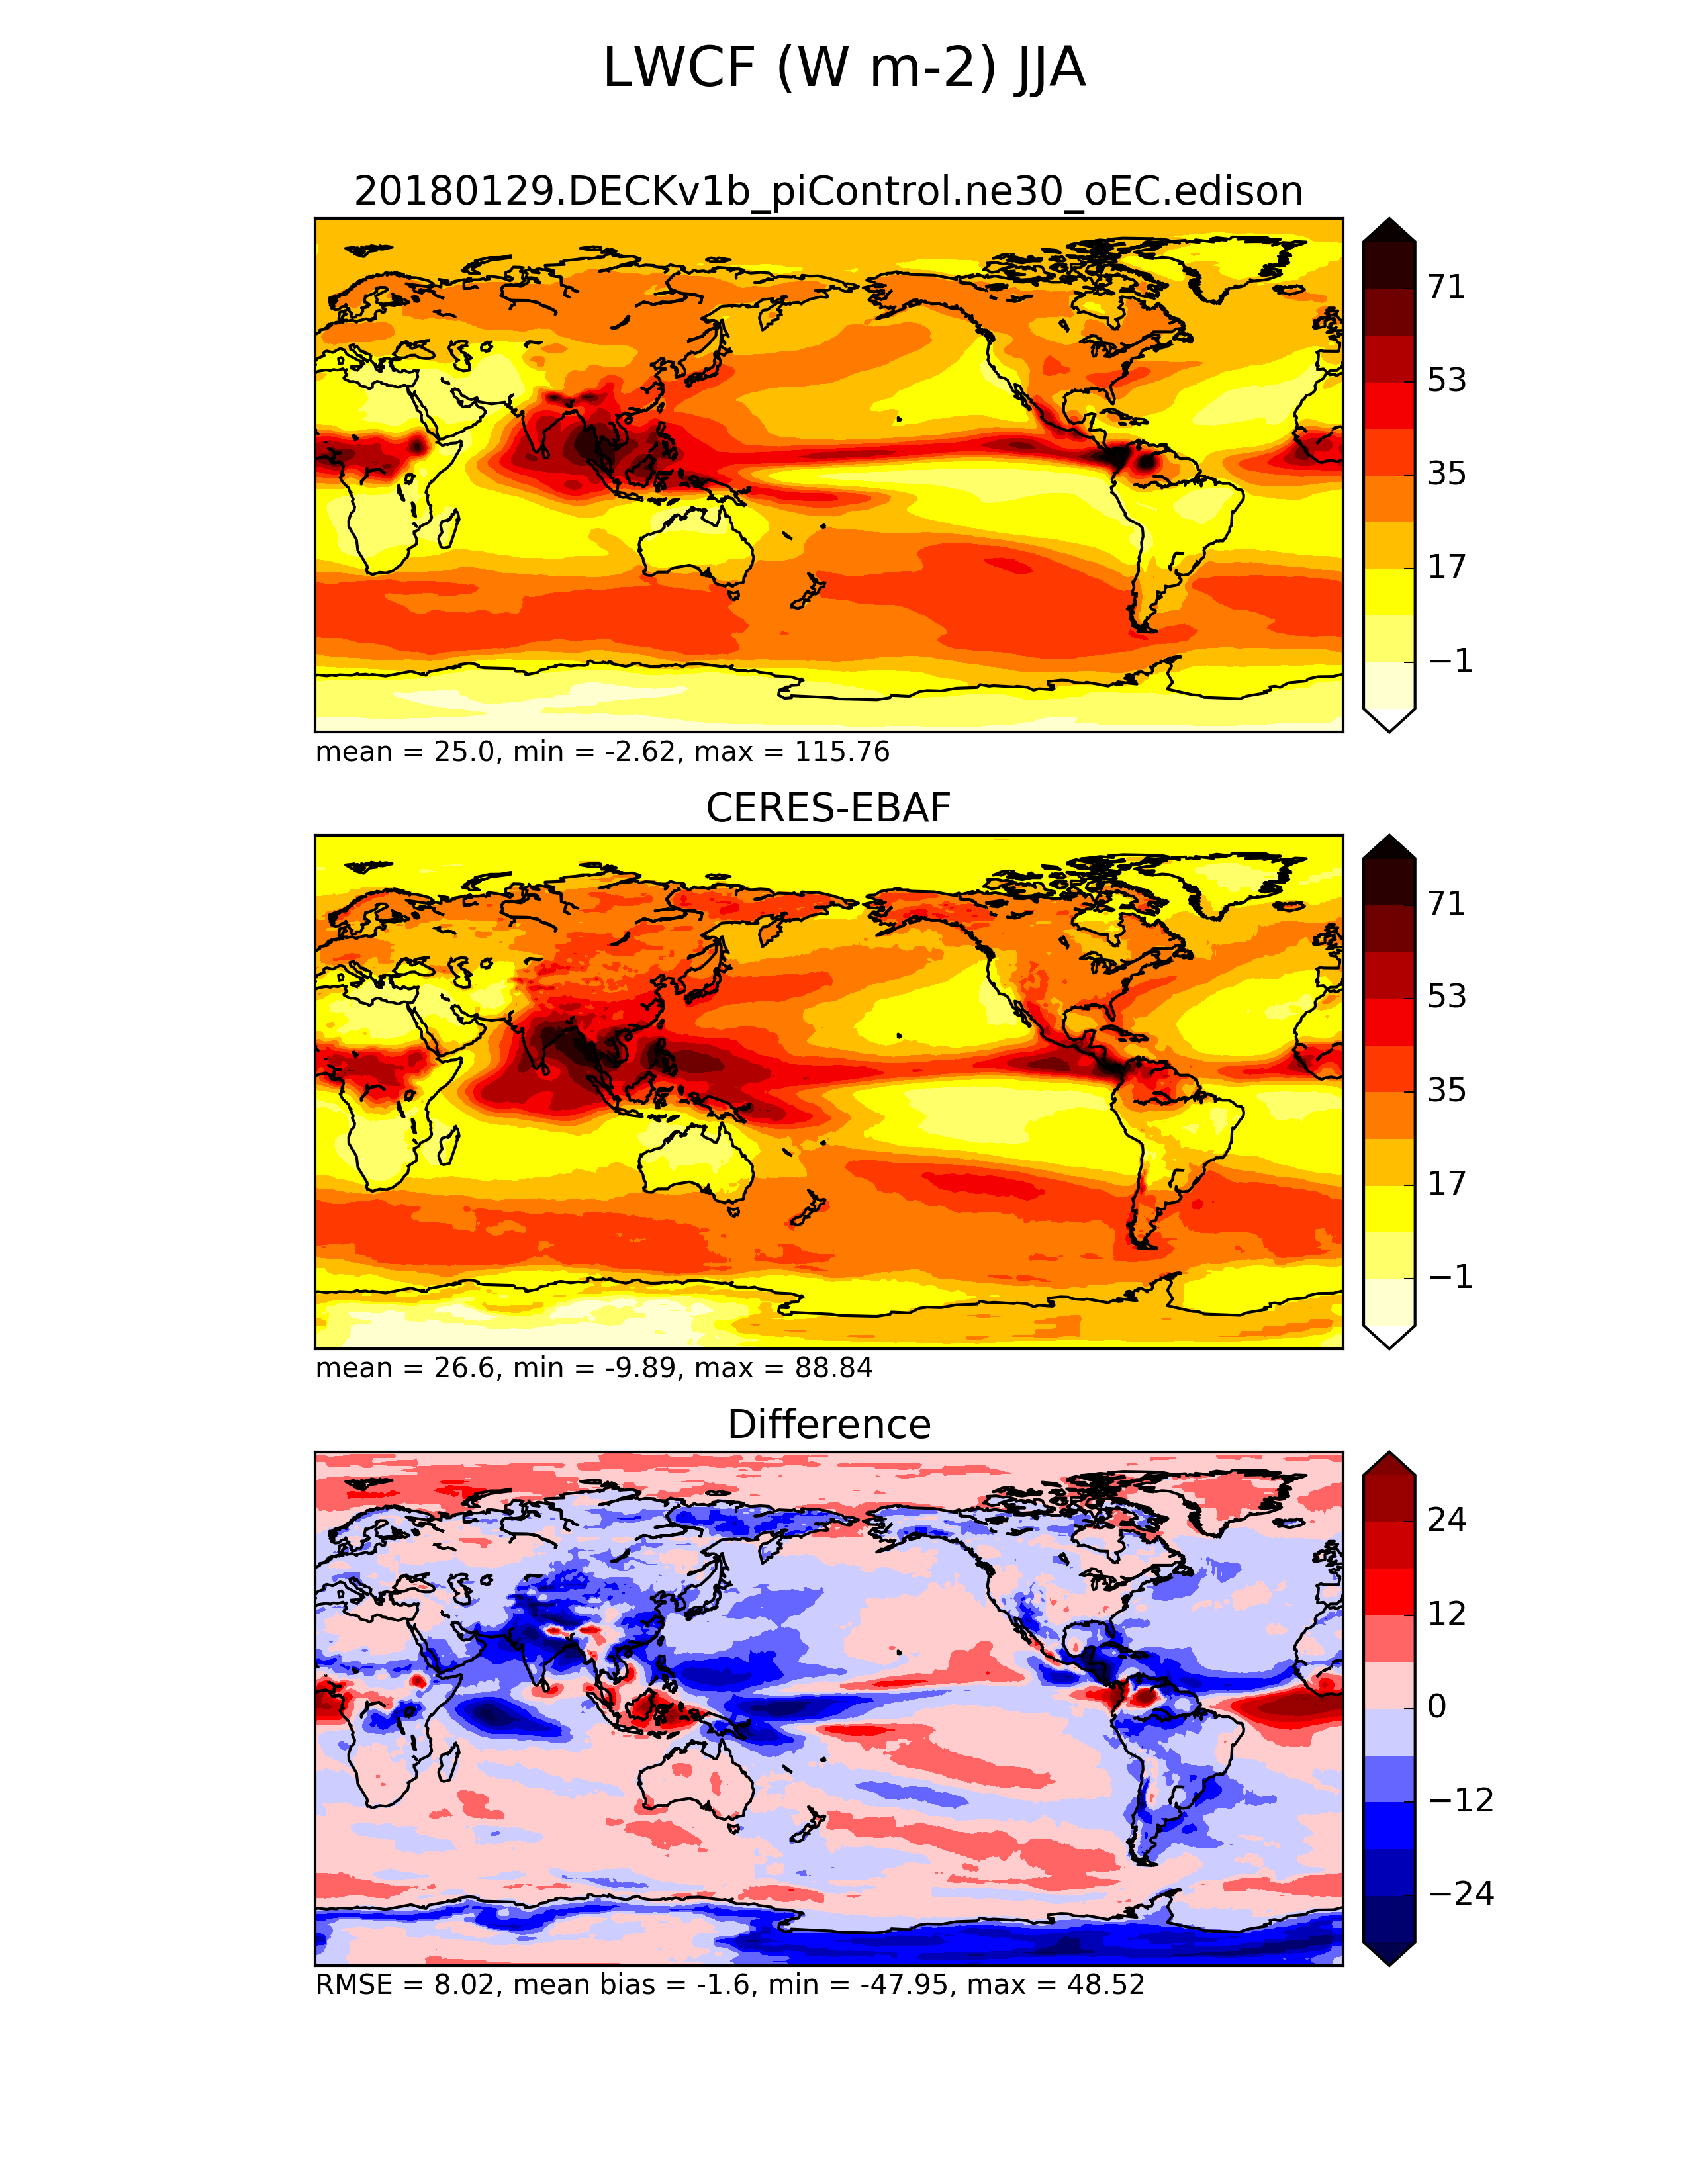
| Radiation (CERES-EBAF)
|
| RESTOM
| TOM Net Radiative Flux
|
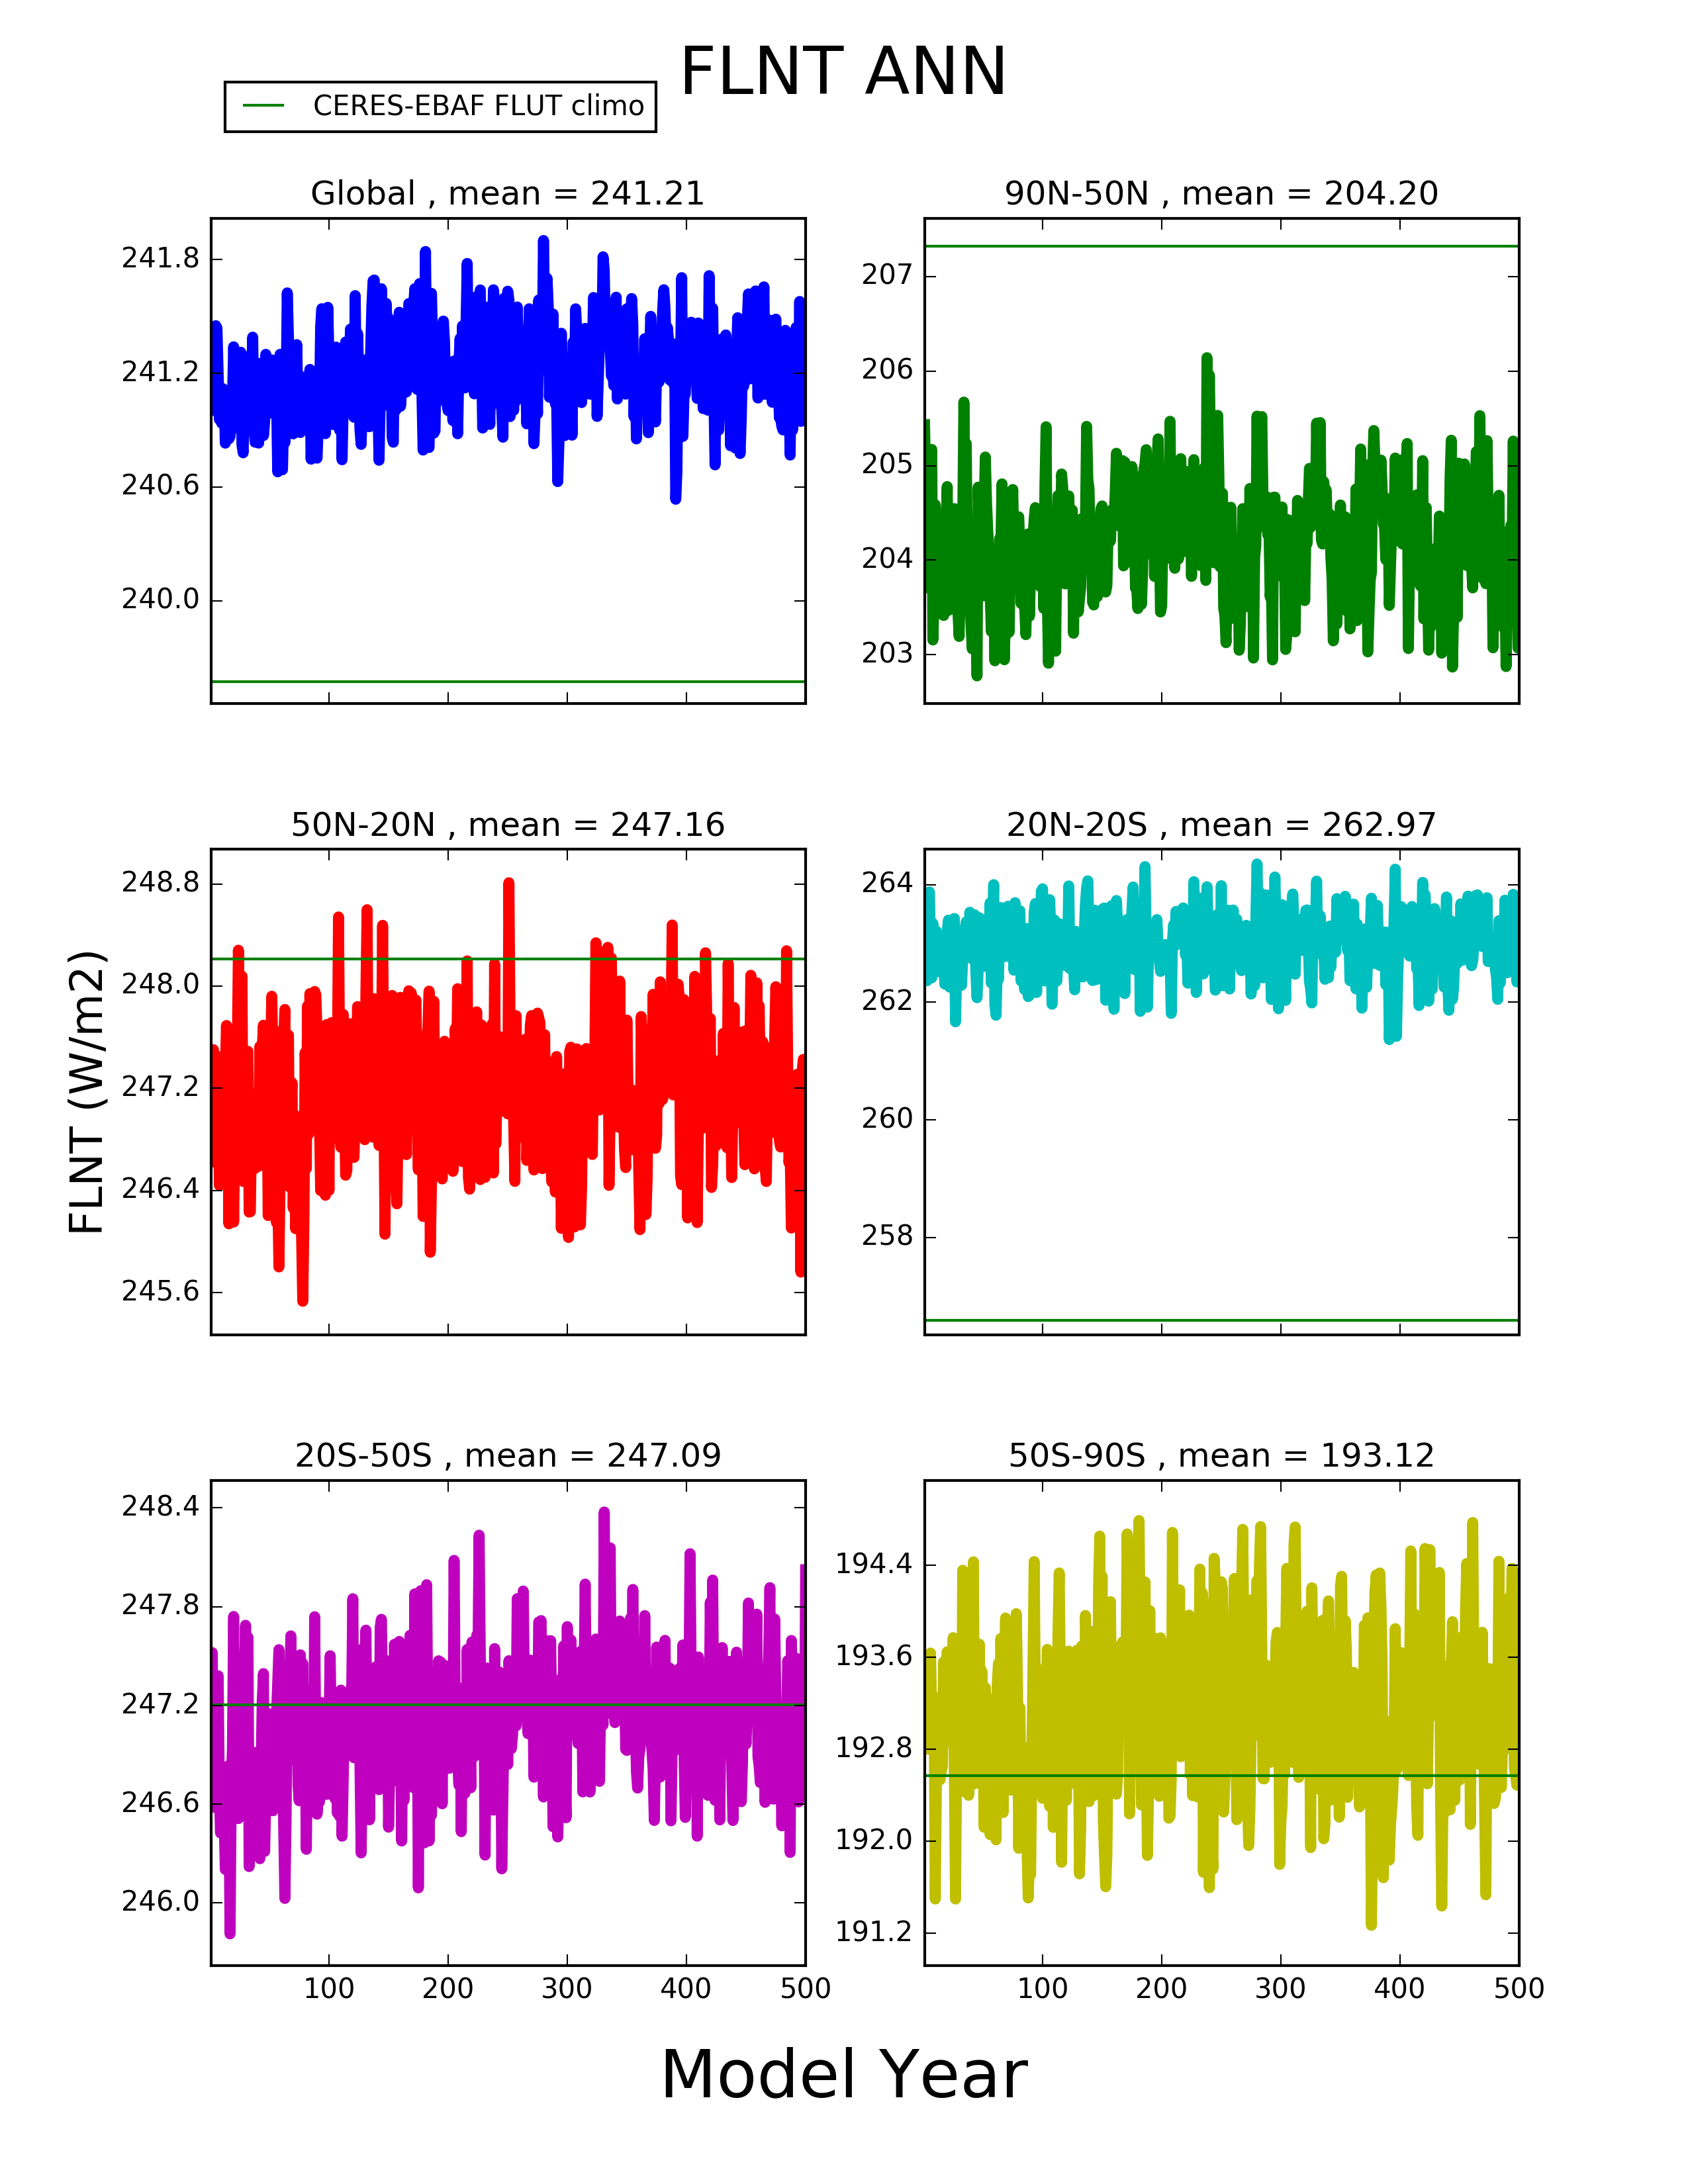
| FLNT
| TOM Net LW Flux
|
| FSNT
| TOM Net SW Flux
|
|
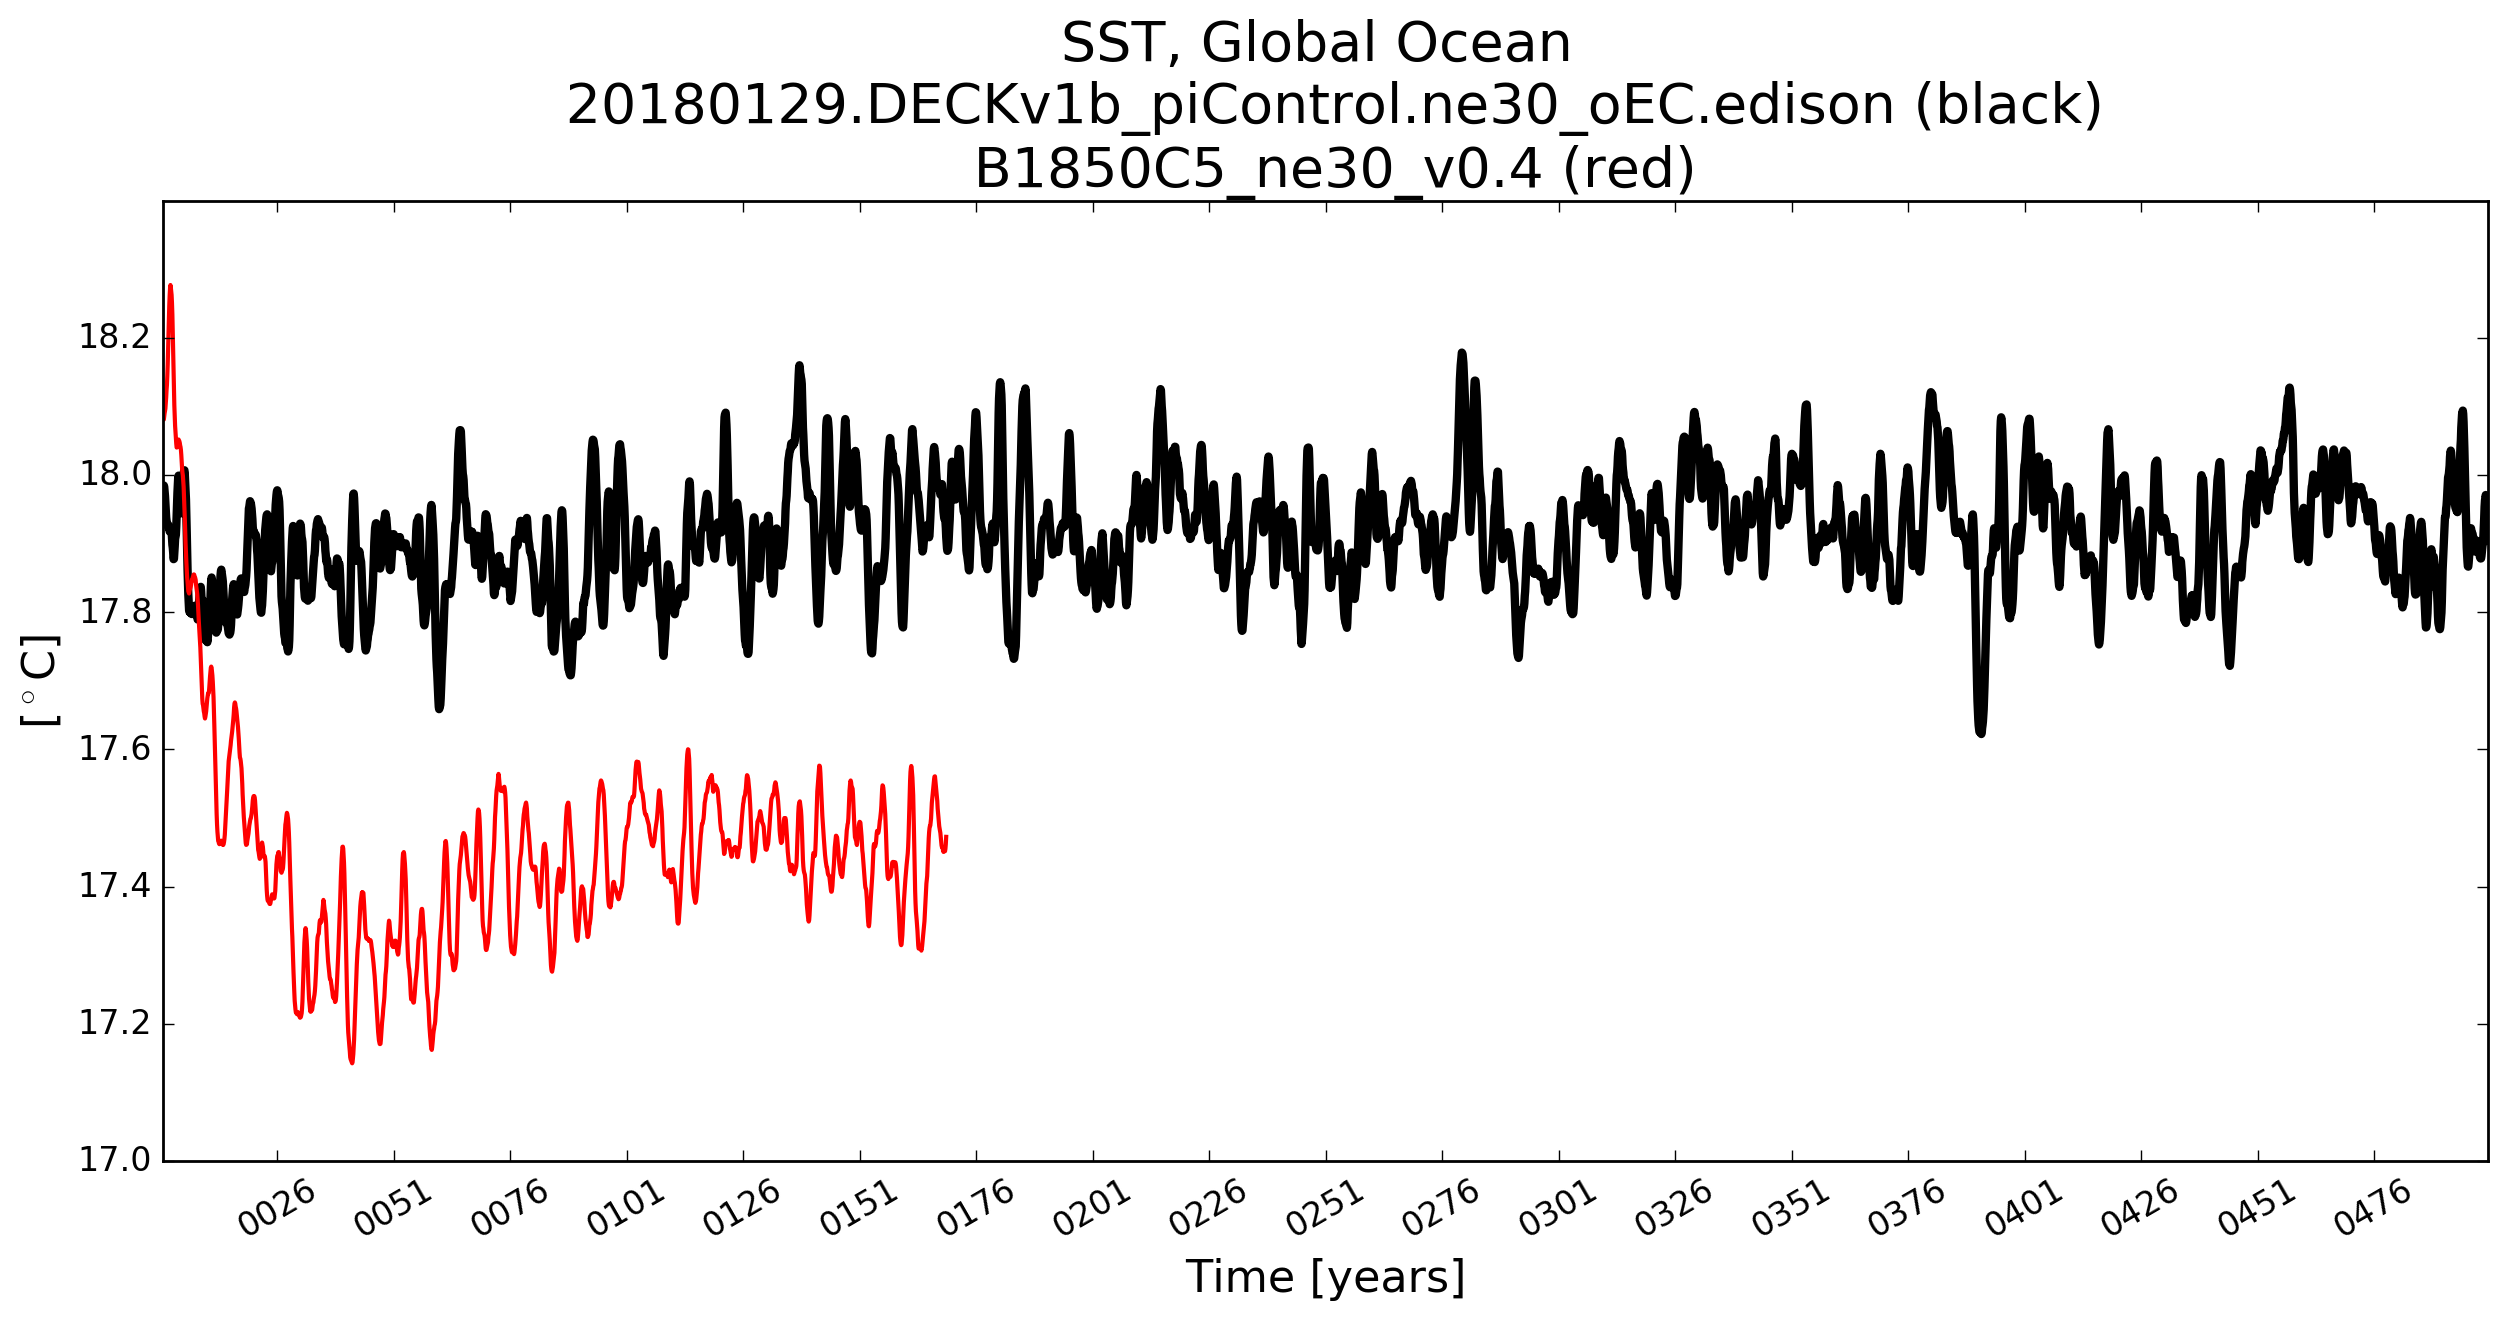
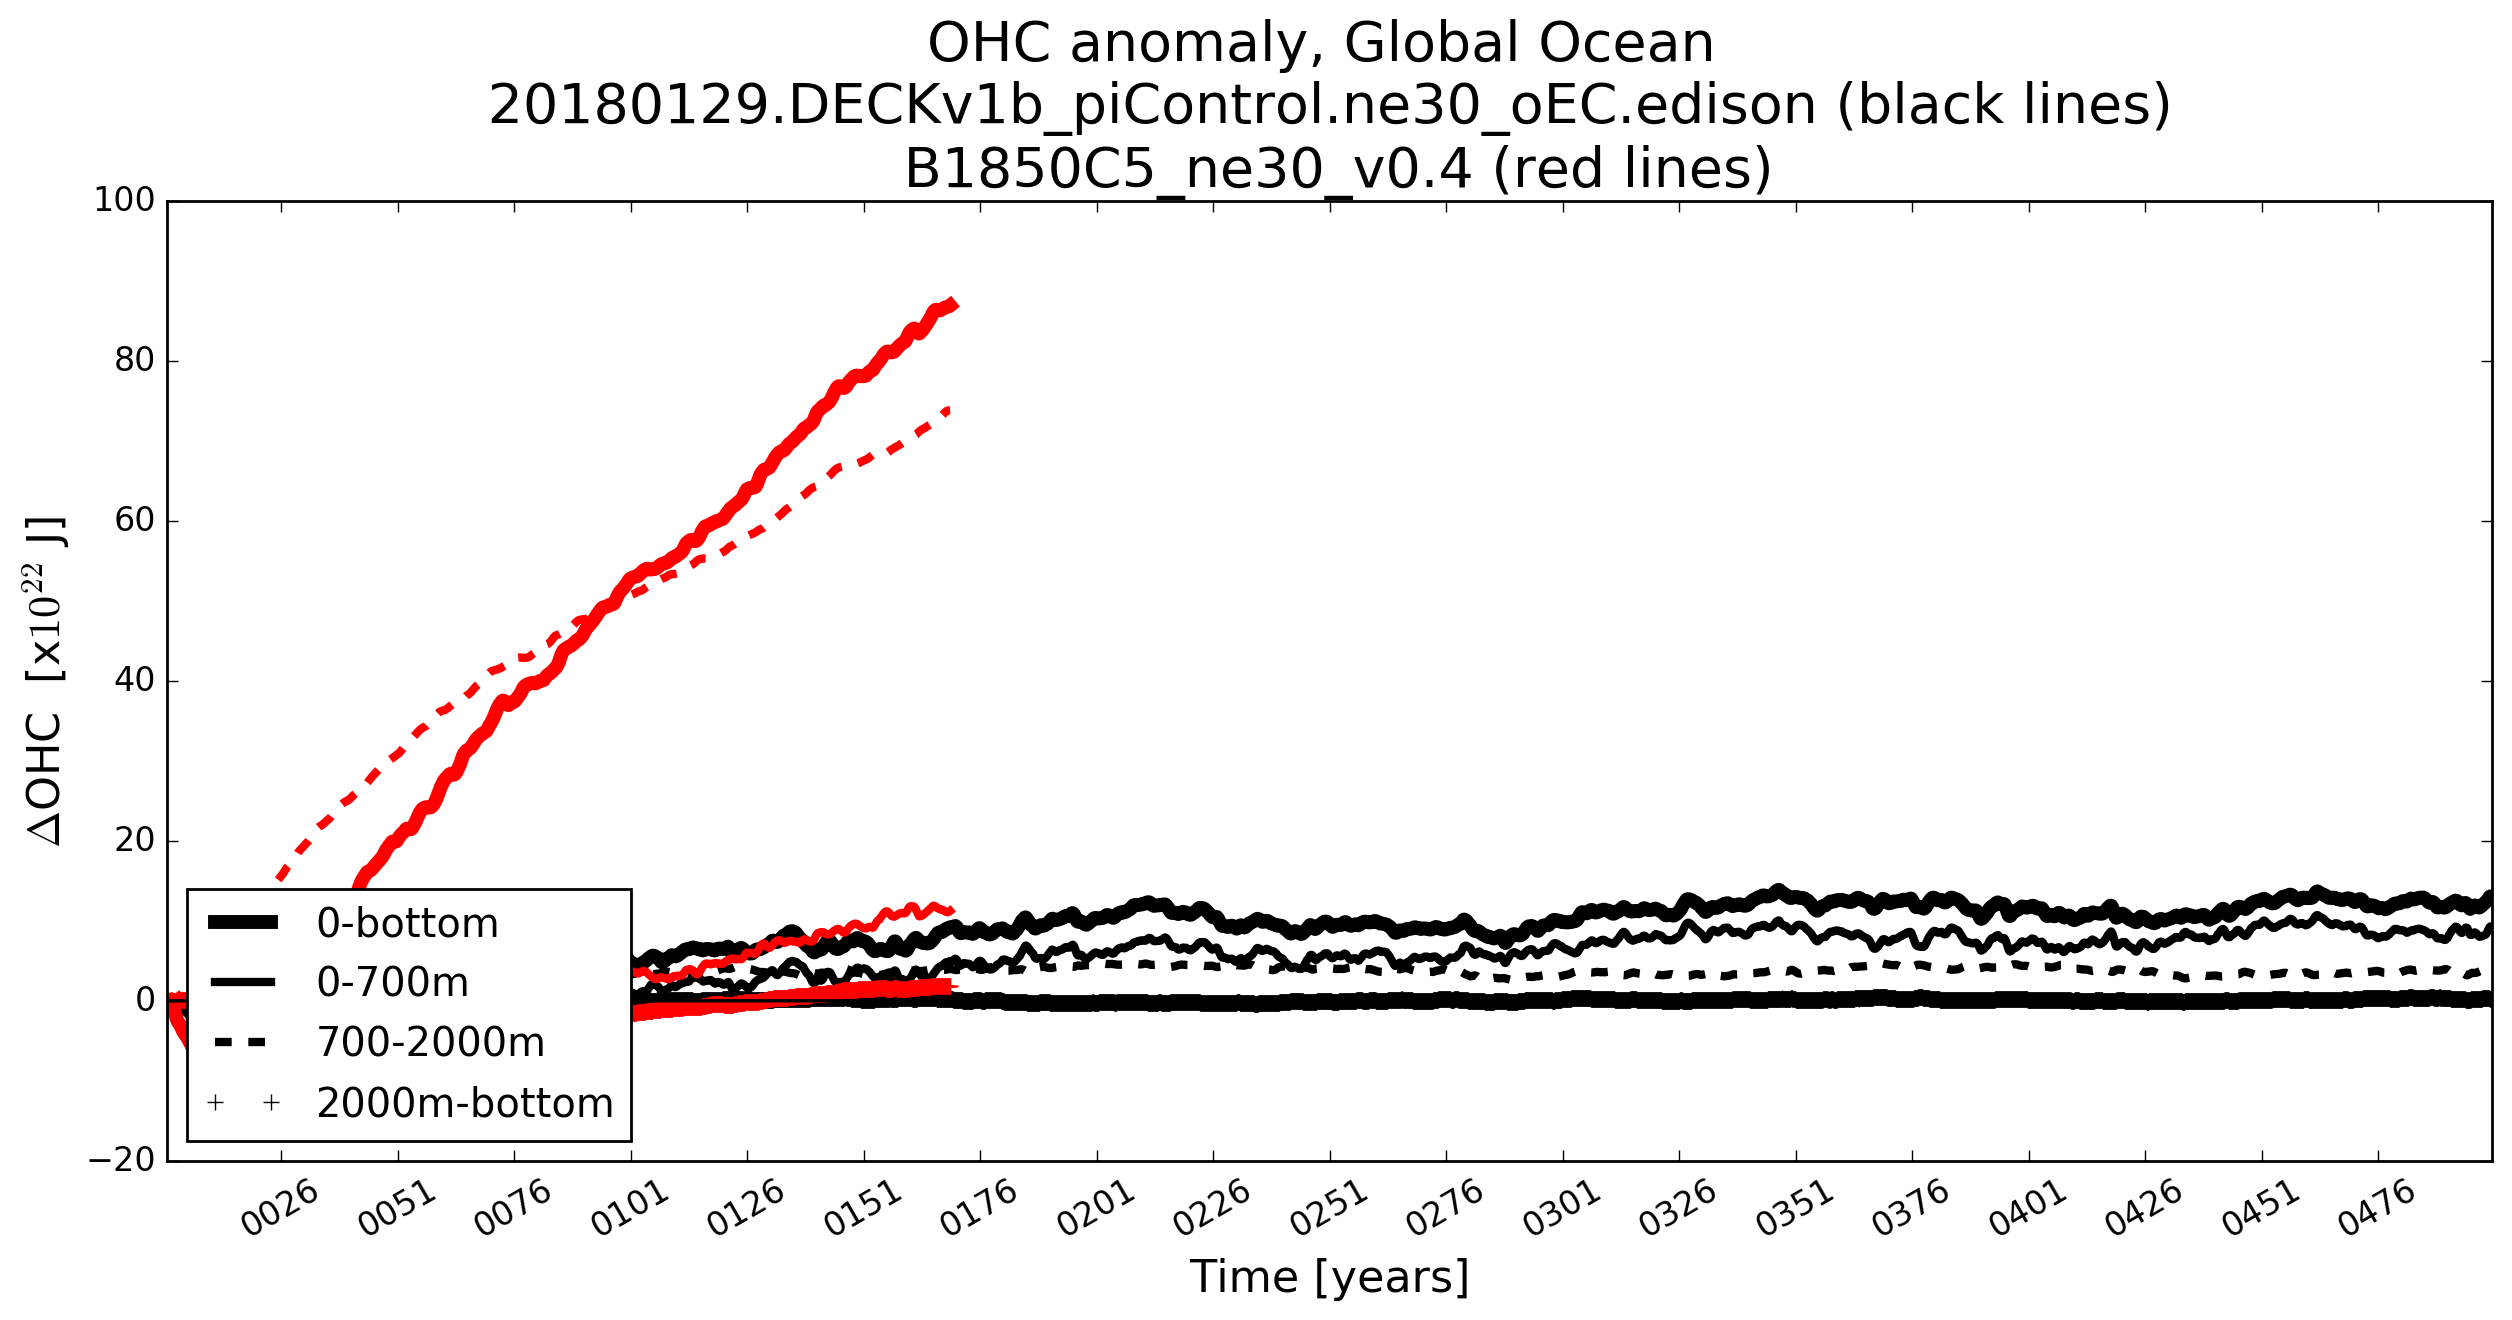
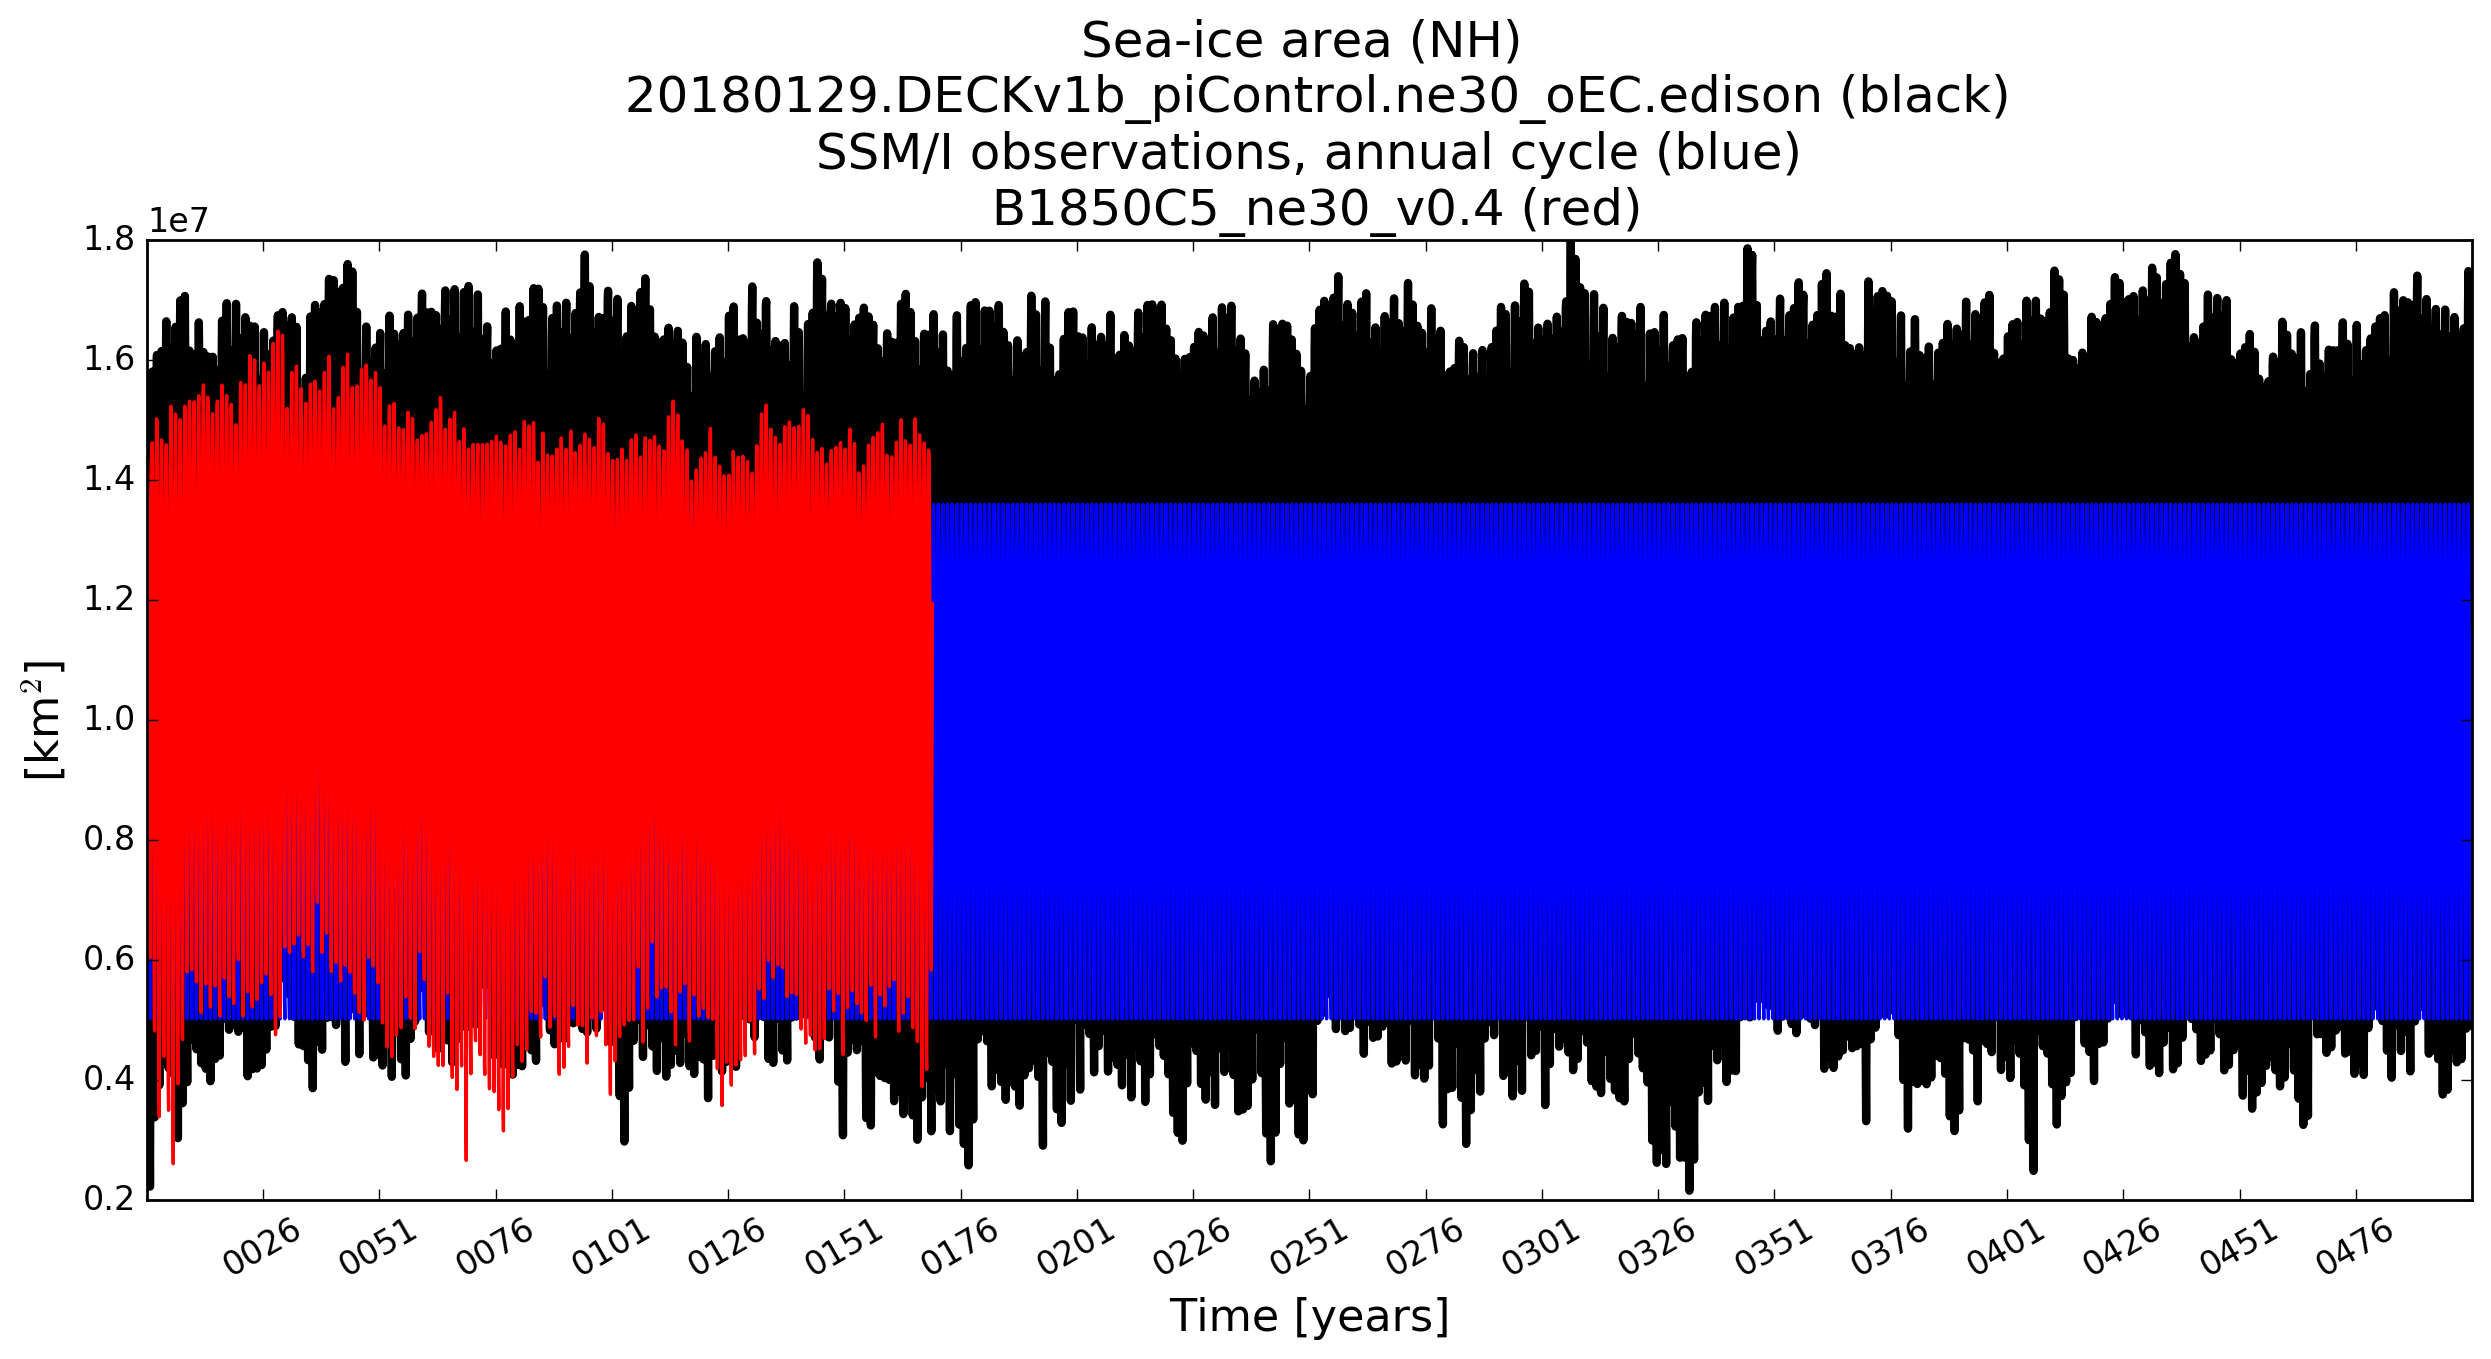
Time Series Plots: Global/Hemispheric means (OCN/ICE)
20180129.DECKv1b_piControl.ne30_oEC.edison (Years: 1-500)
Climatology Plots (ATM)
20180129.DECKv1b_piControl.ne30_oEC.edison (Years: 451-500)
obs (climo)
Climatology Plots (OCN/ICE)
20180129.DECKv1b_piControl.ne30_oEC.edison (Years: 451-500)
obs (climo)
| Global Ocean
|
| SST Hadley-NOAA-OI
| JFM
| JAS
| ANN
|
| SST
|
| plot
| plot
| plot
|
| SSS Aquarius
| JFM
| JAS
| ANN
|
| SSS
|
| plot
| plot
| plot
|
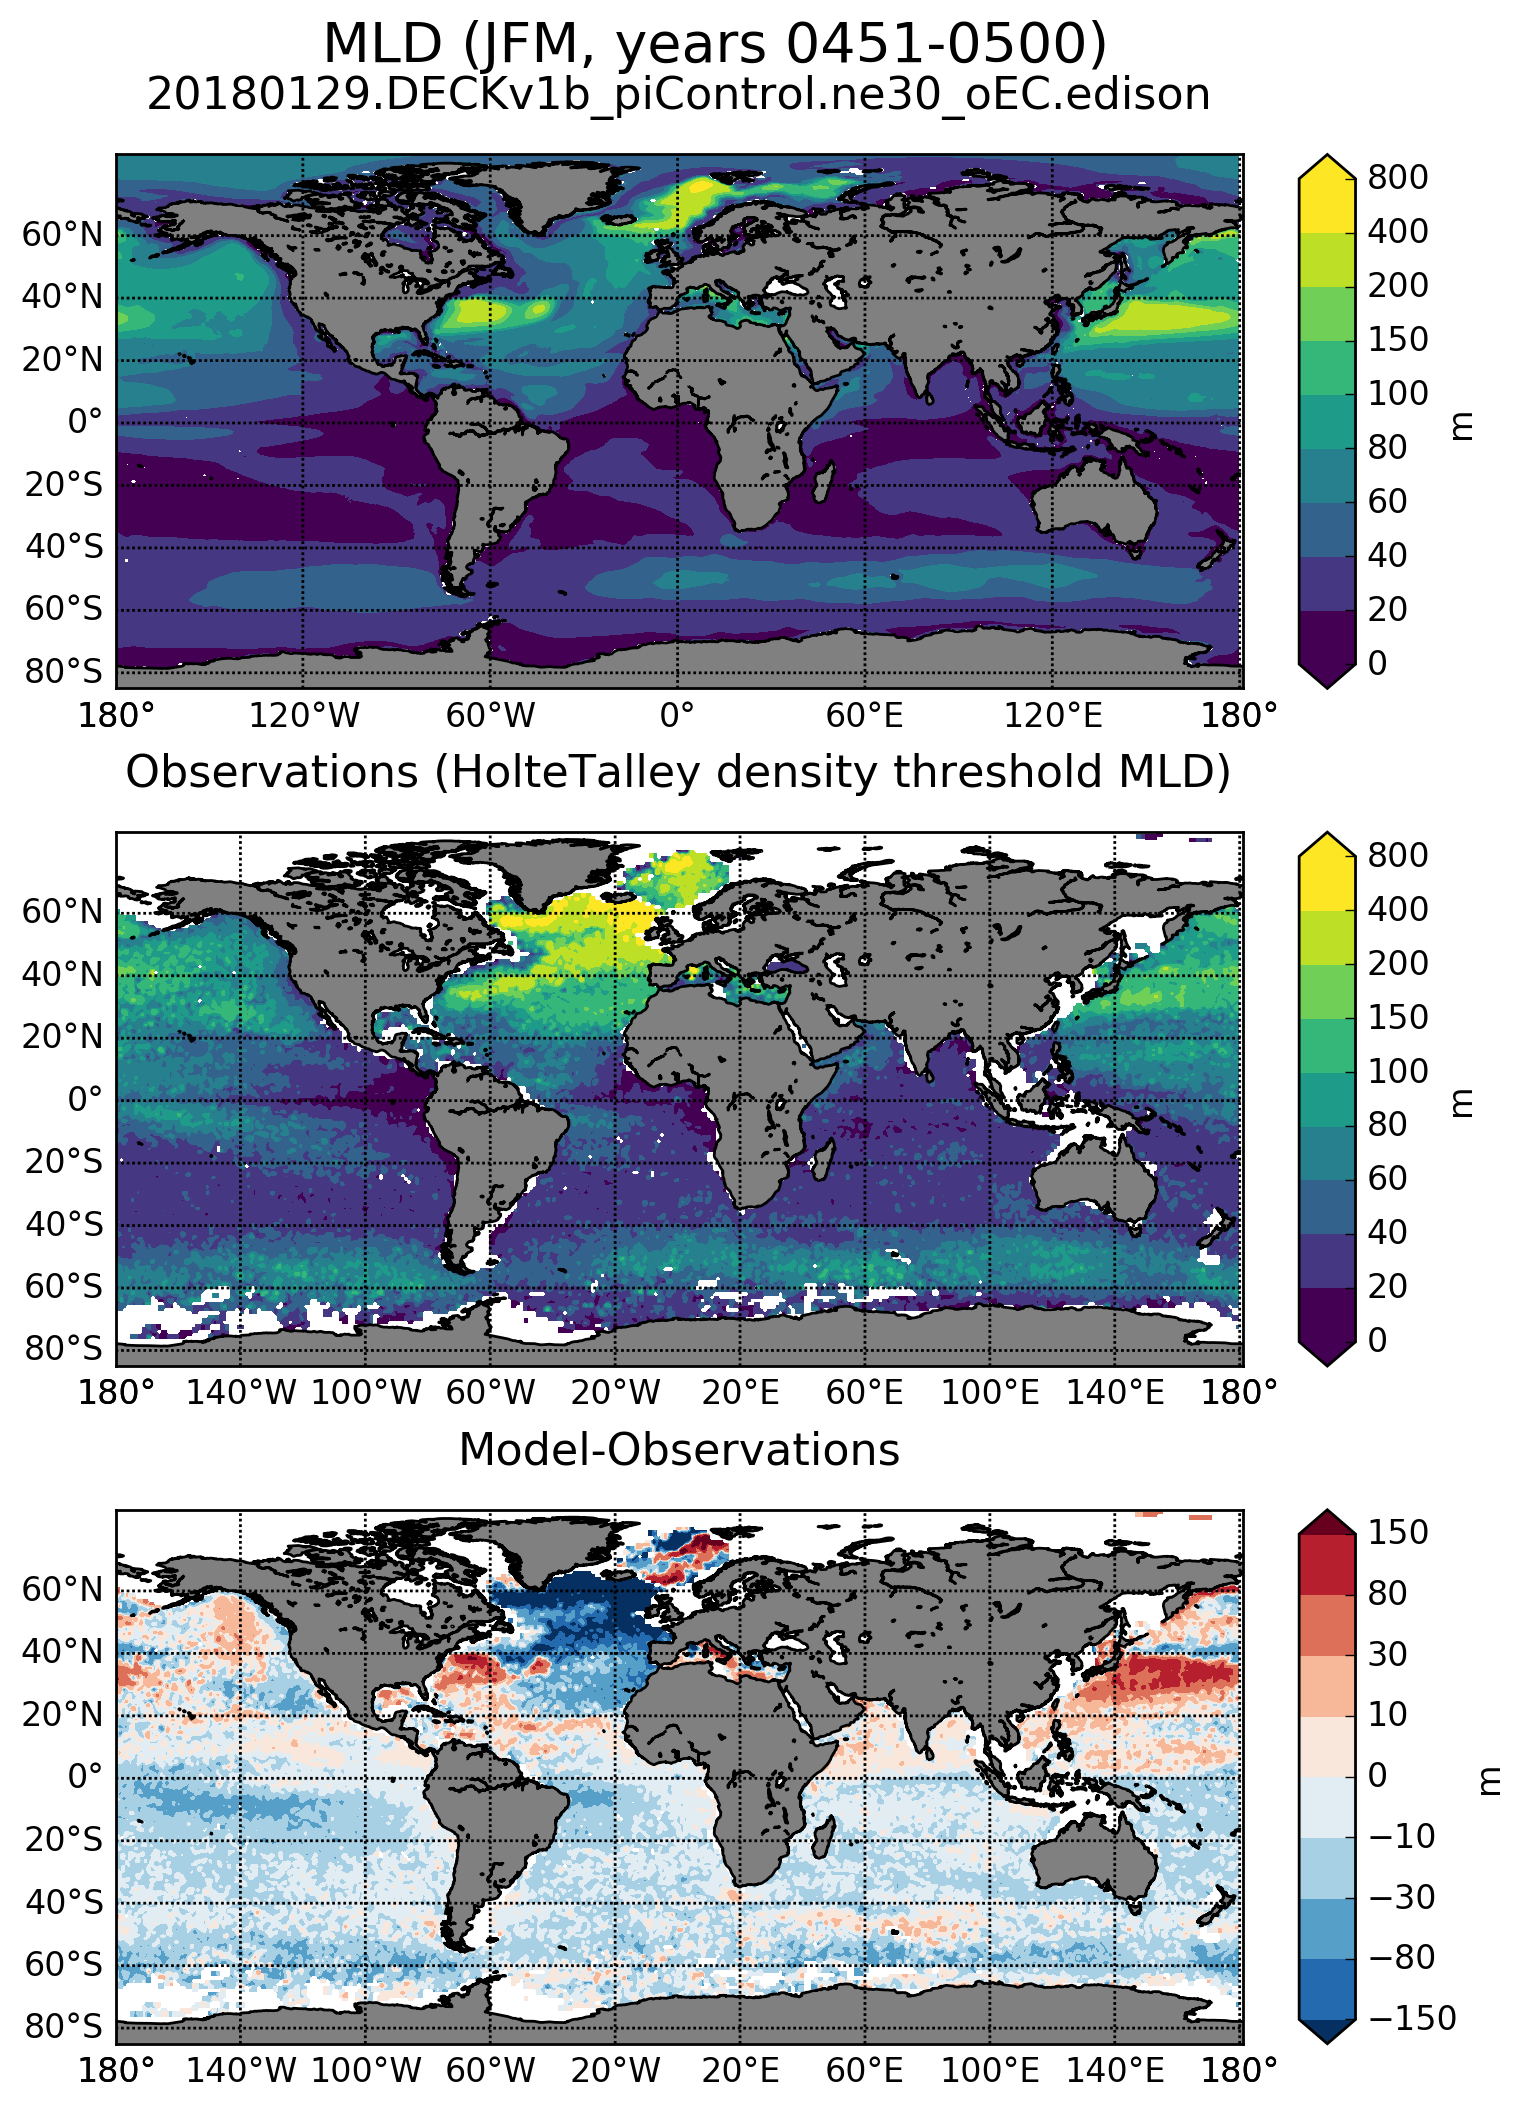
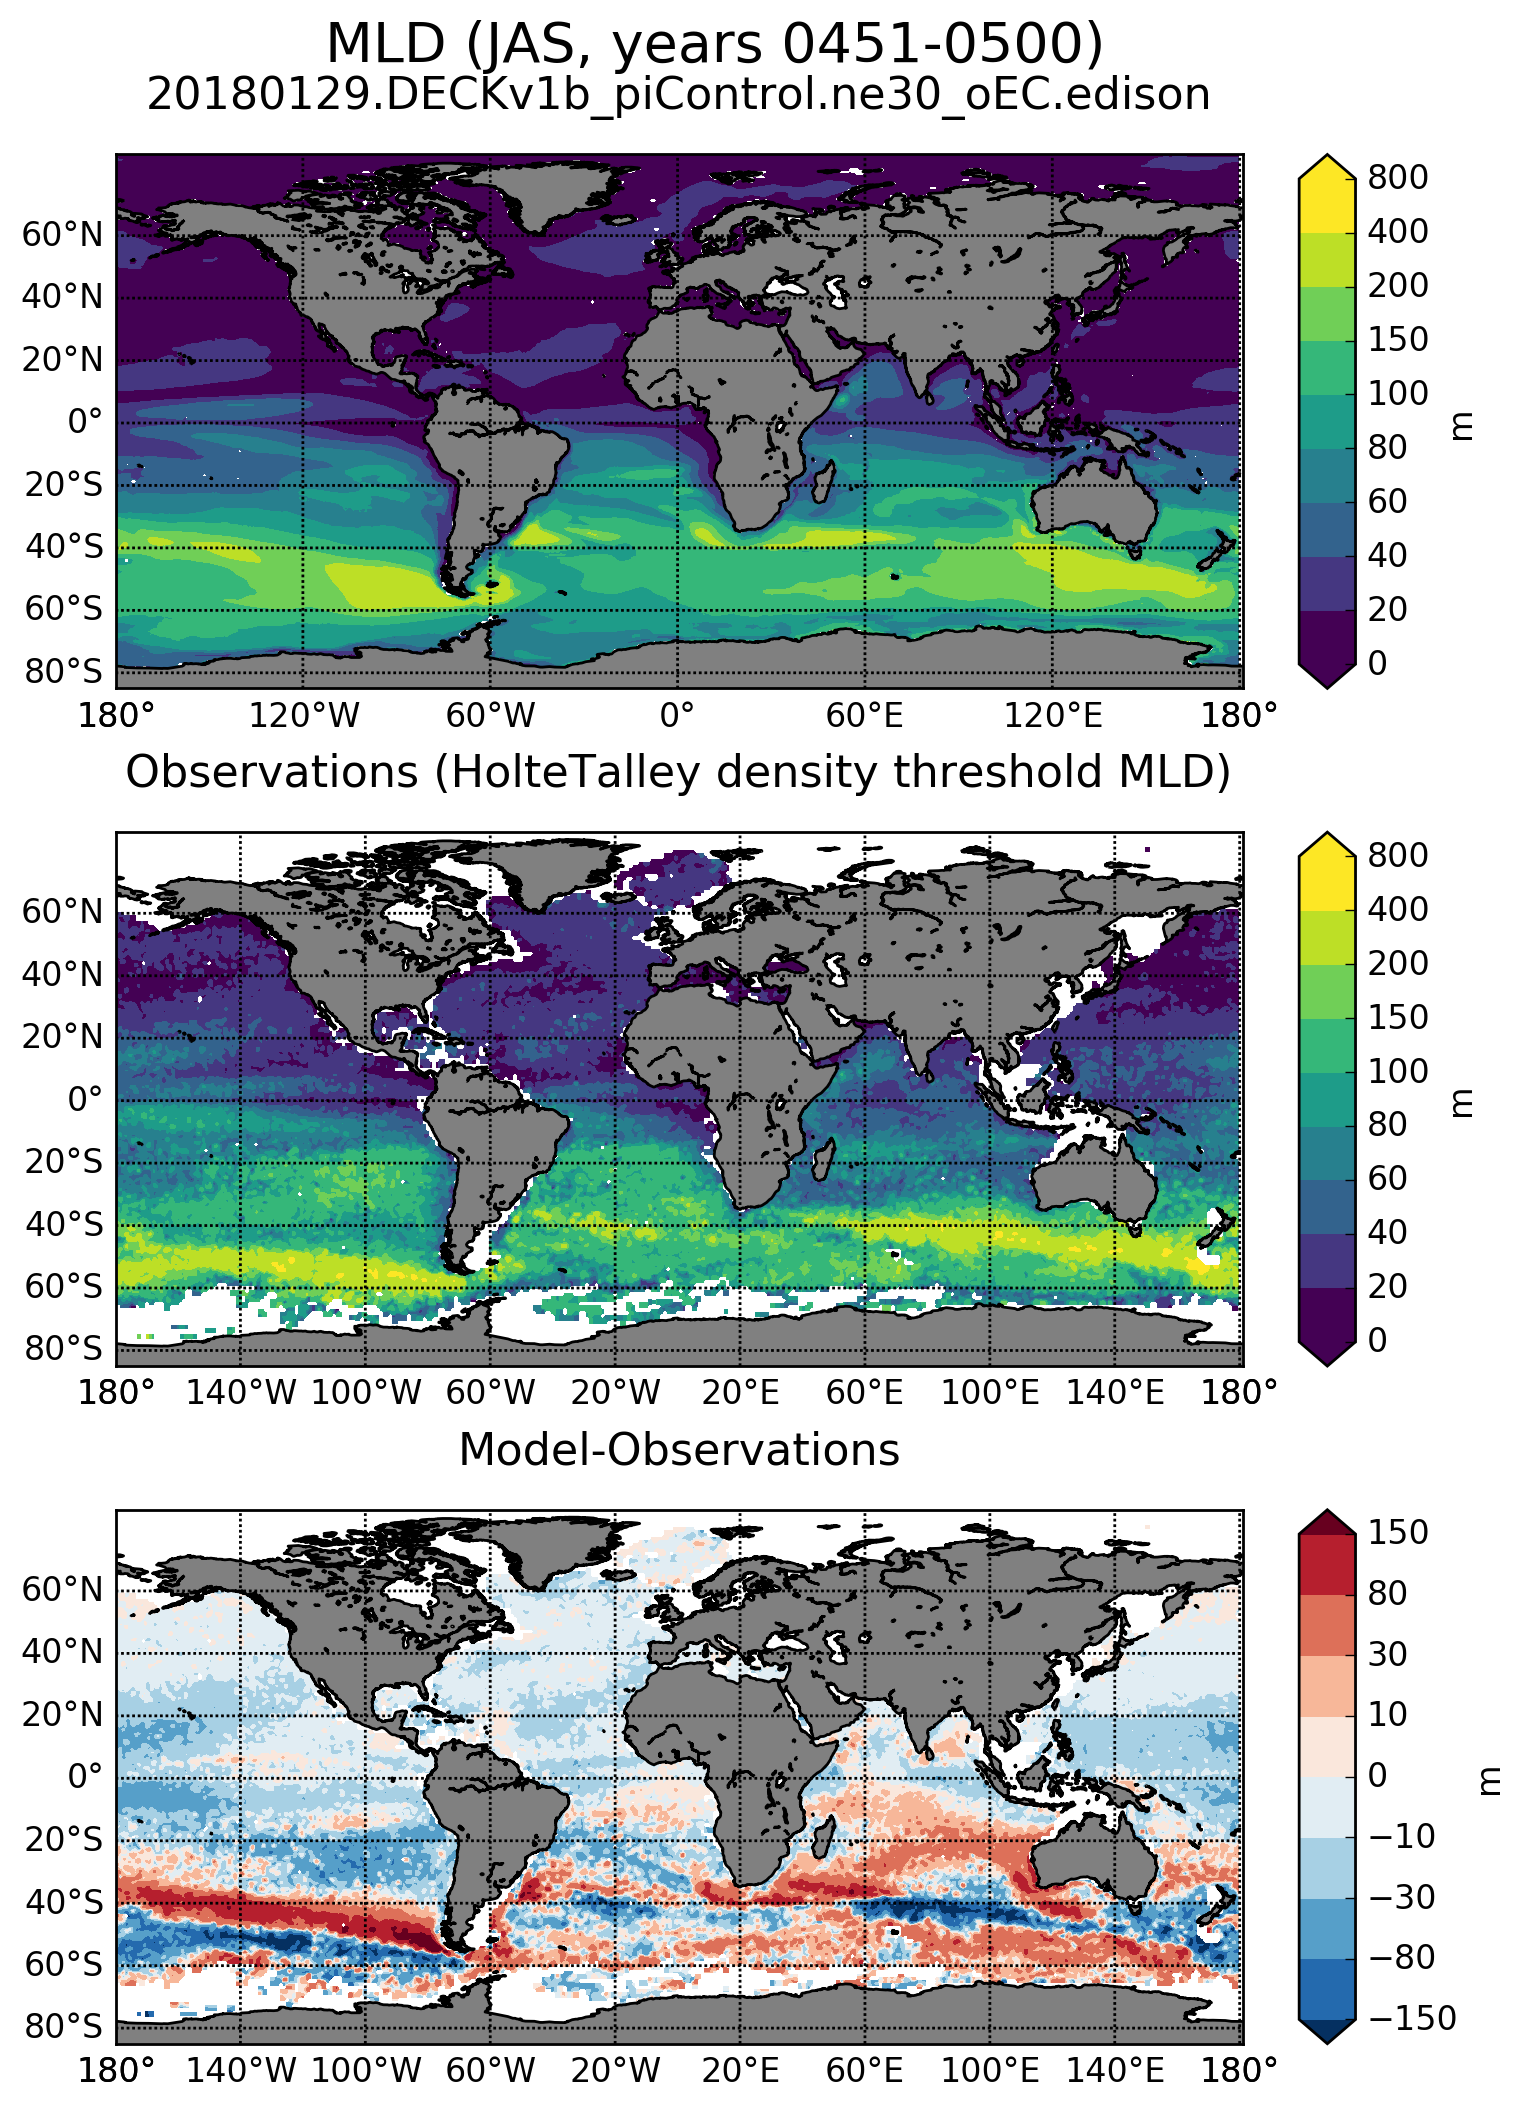
| MLD Holte-Talley ARGO
| JFM
| JAS
| ANN
|
| MLD
|
| plot
| plot
| plot
|
|
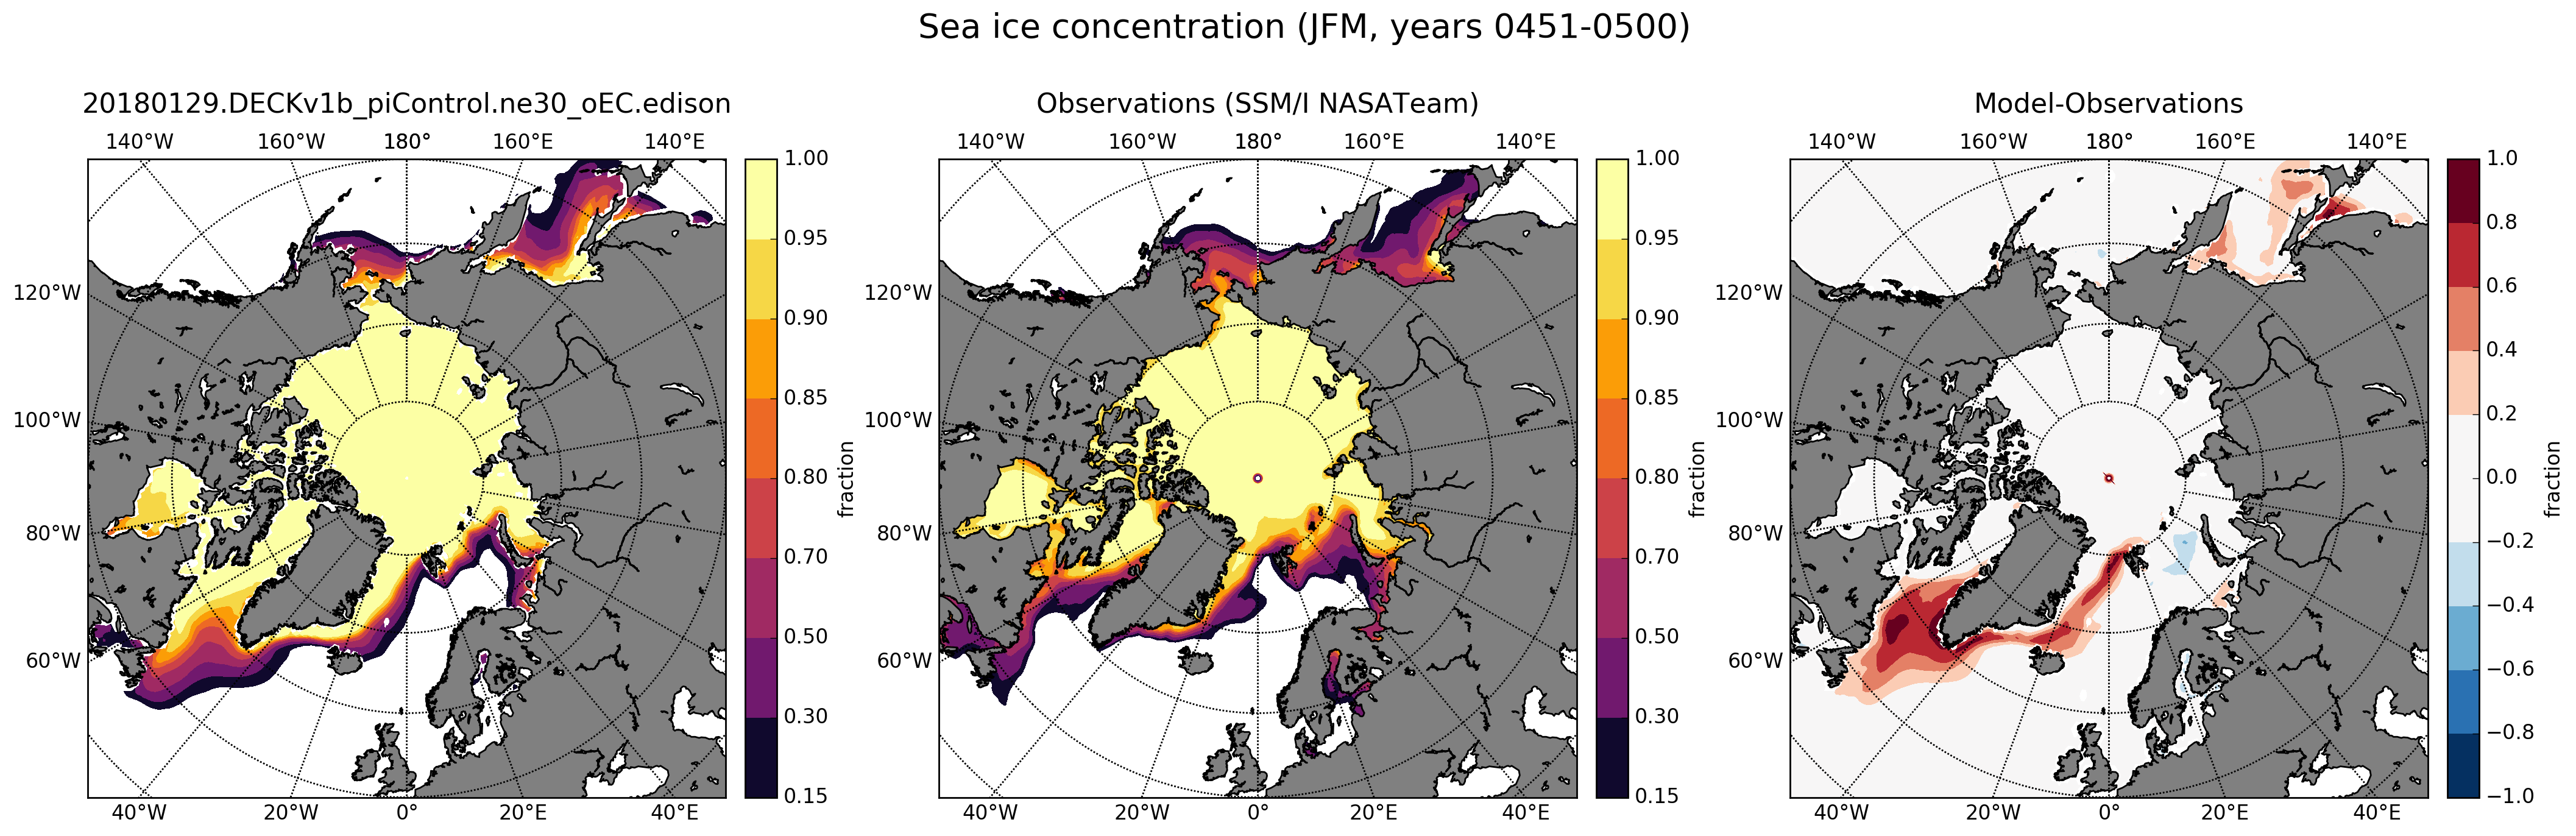
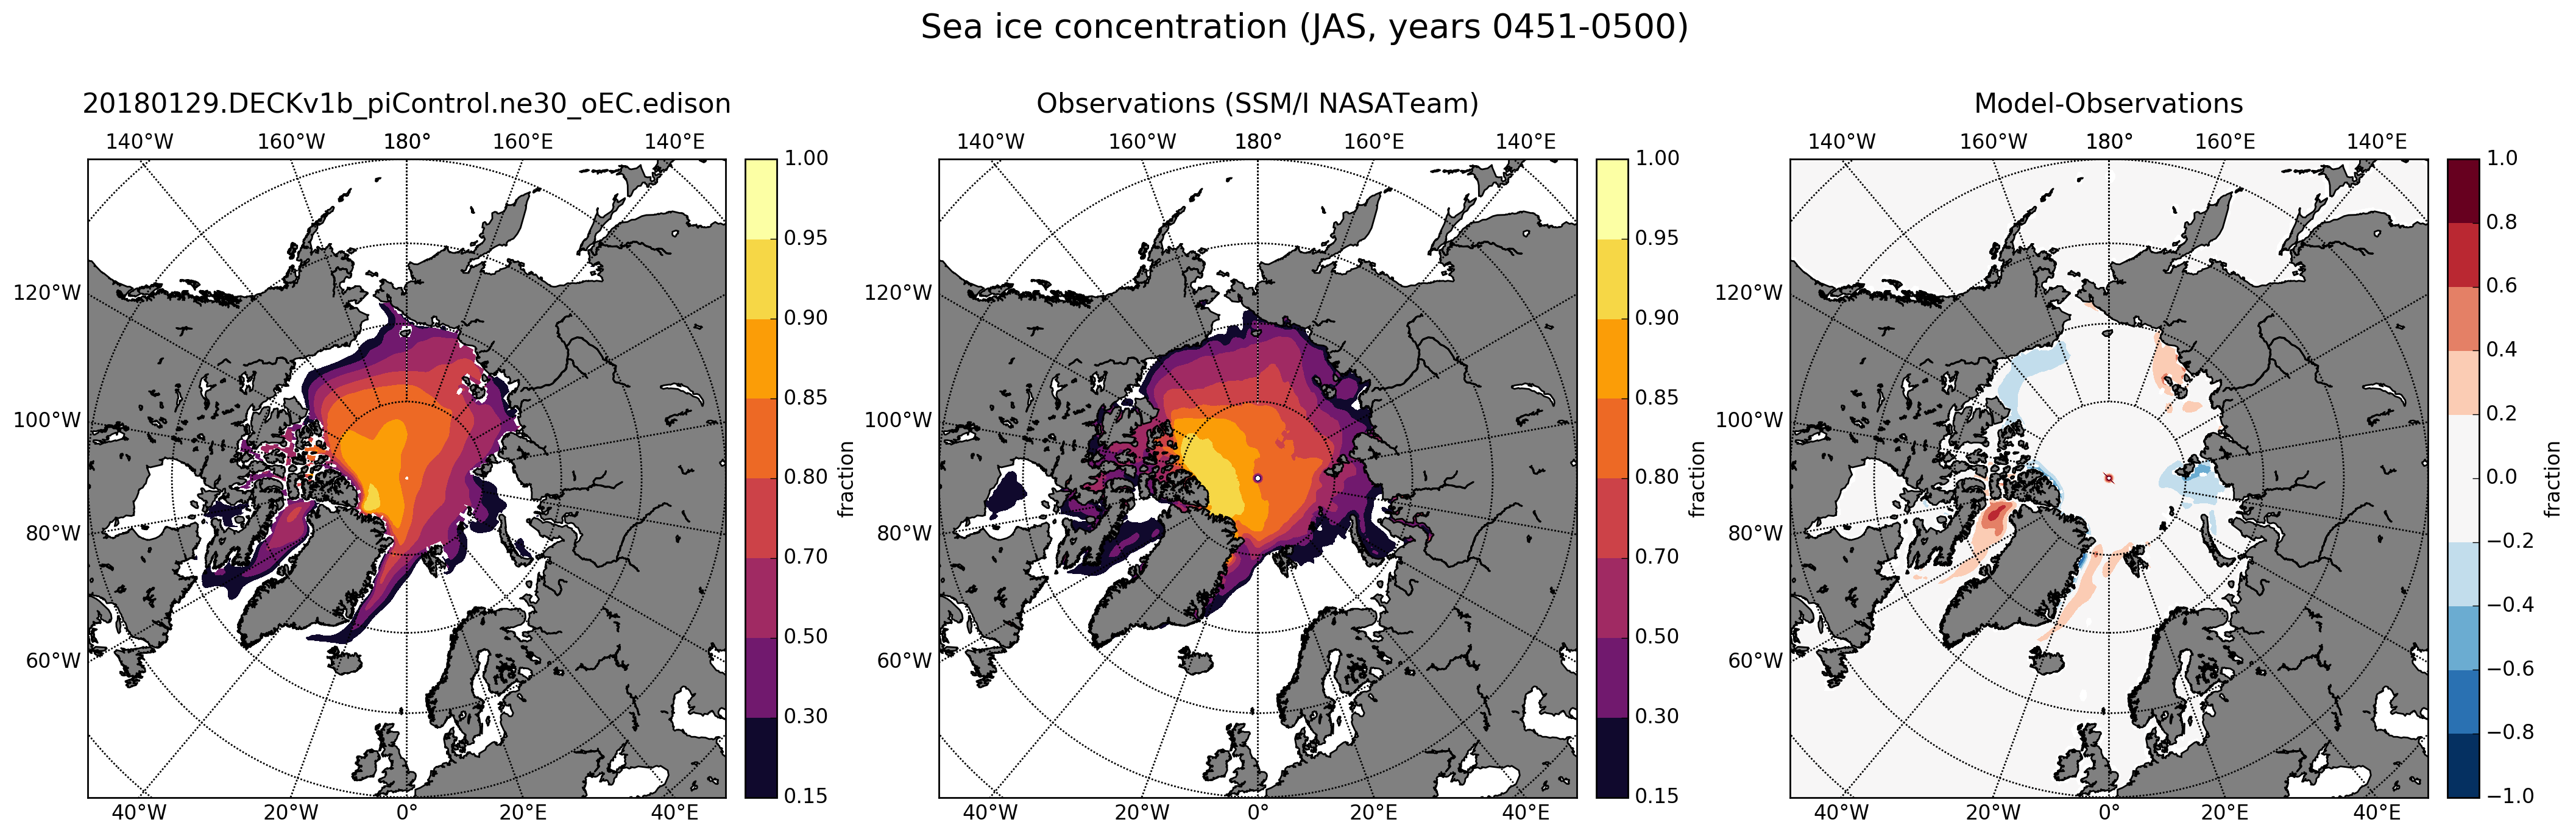
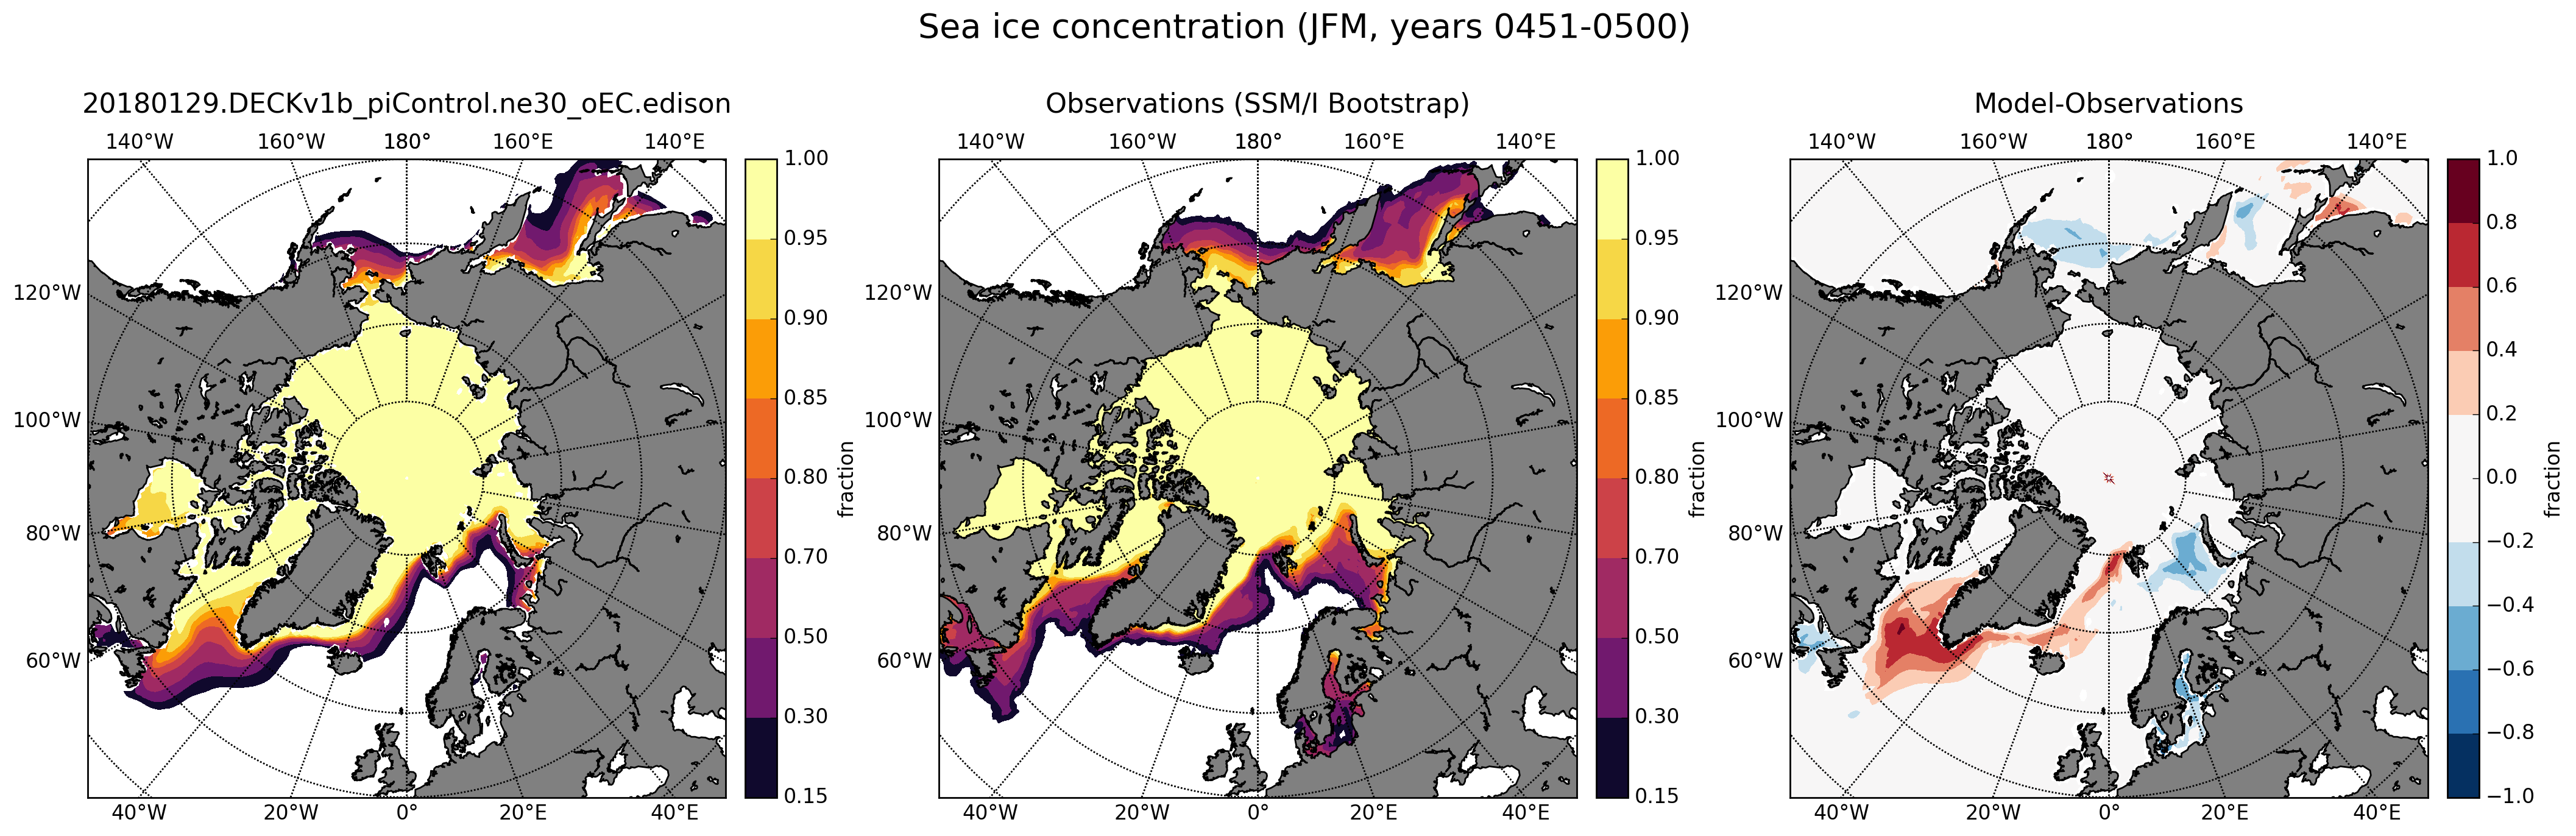
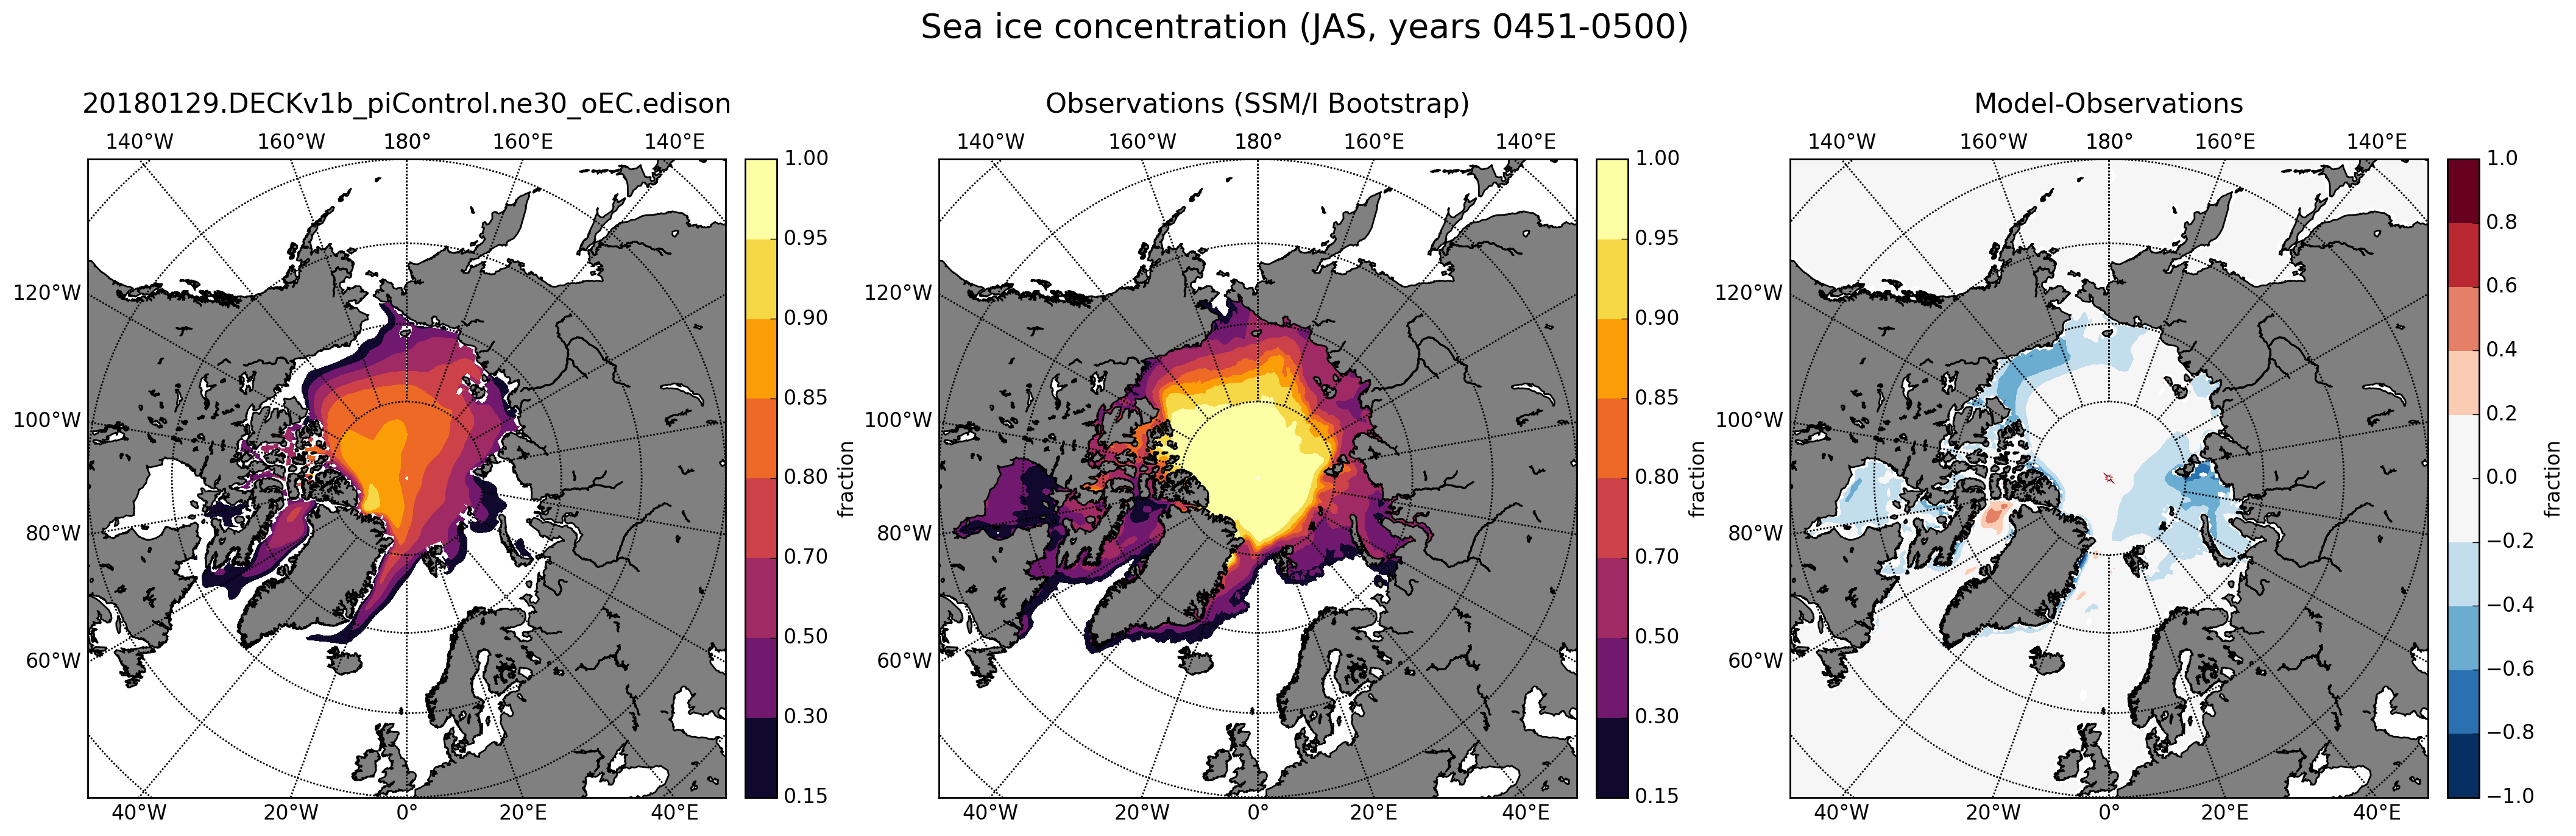
| Northern Hemisphere Sea-ice
|
| SSM/I NASATeam
| JFM
| JAS
|
| Ice Conc.
| Ice concentration
| plot
| plot
|
| SSM/I Bootstrap
| JFM
| JAS
|
| Ice Conc.
| Ice concentration
| plot
| plot
|
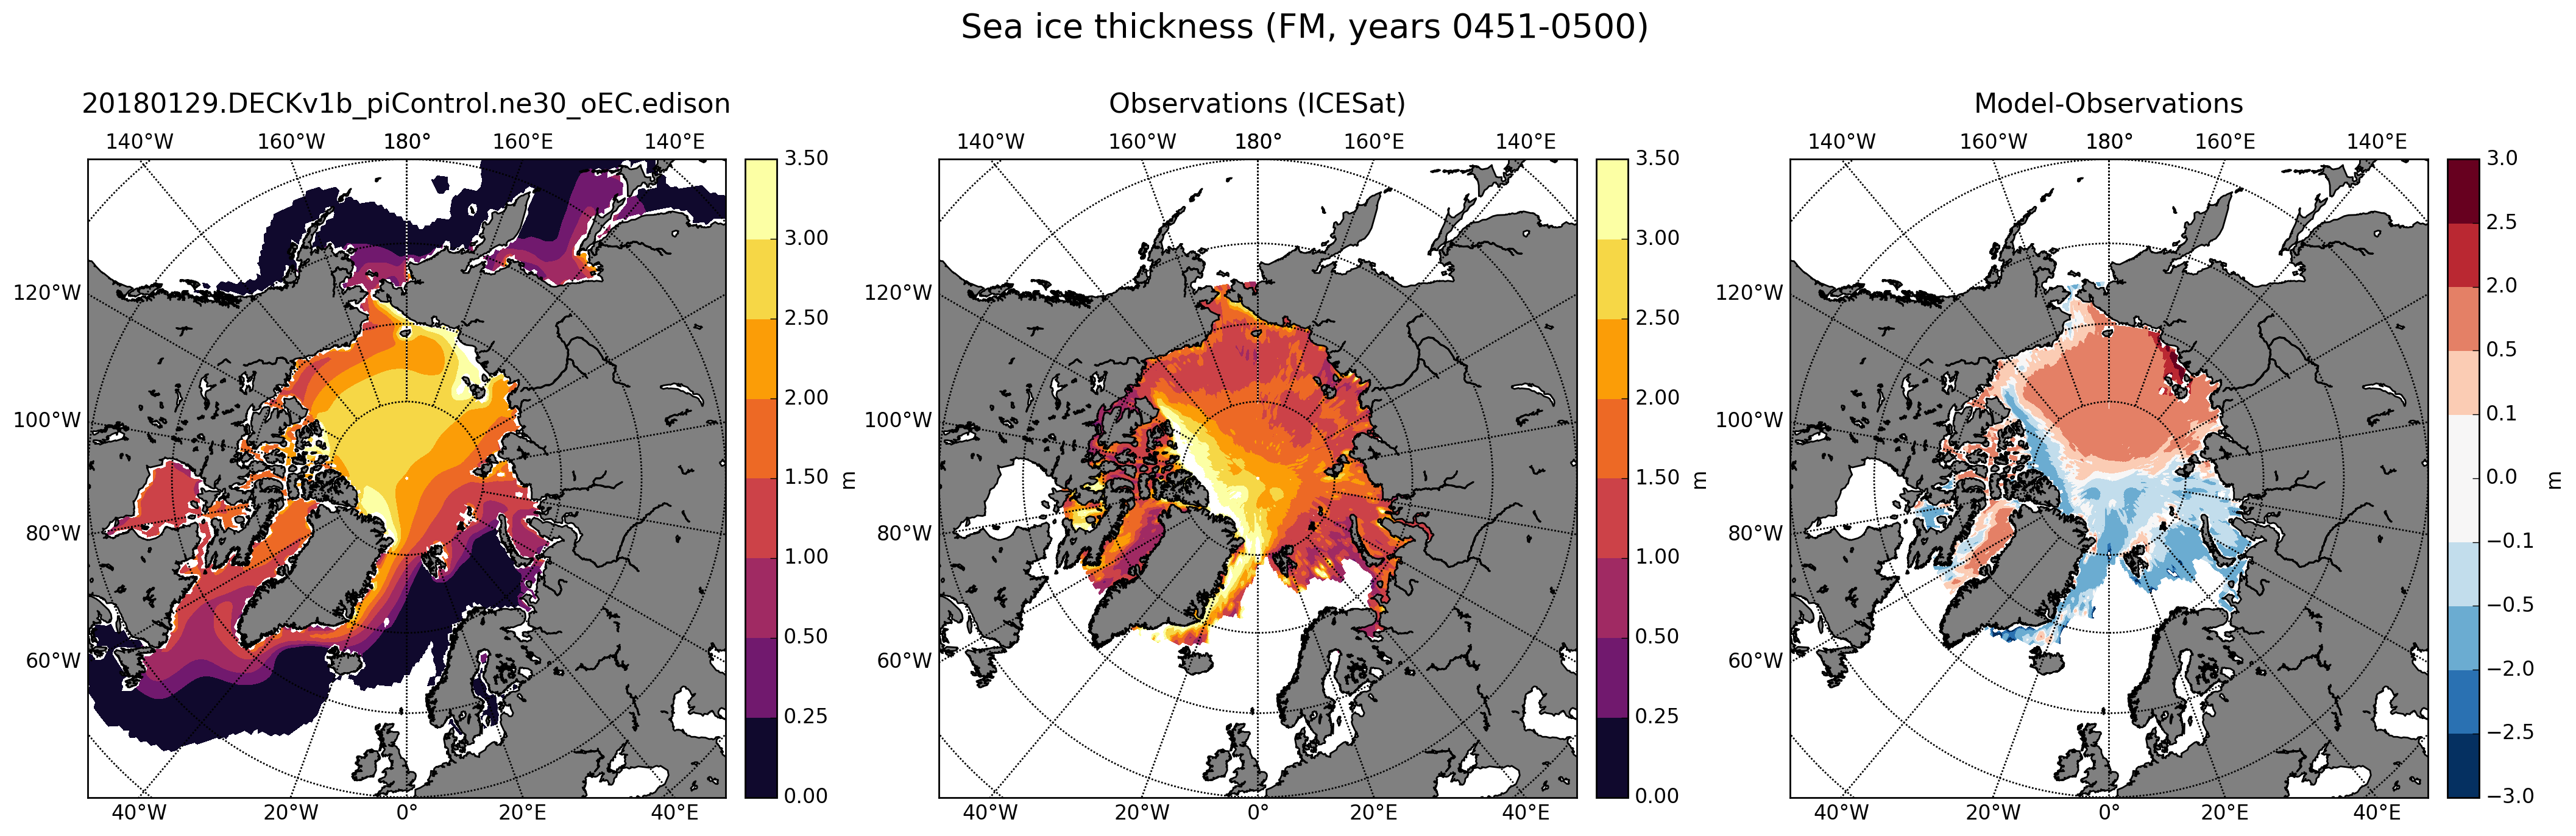
| ICESat
| FM
| ON
|
| Ice Thick.
| Ice Thickness
| plot
| plot
|
|
| Southern Hemisphere Sea-ice
|
| SSM/I NASATeam
| DJF
| JJA
|
| Ice Conc.
| Ice concentration
| plot
| plot
|
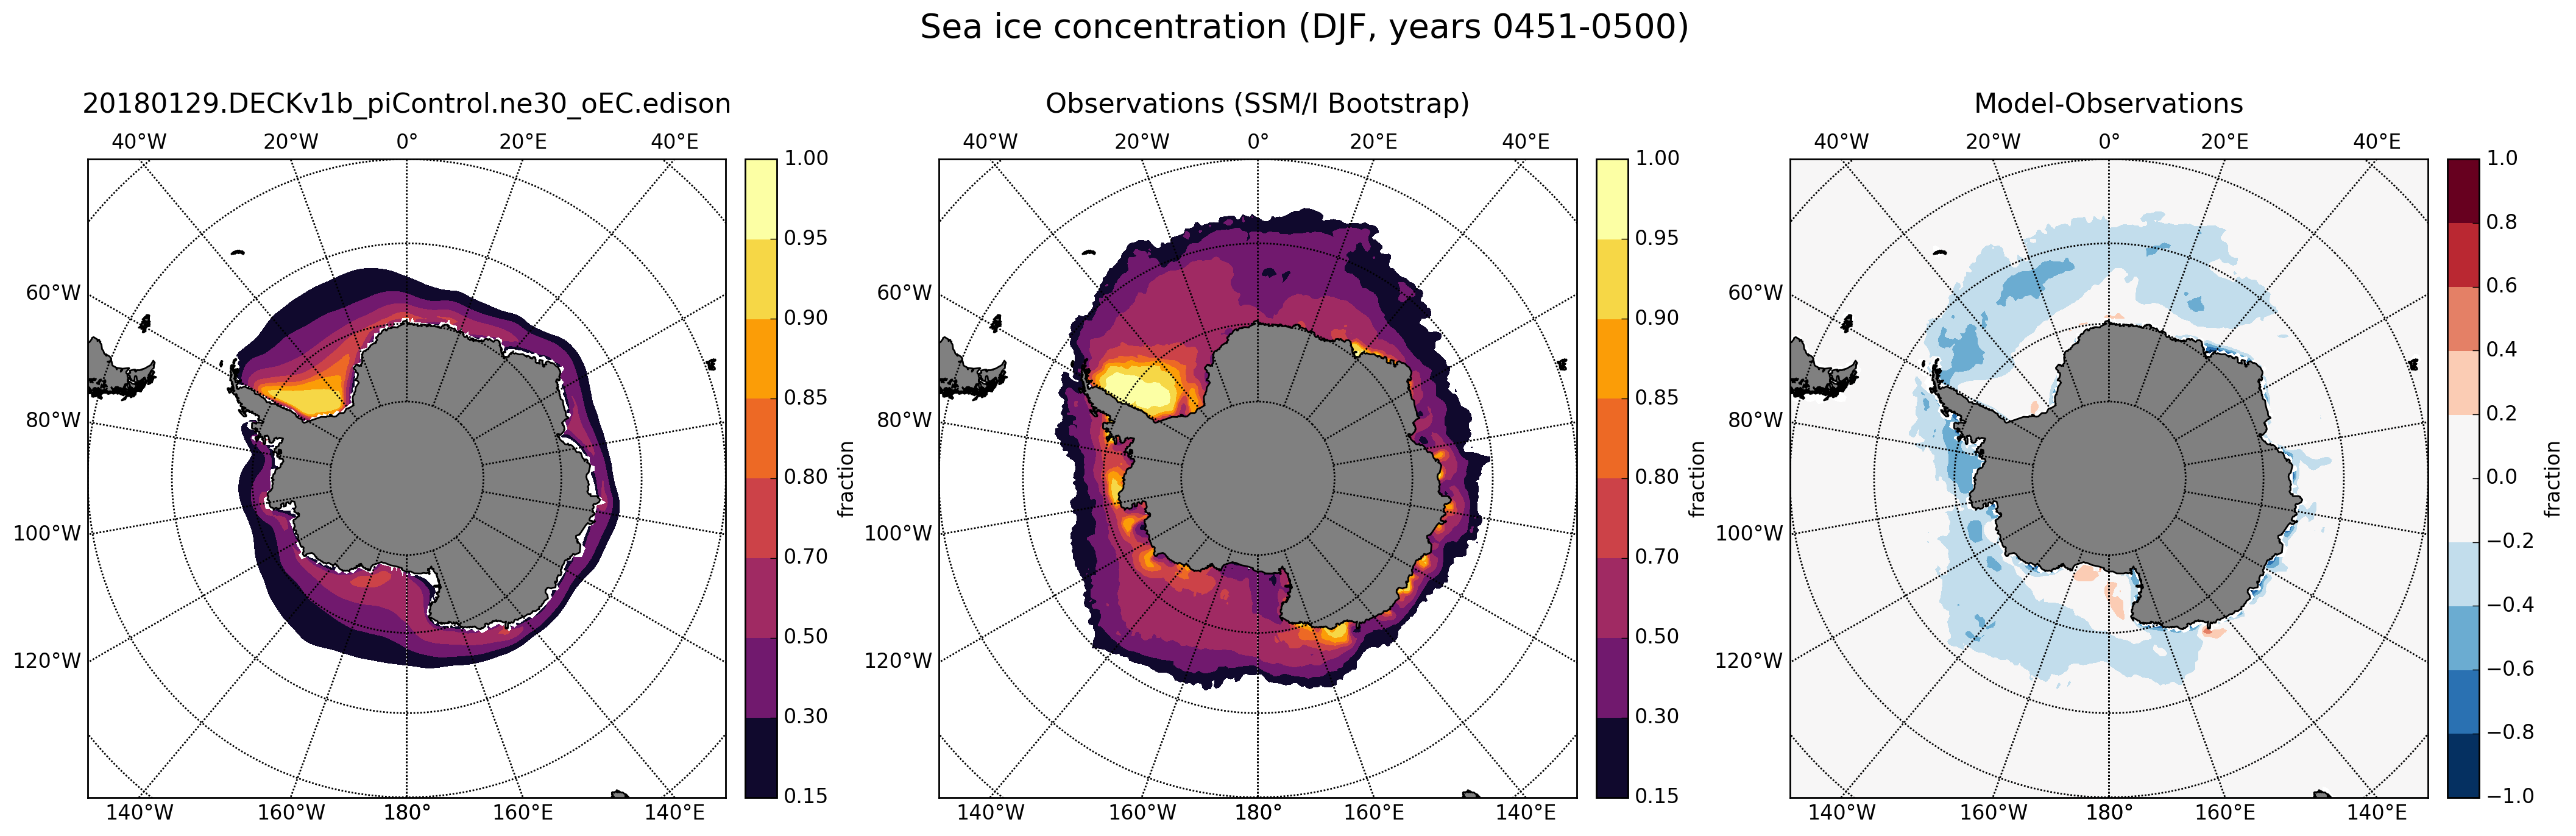
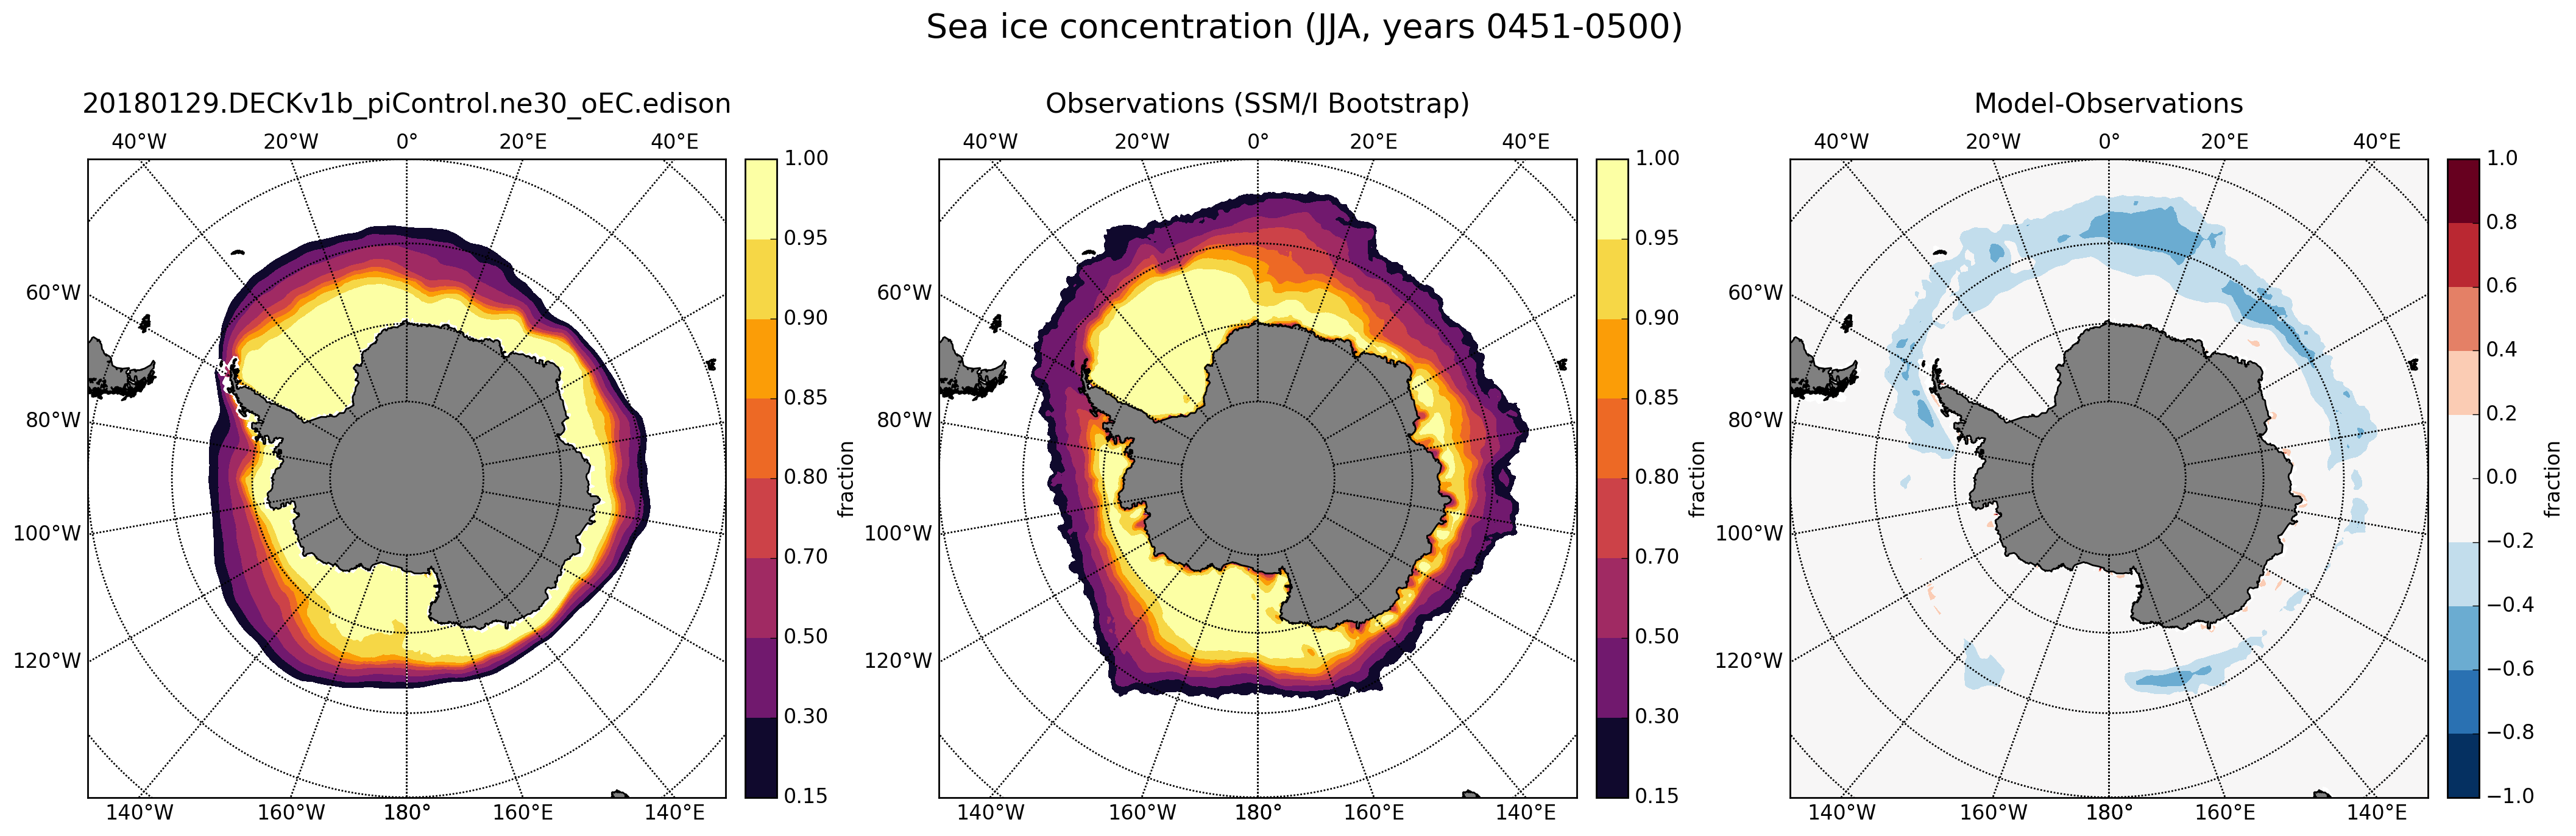
| SSM/I Bootstrap
| DJF
| JJA
|
| Ice Conc.
| Ice concentration
| plot
| plot
|
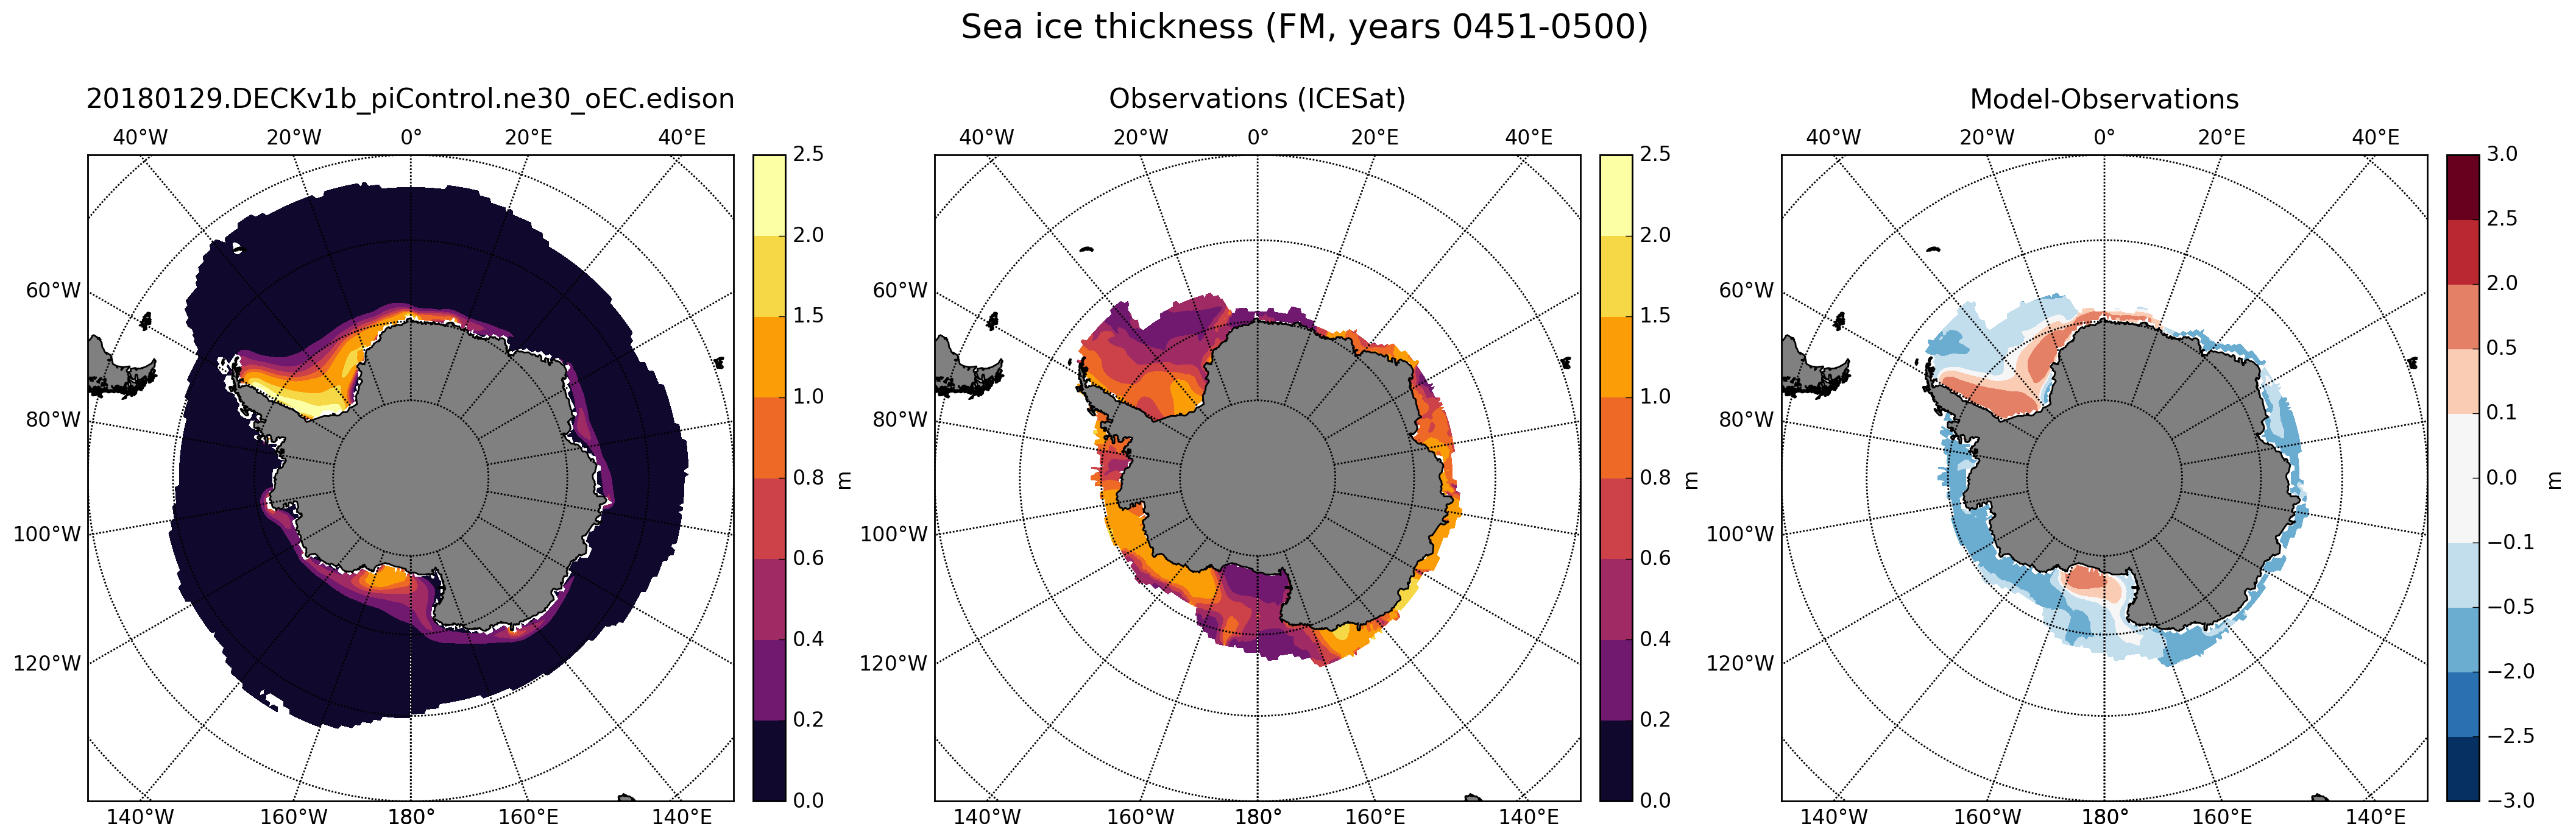
| ICESat
| FM
| ON
|
| Ice Thick.
| Ice Thickness
| plot
| plot
|
|
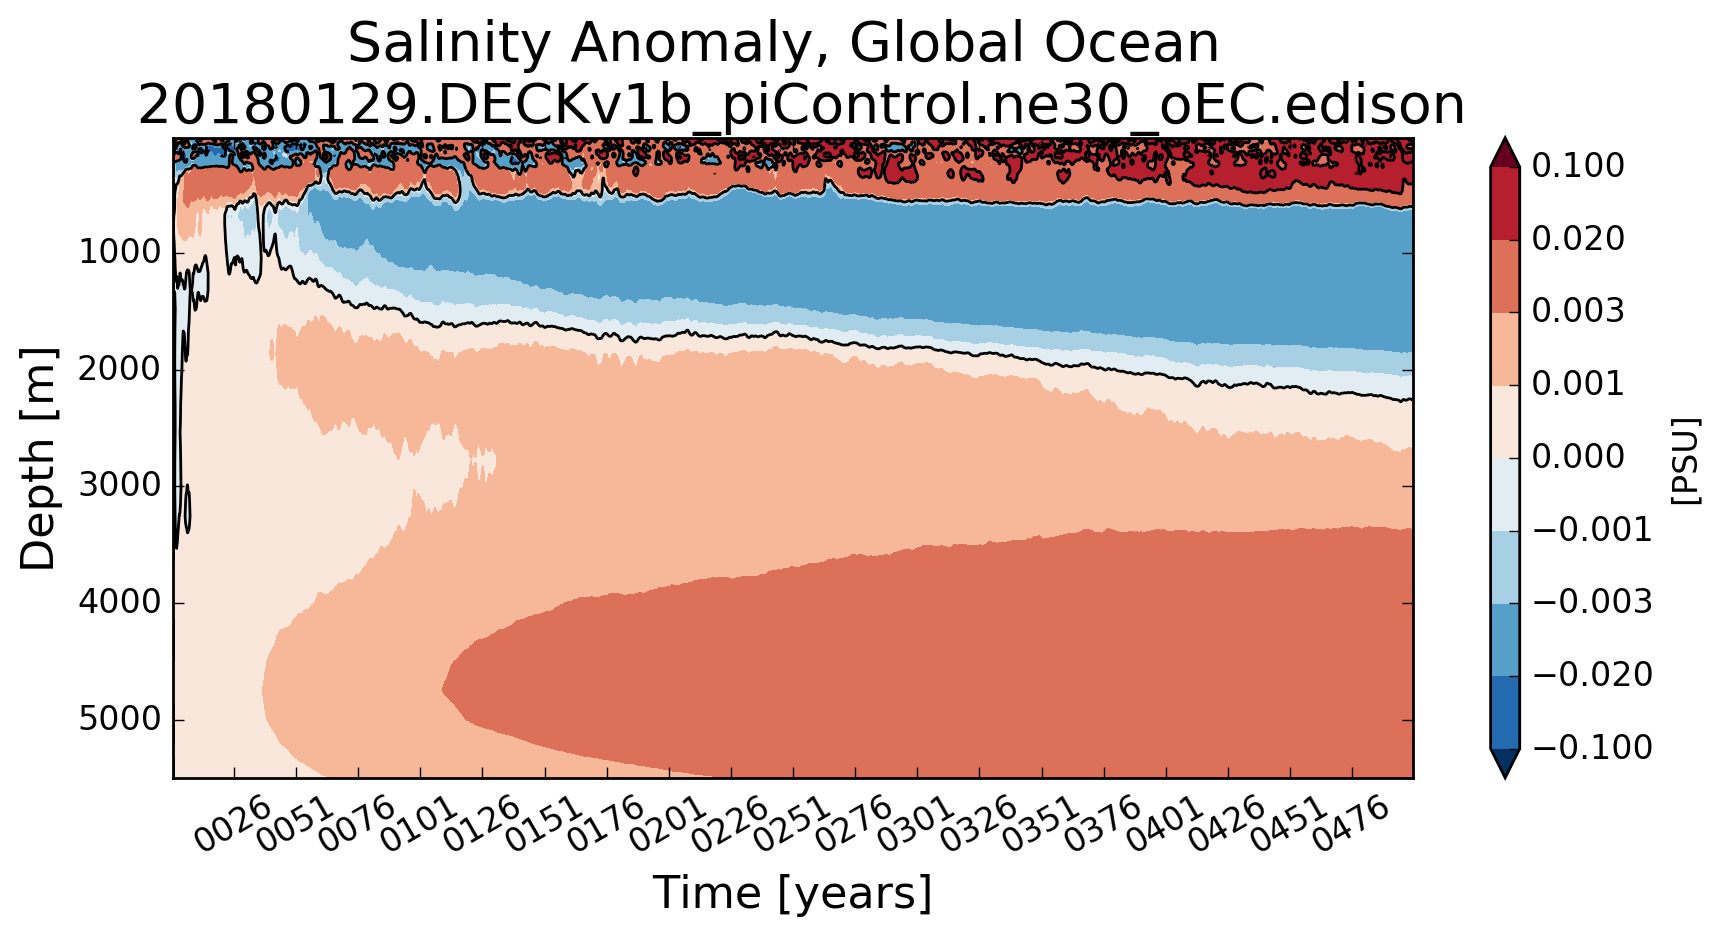
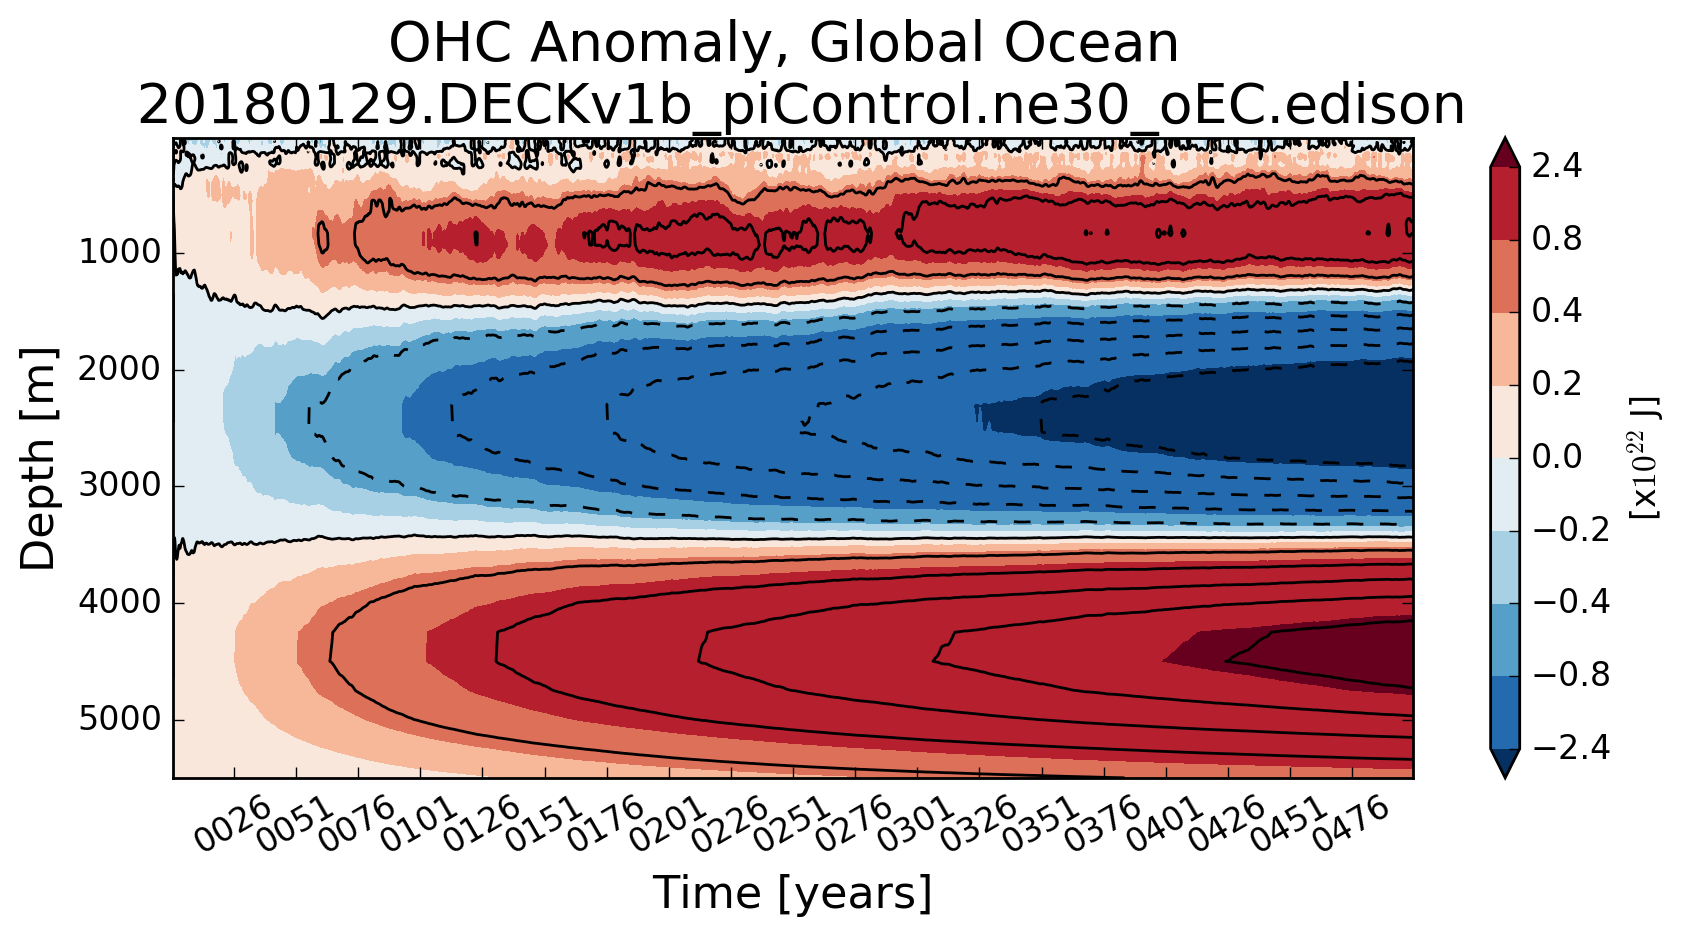
Other OCN/ICE plots
Time series/Trends for Years: 1-500
Climatologies for Years: 451-500
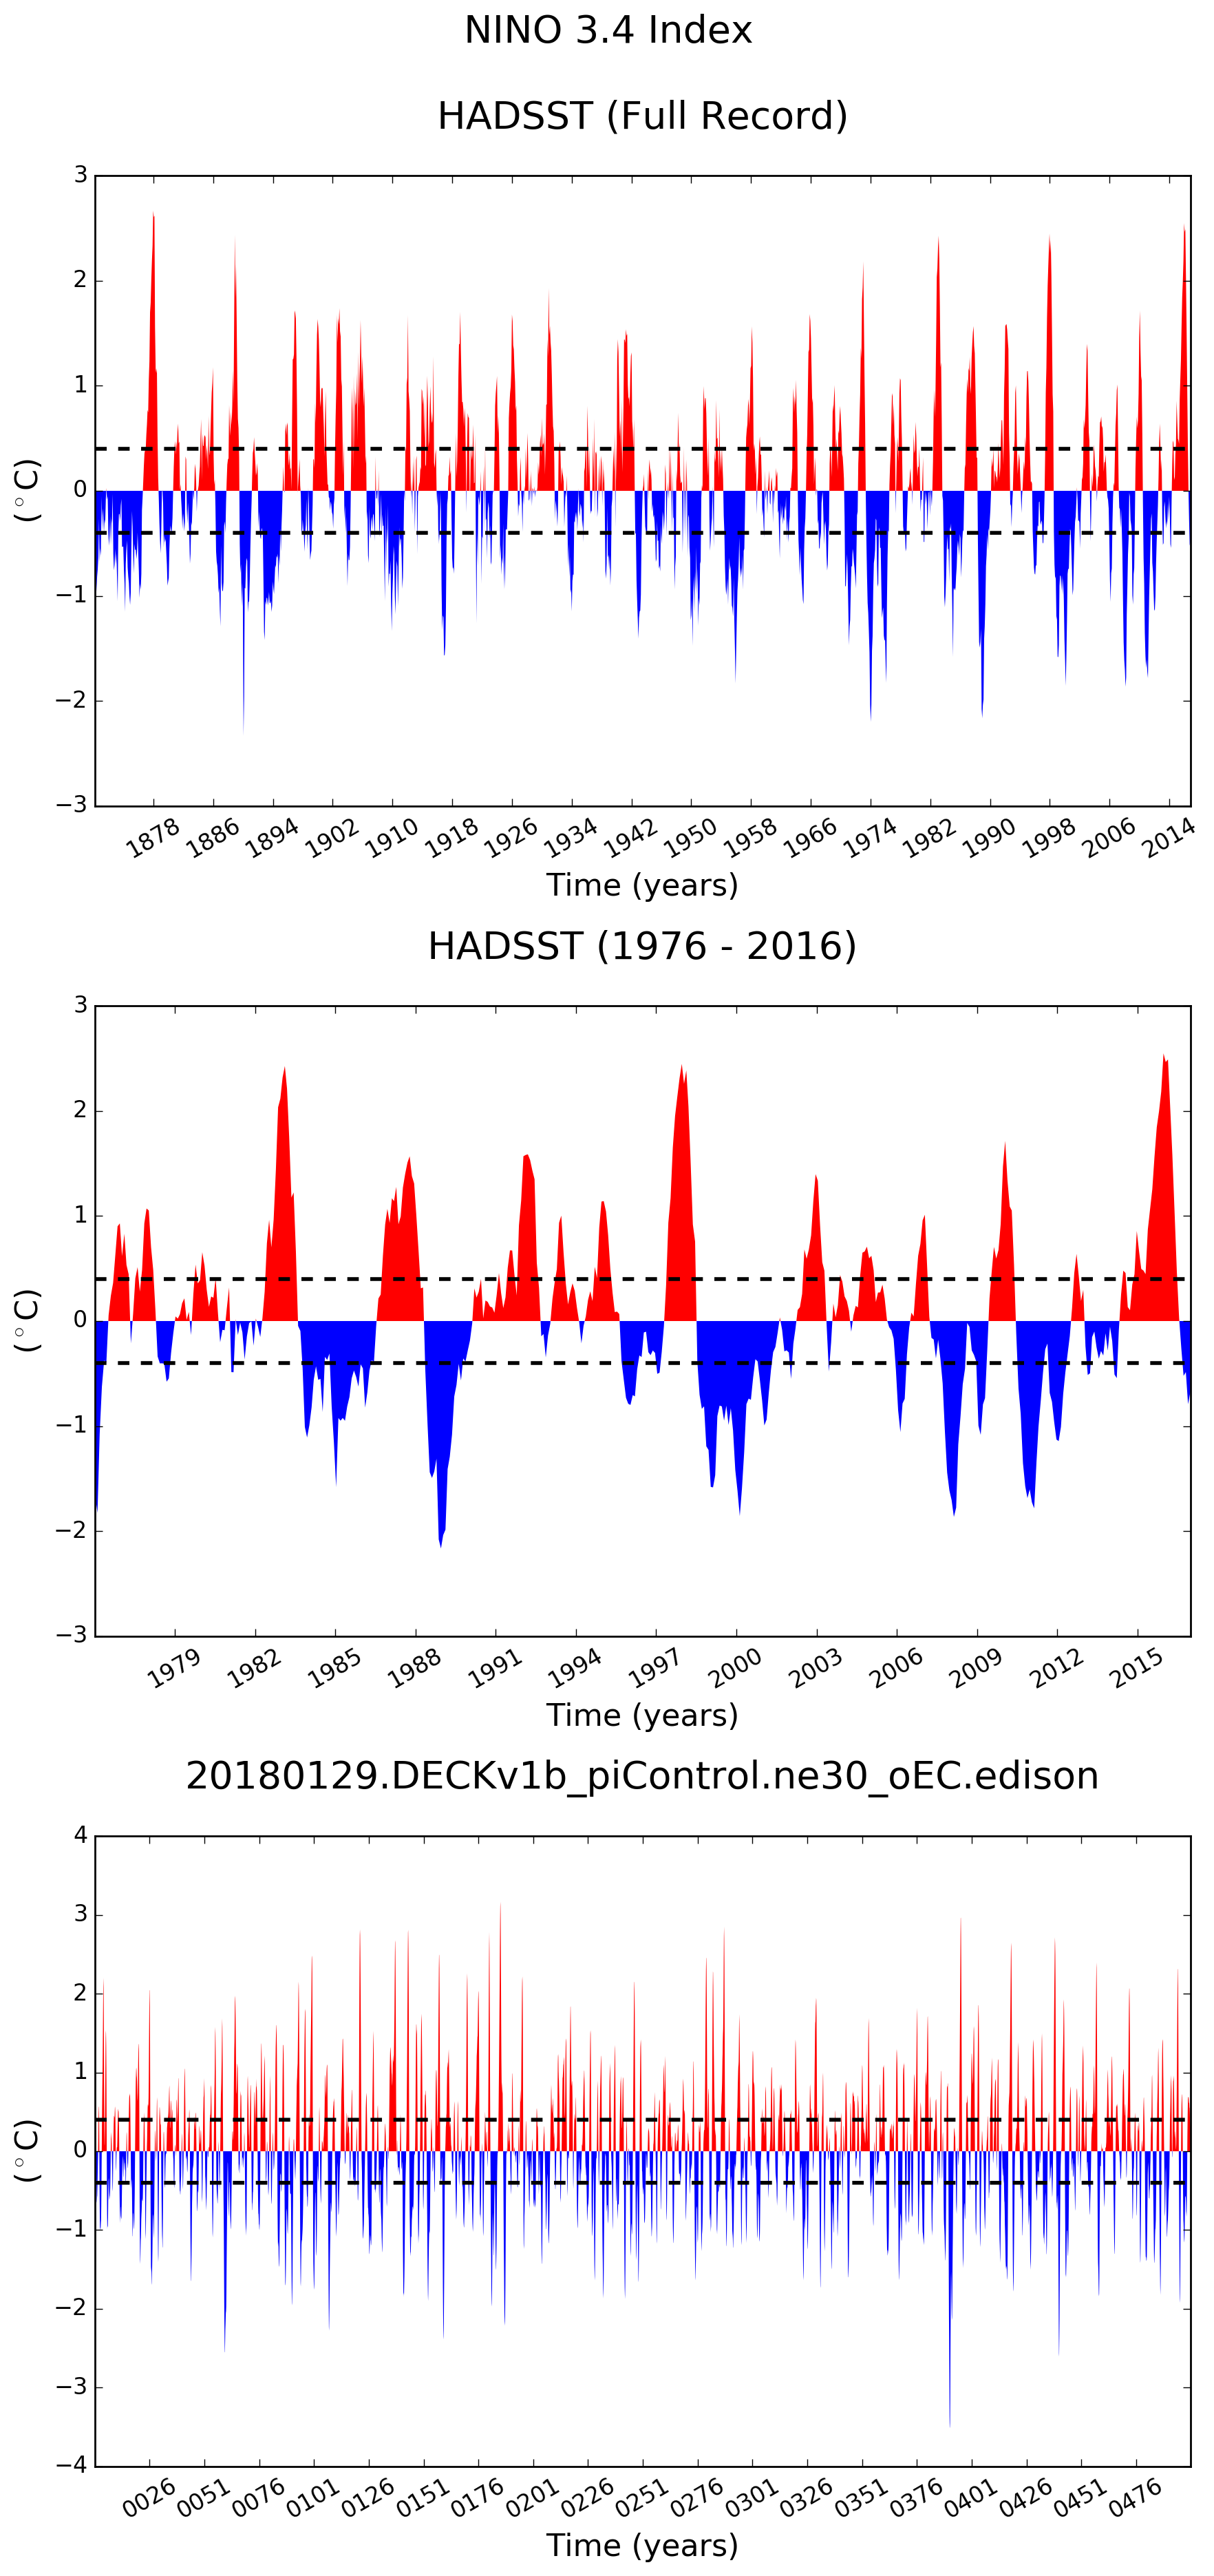
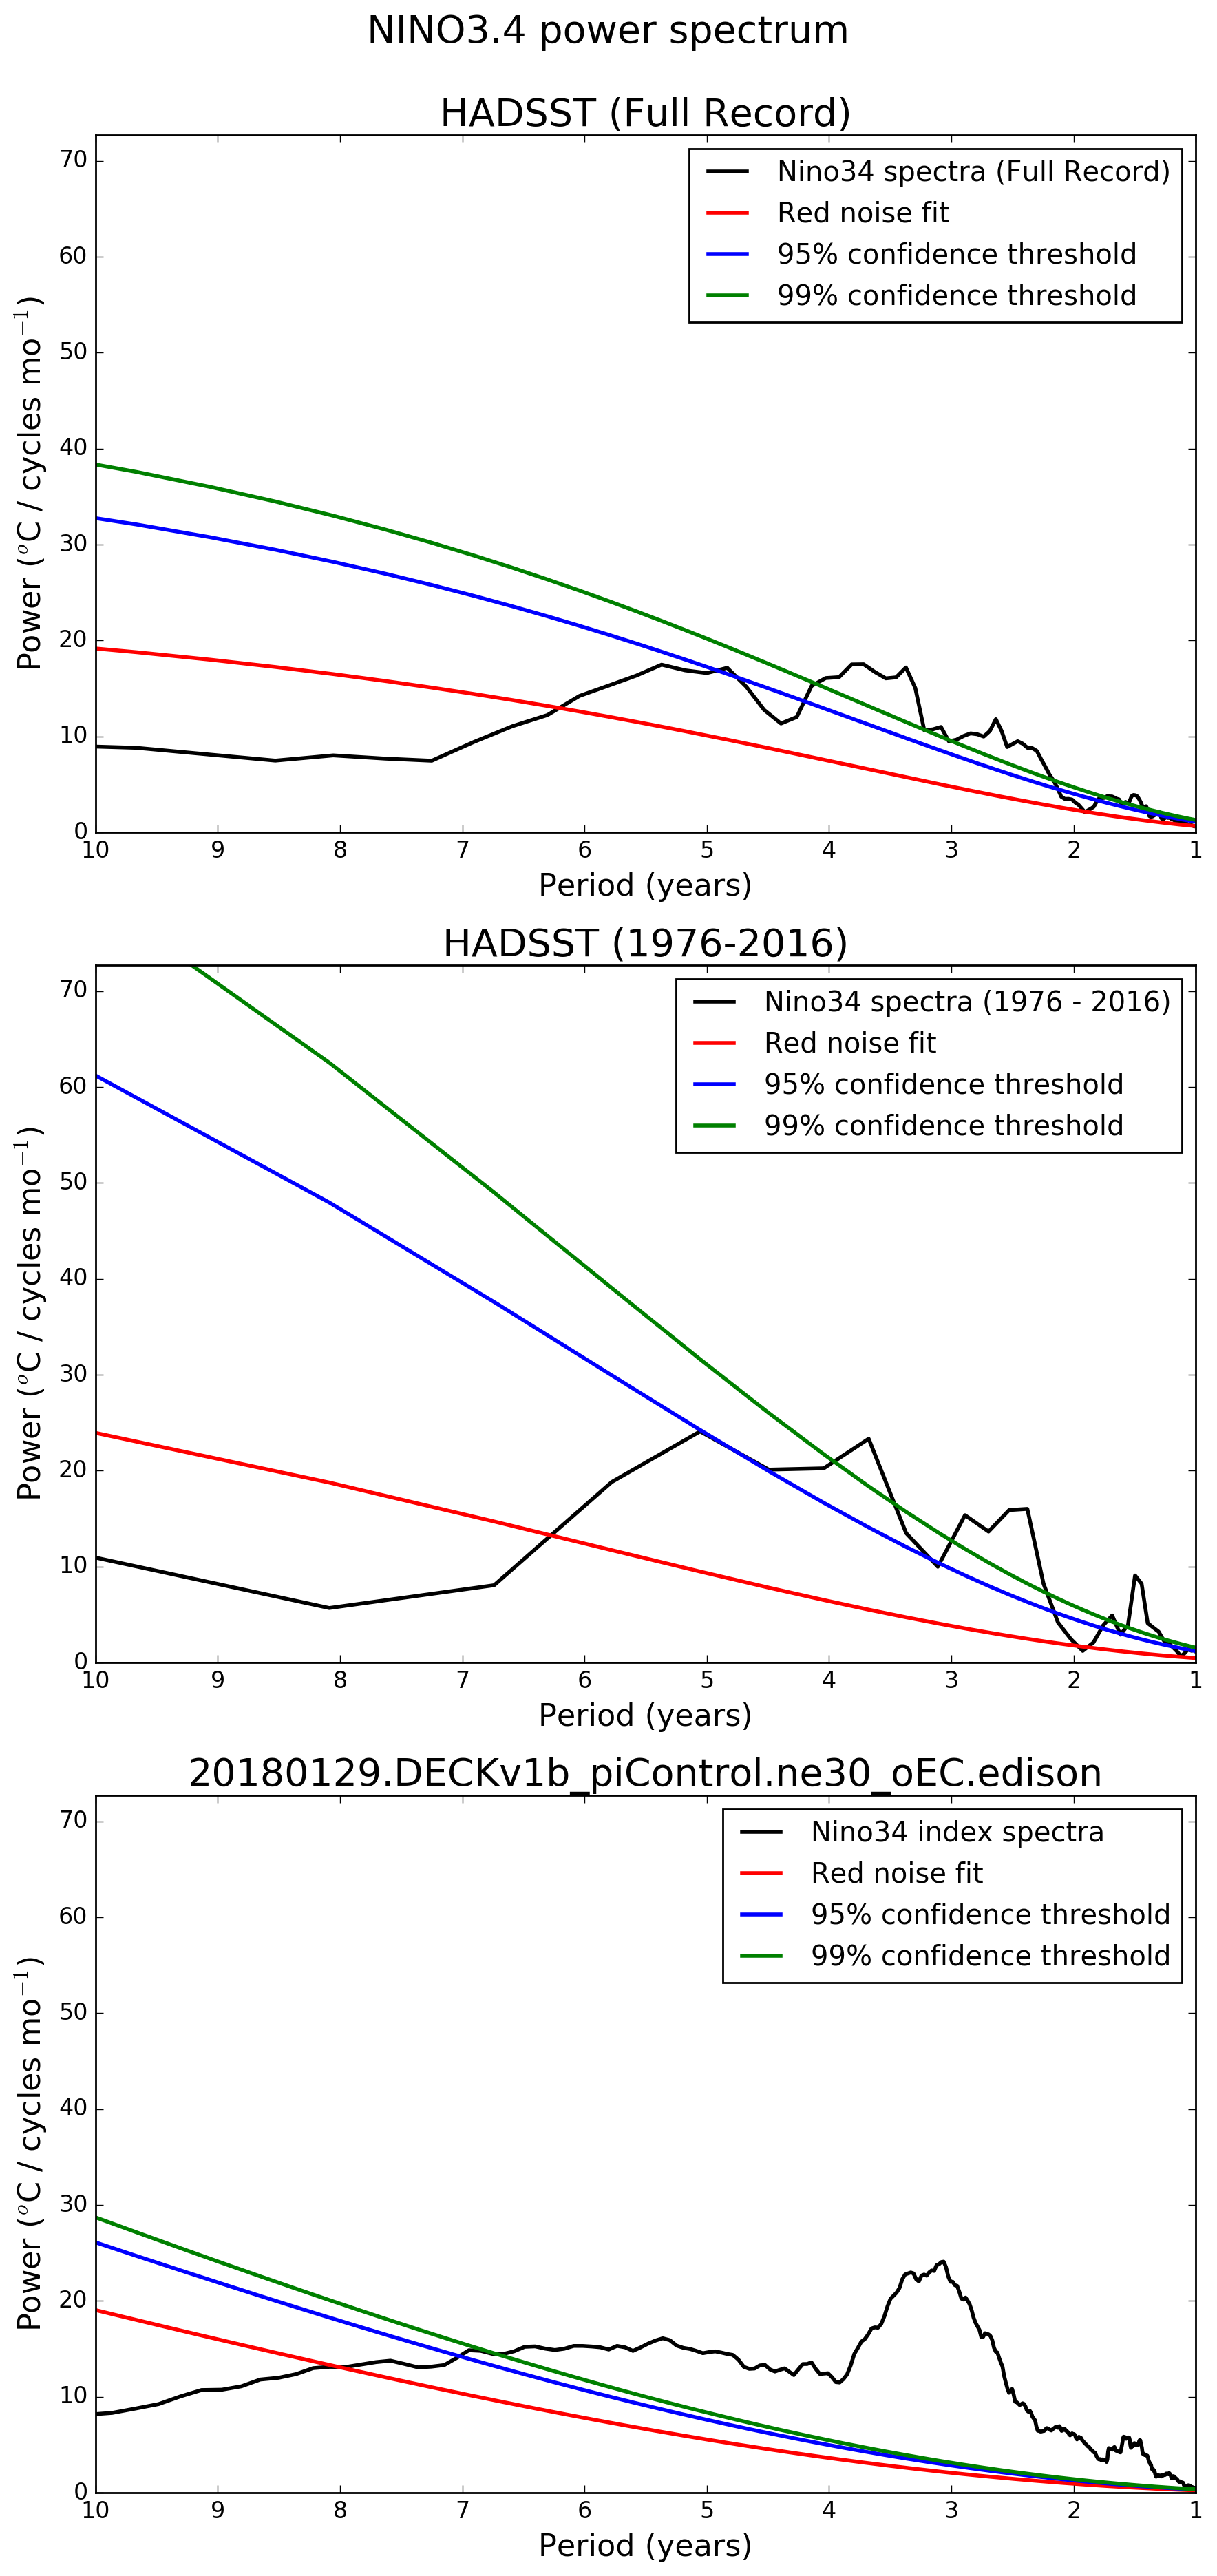
Nino3.4 diagnostics for Years: 1-500
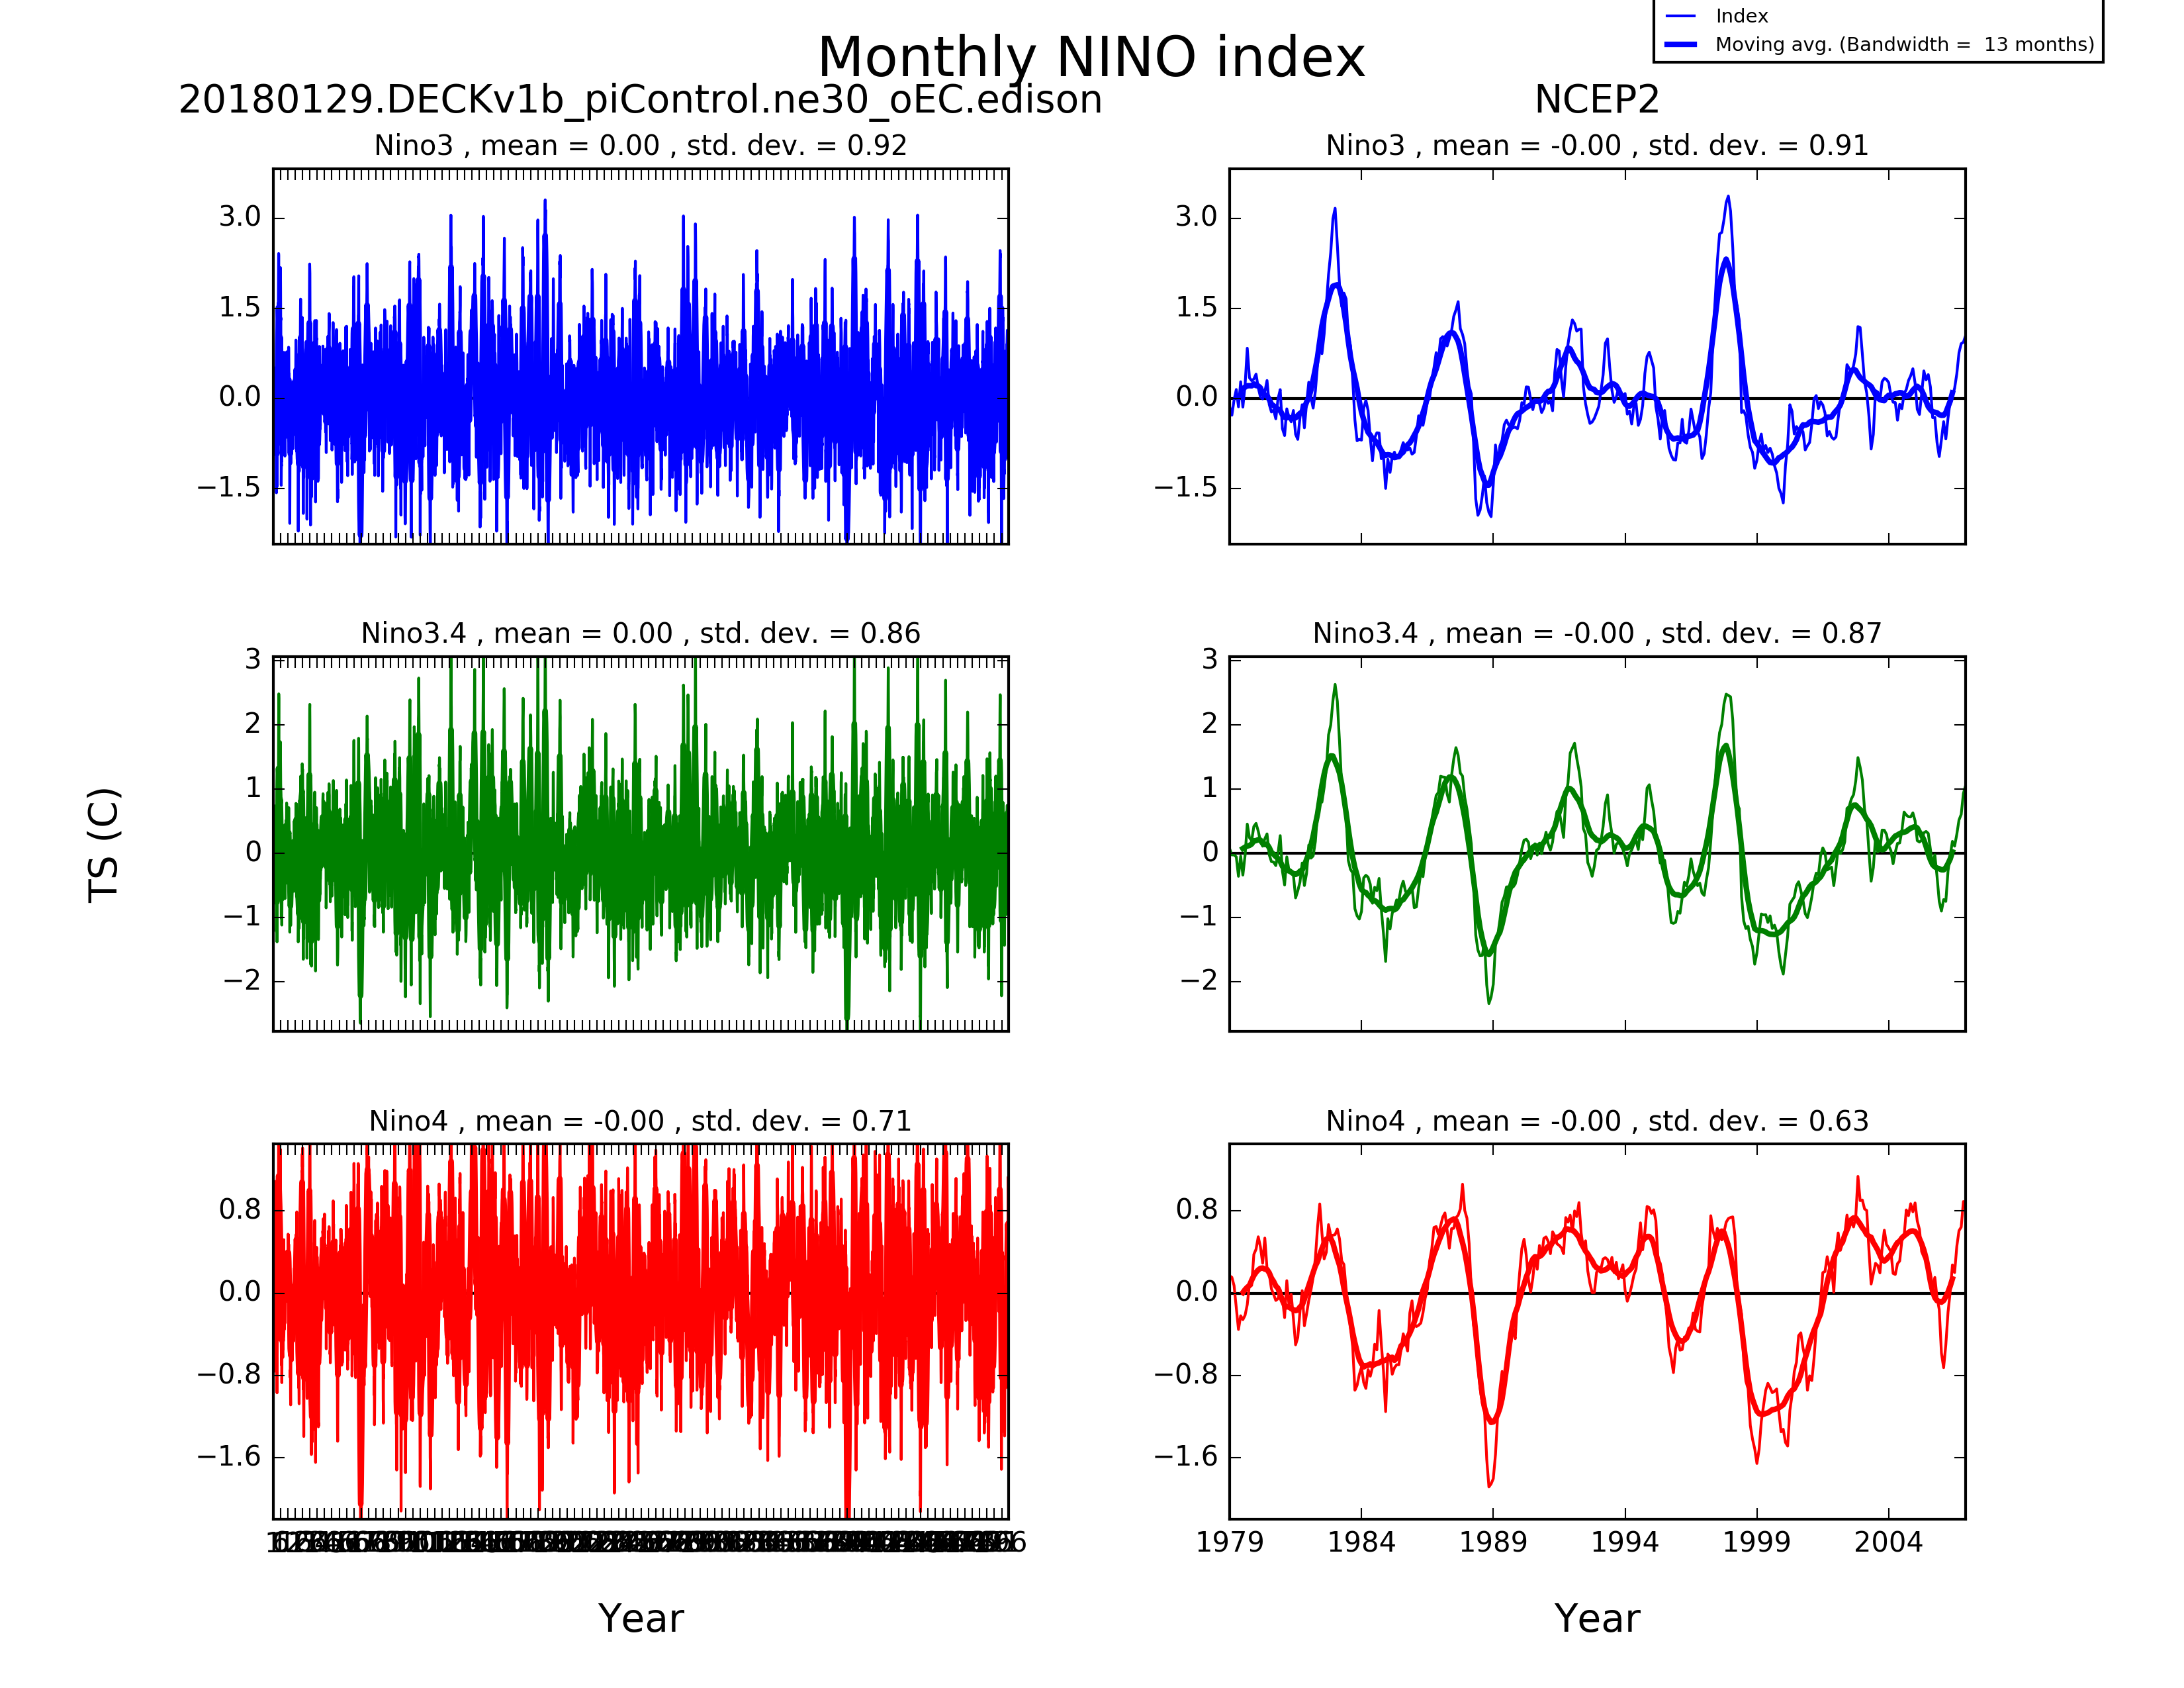
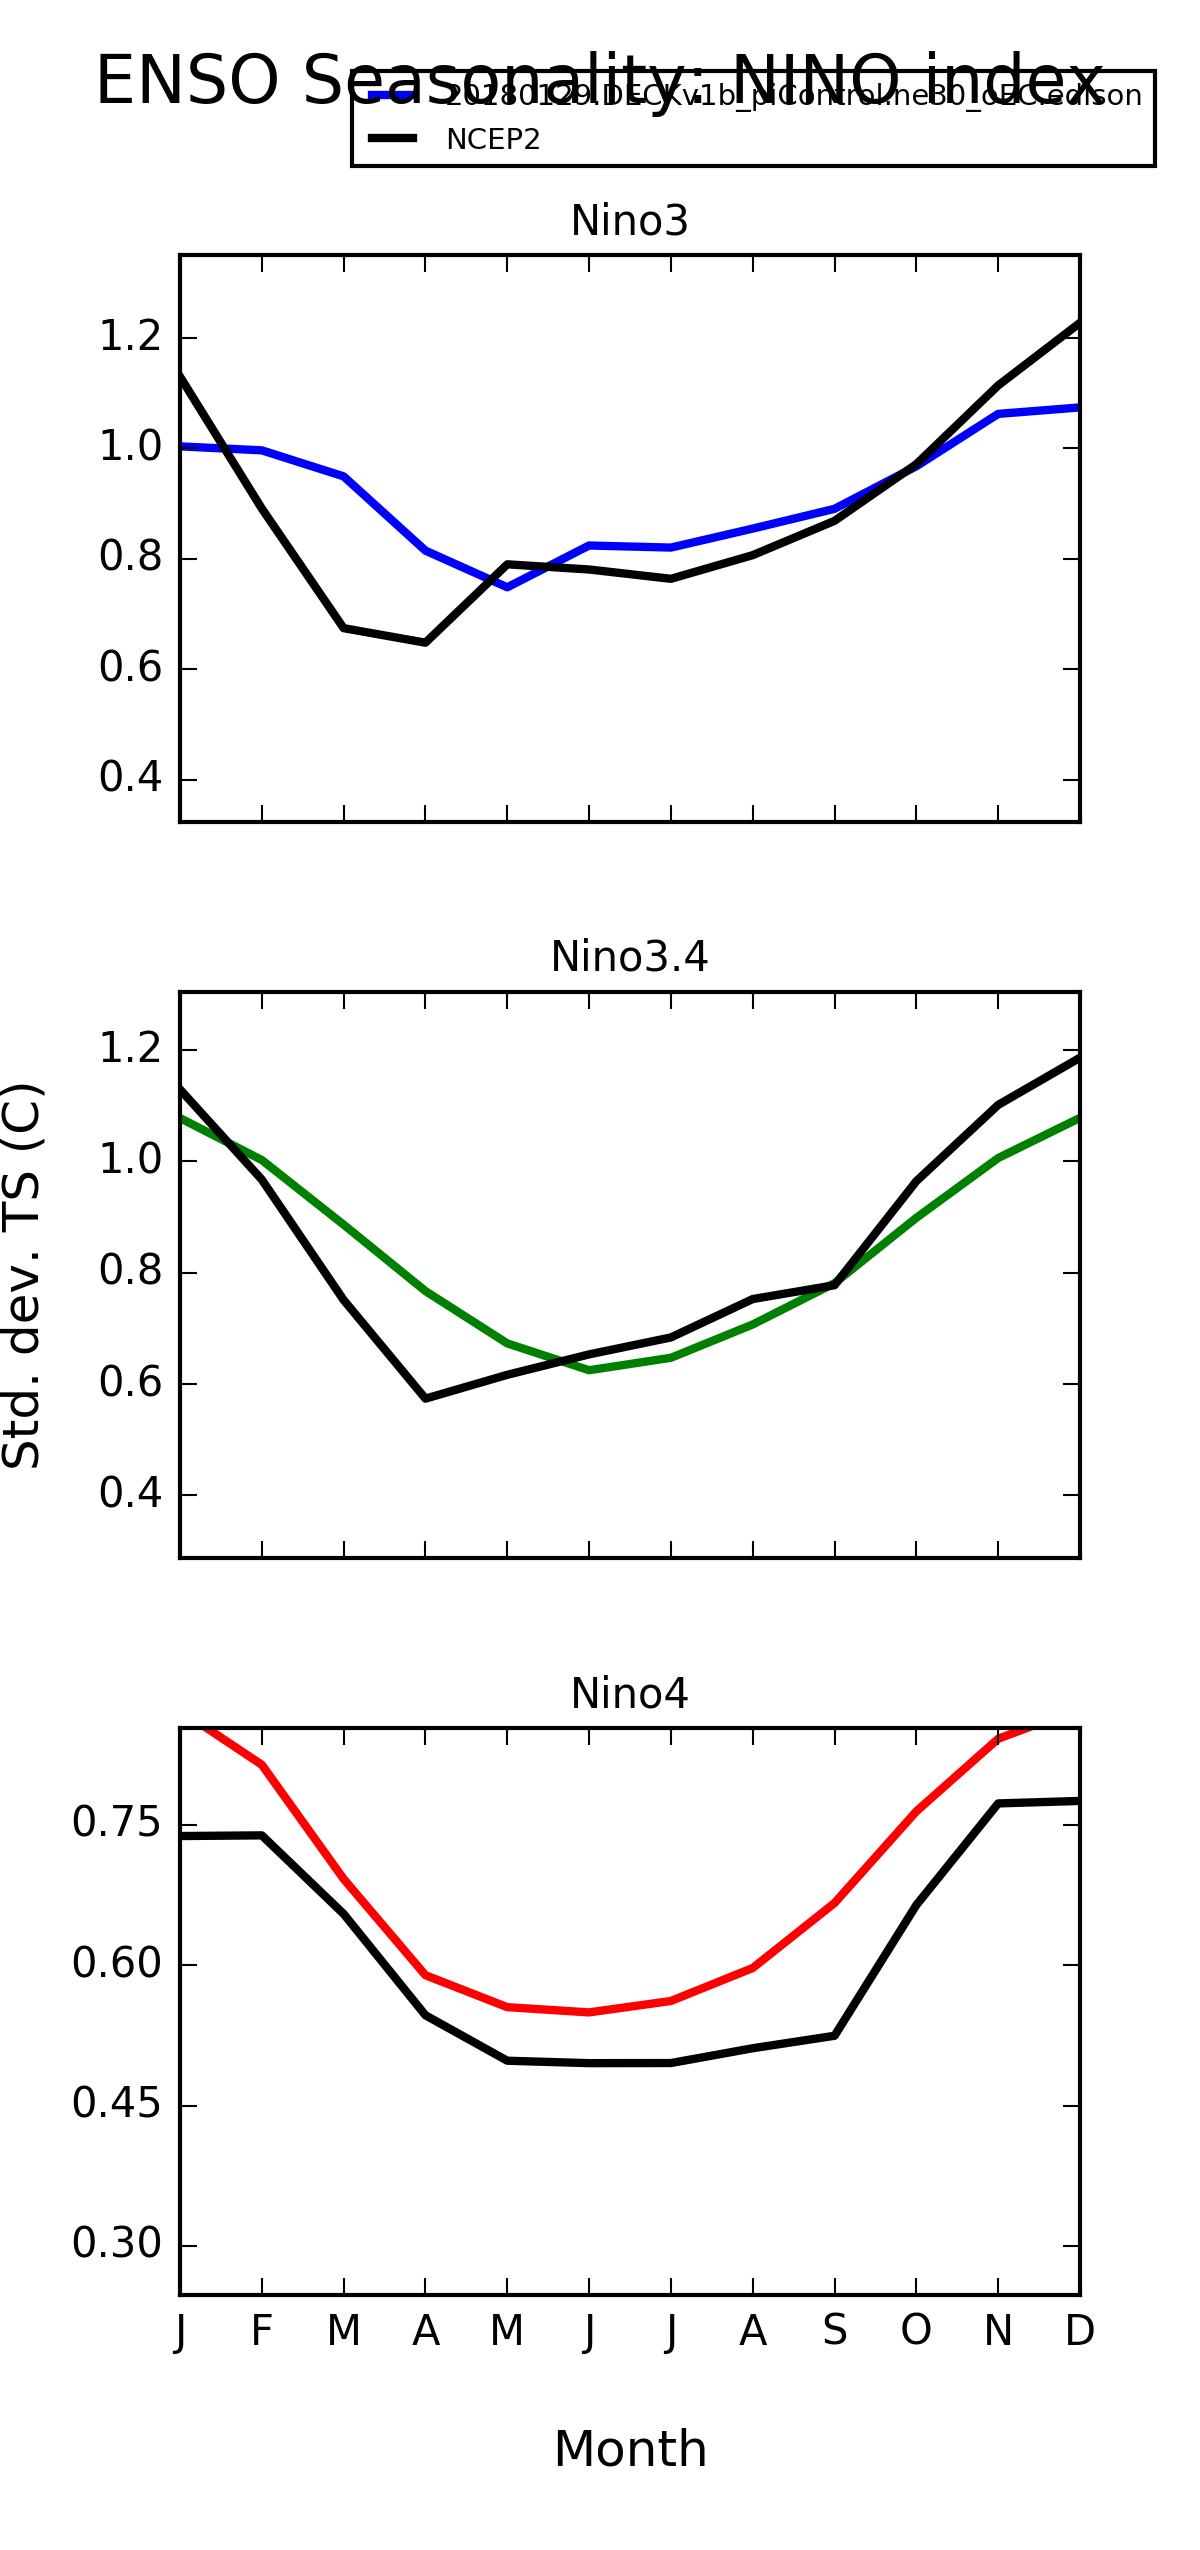
ENSO Diagnostics (ATM)
20180129.DECKv1b_piControl.ne30_oEC.edison (Years: 1-500)
obs (climo)
NINO Index
EQSOI and Nino3.4 Index
ENSO Seasonality
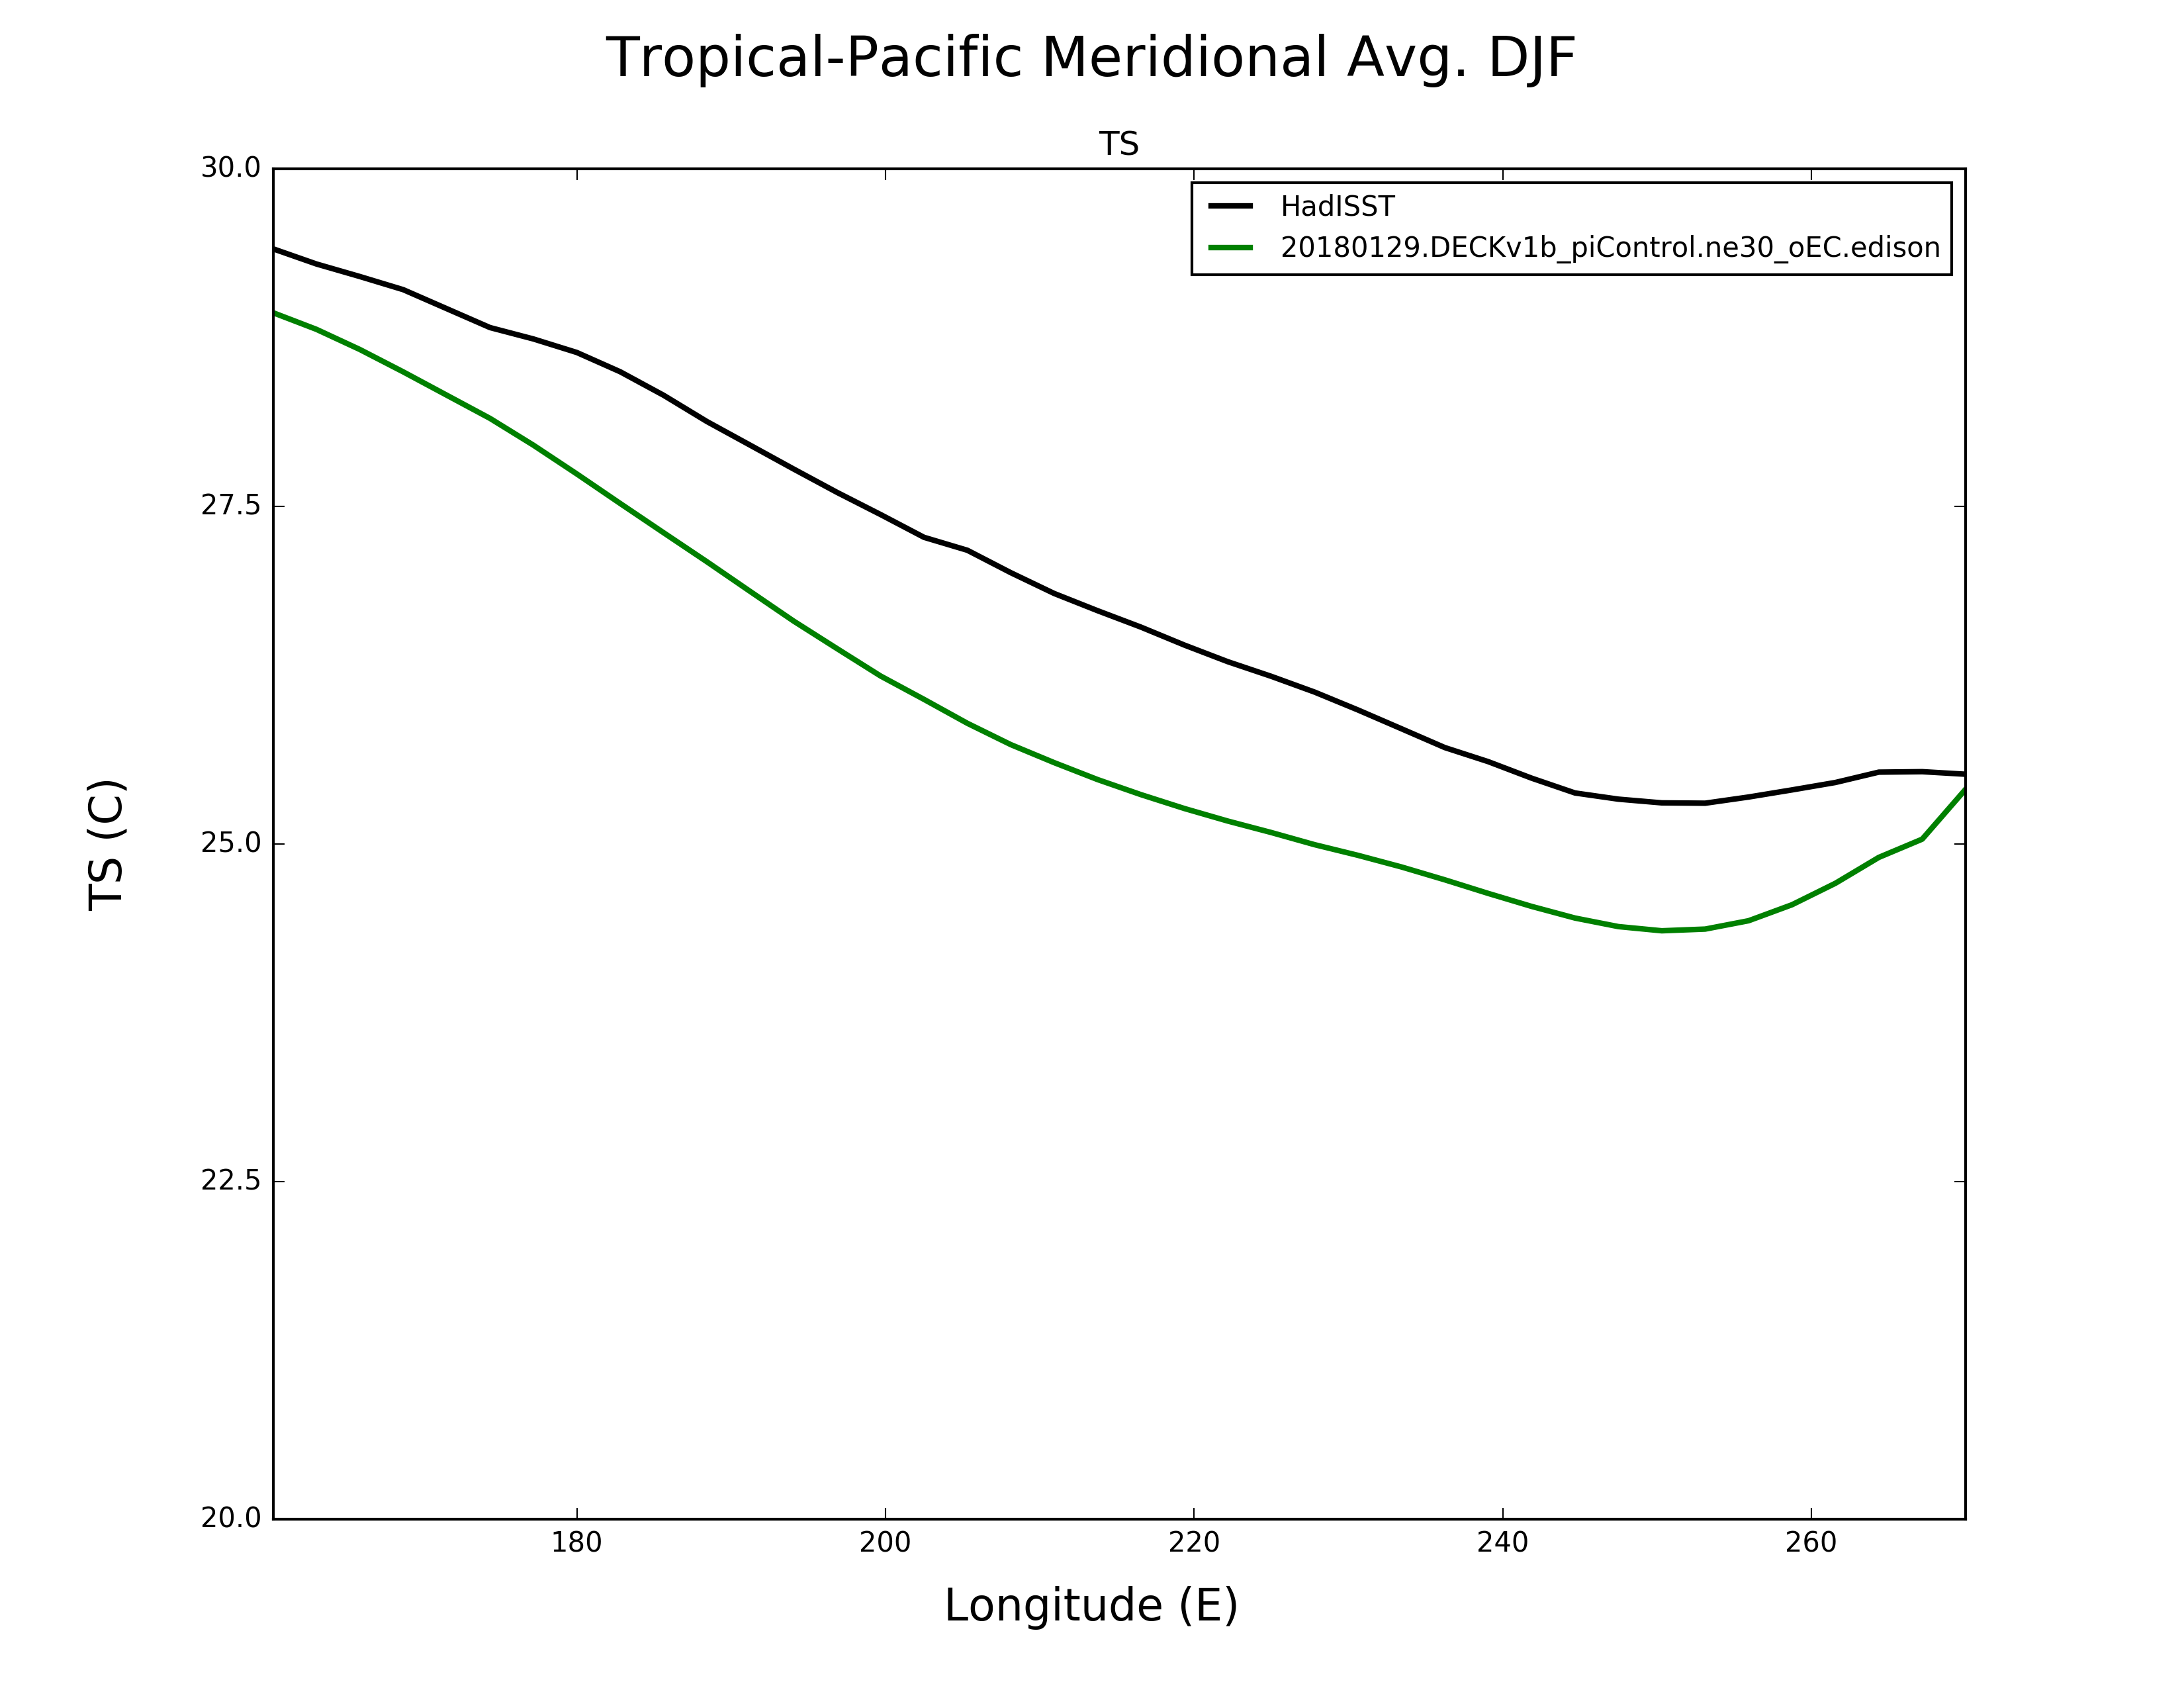
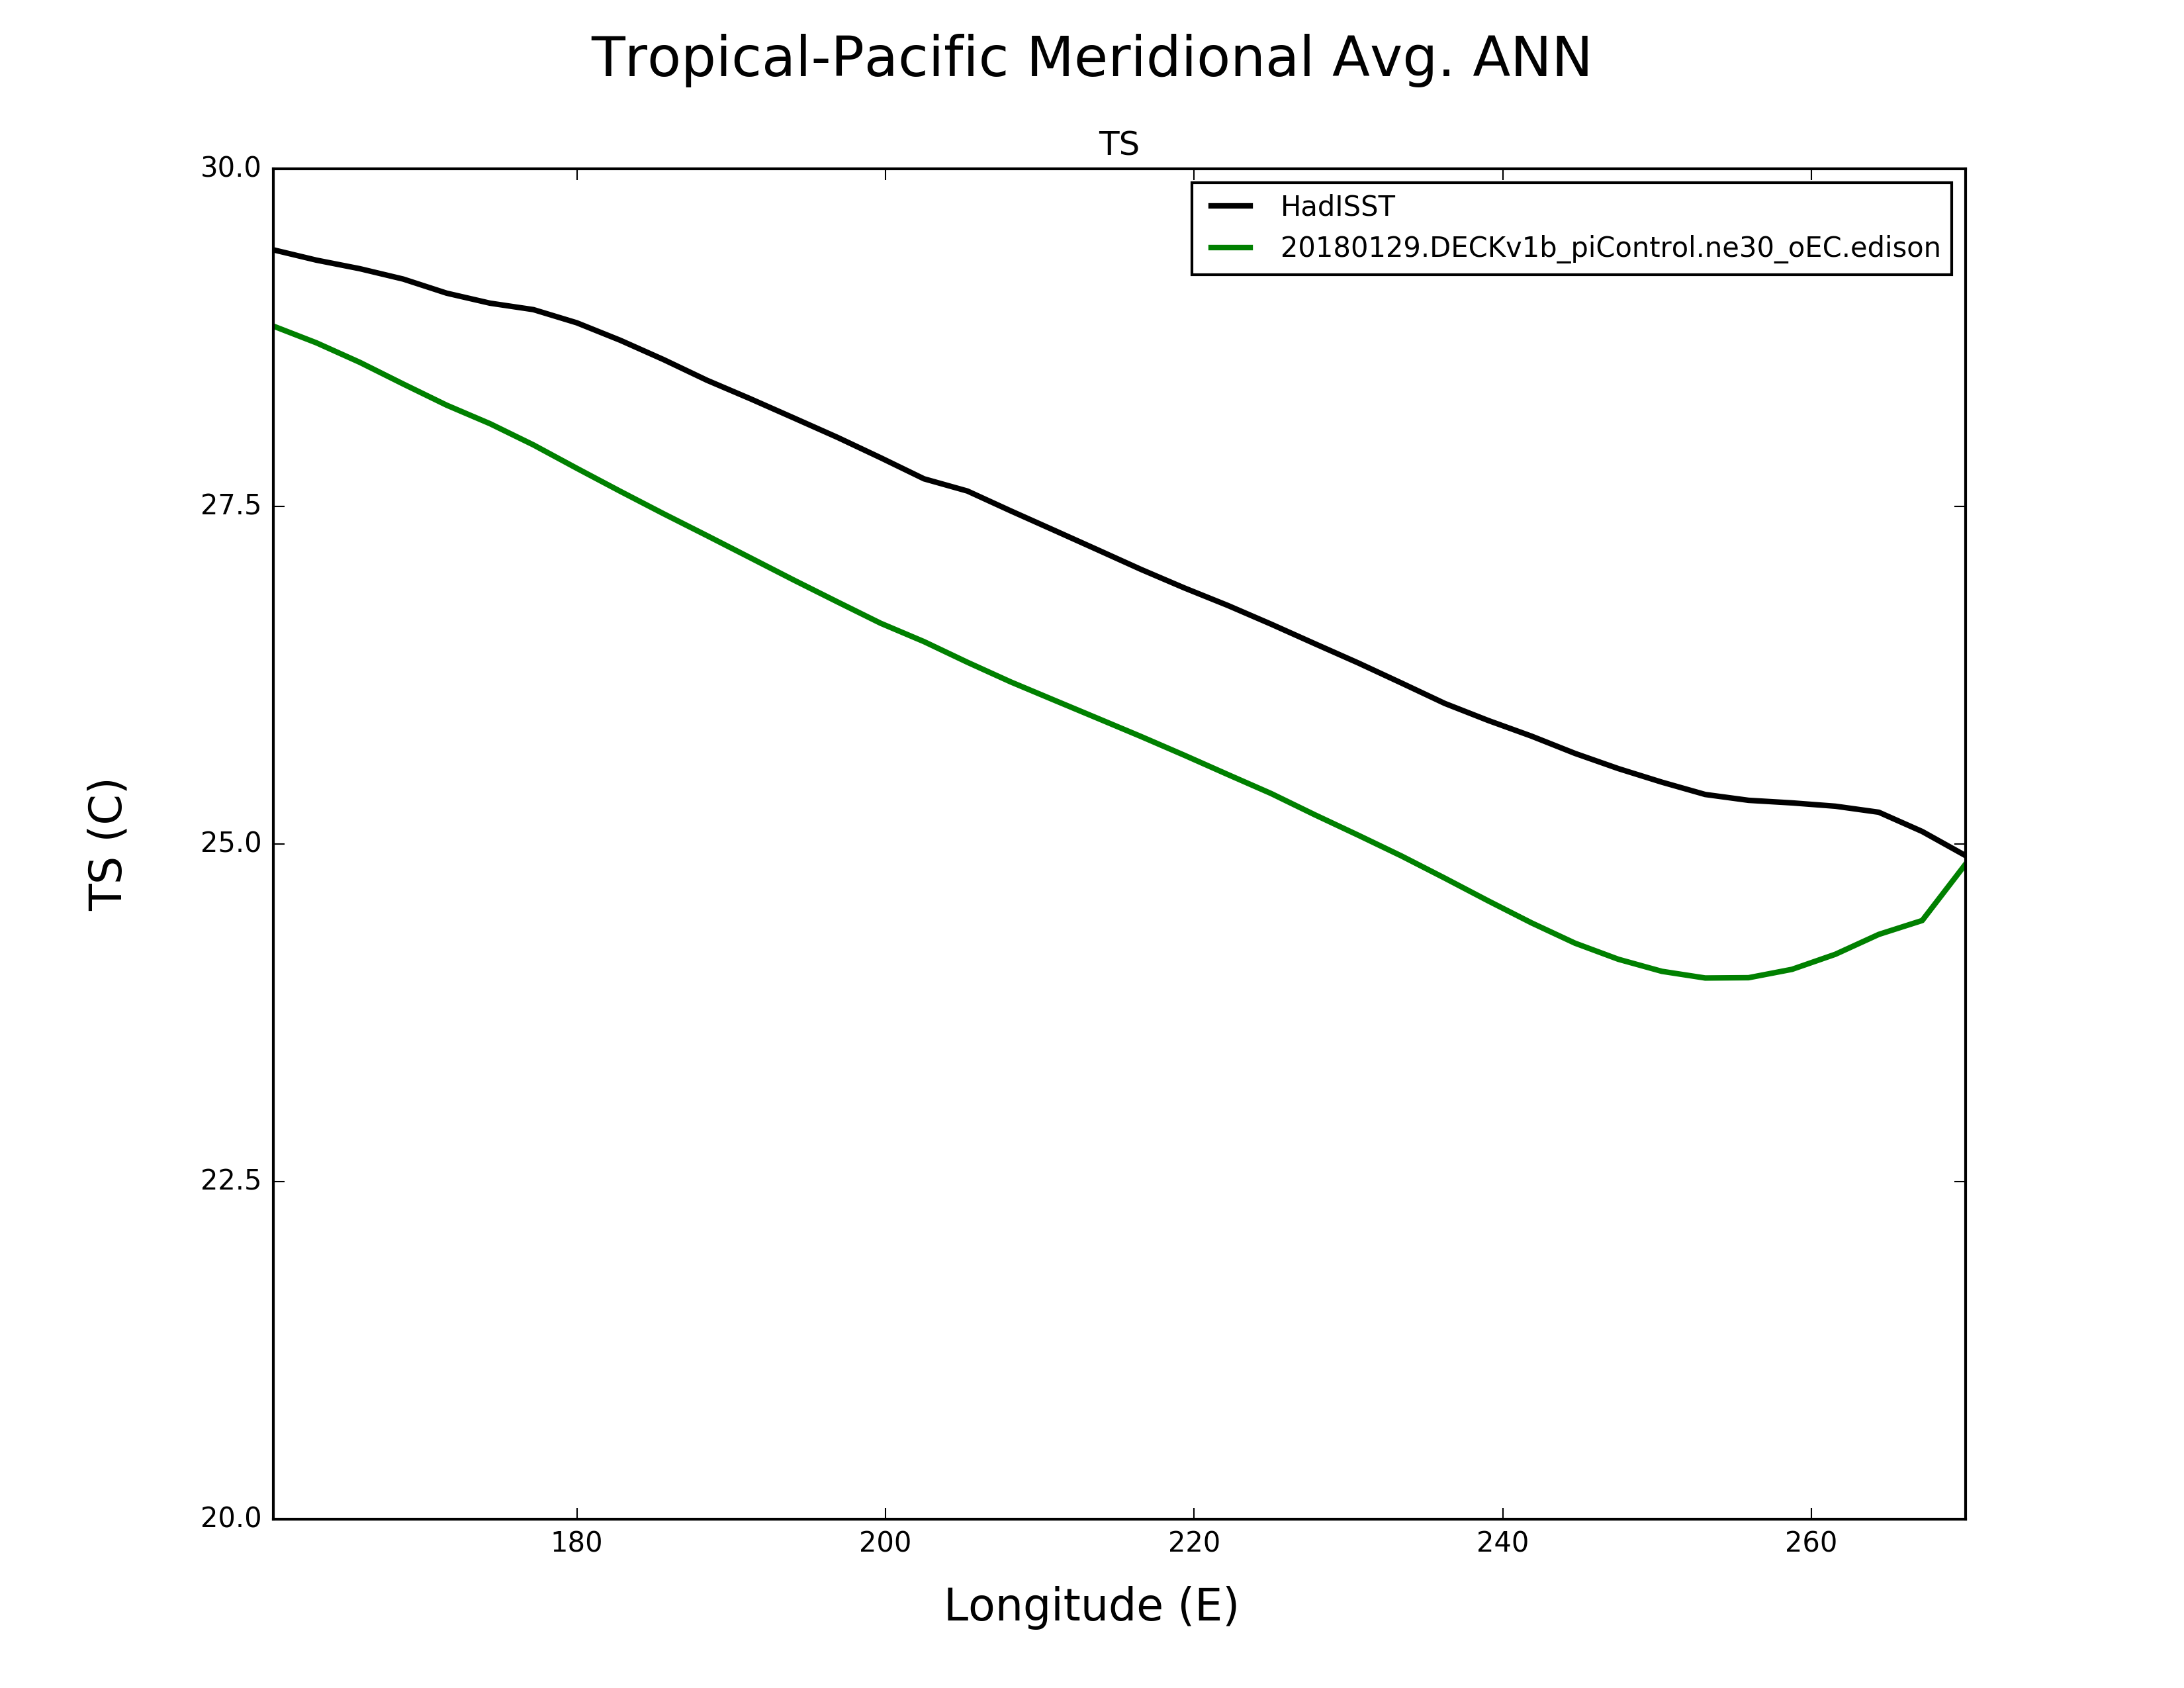
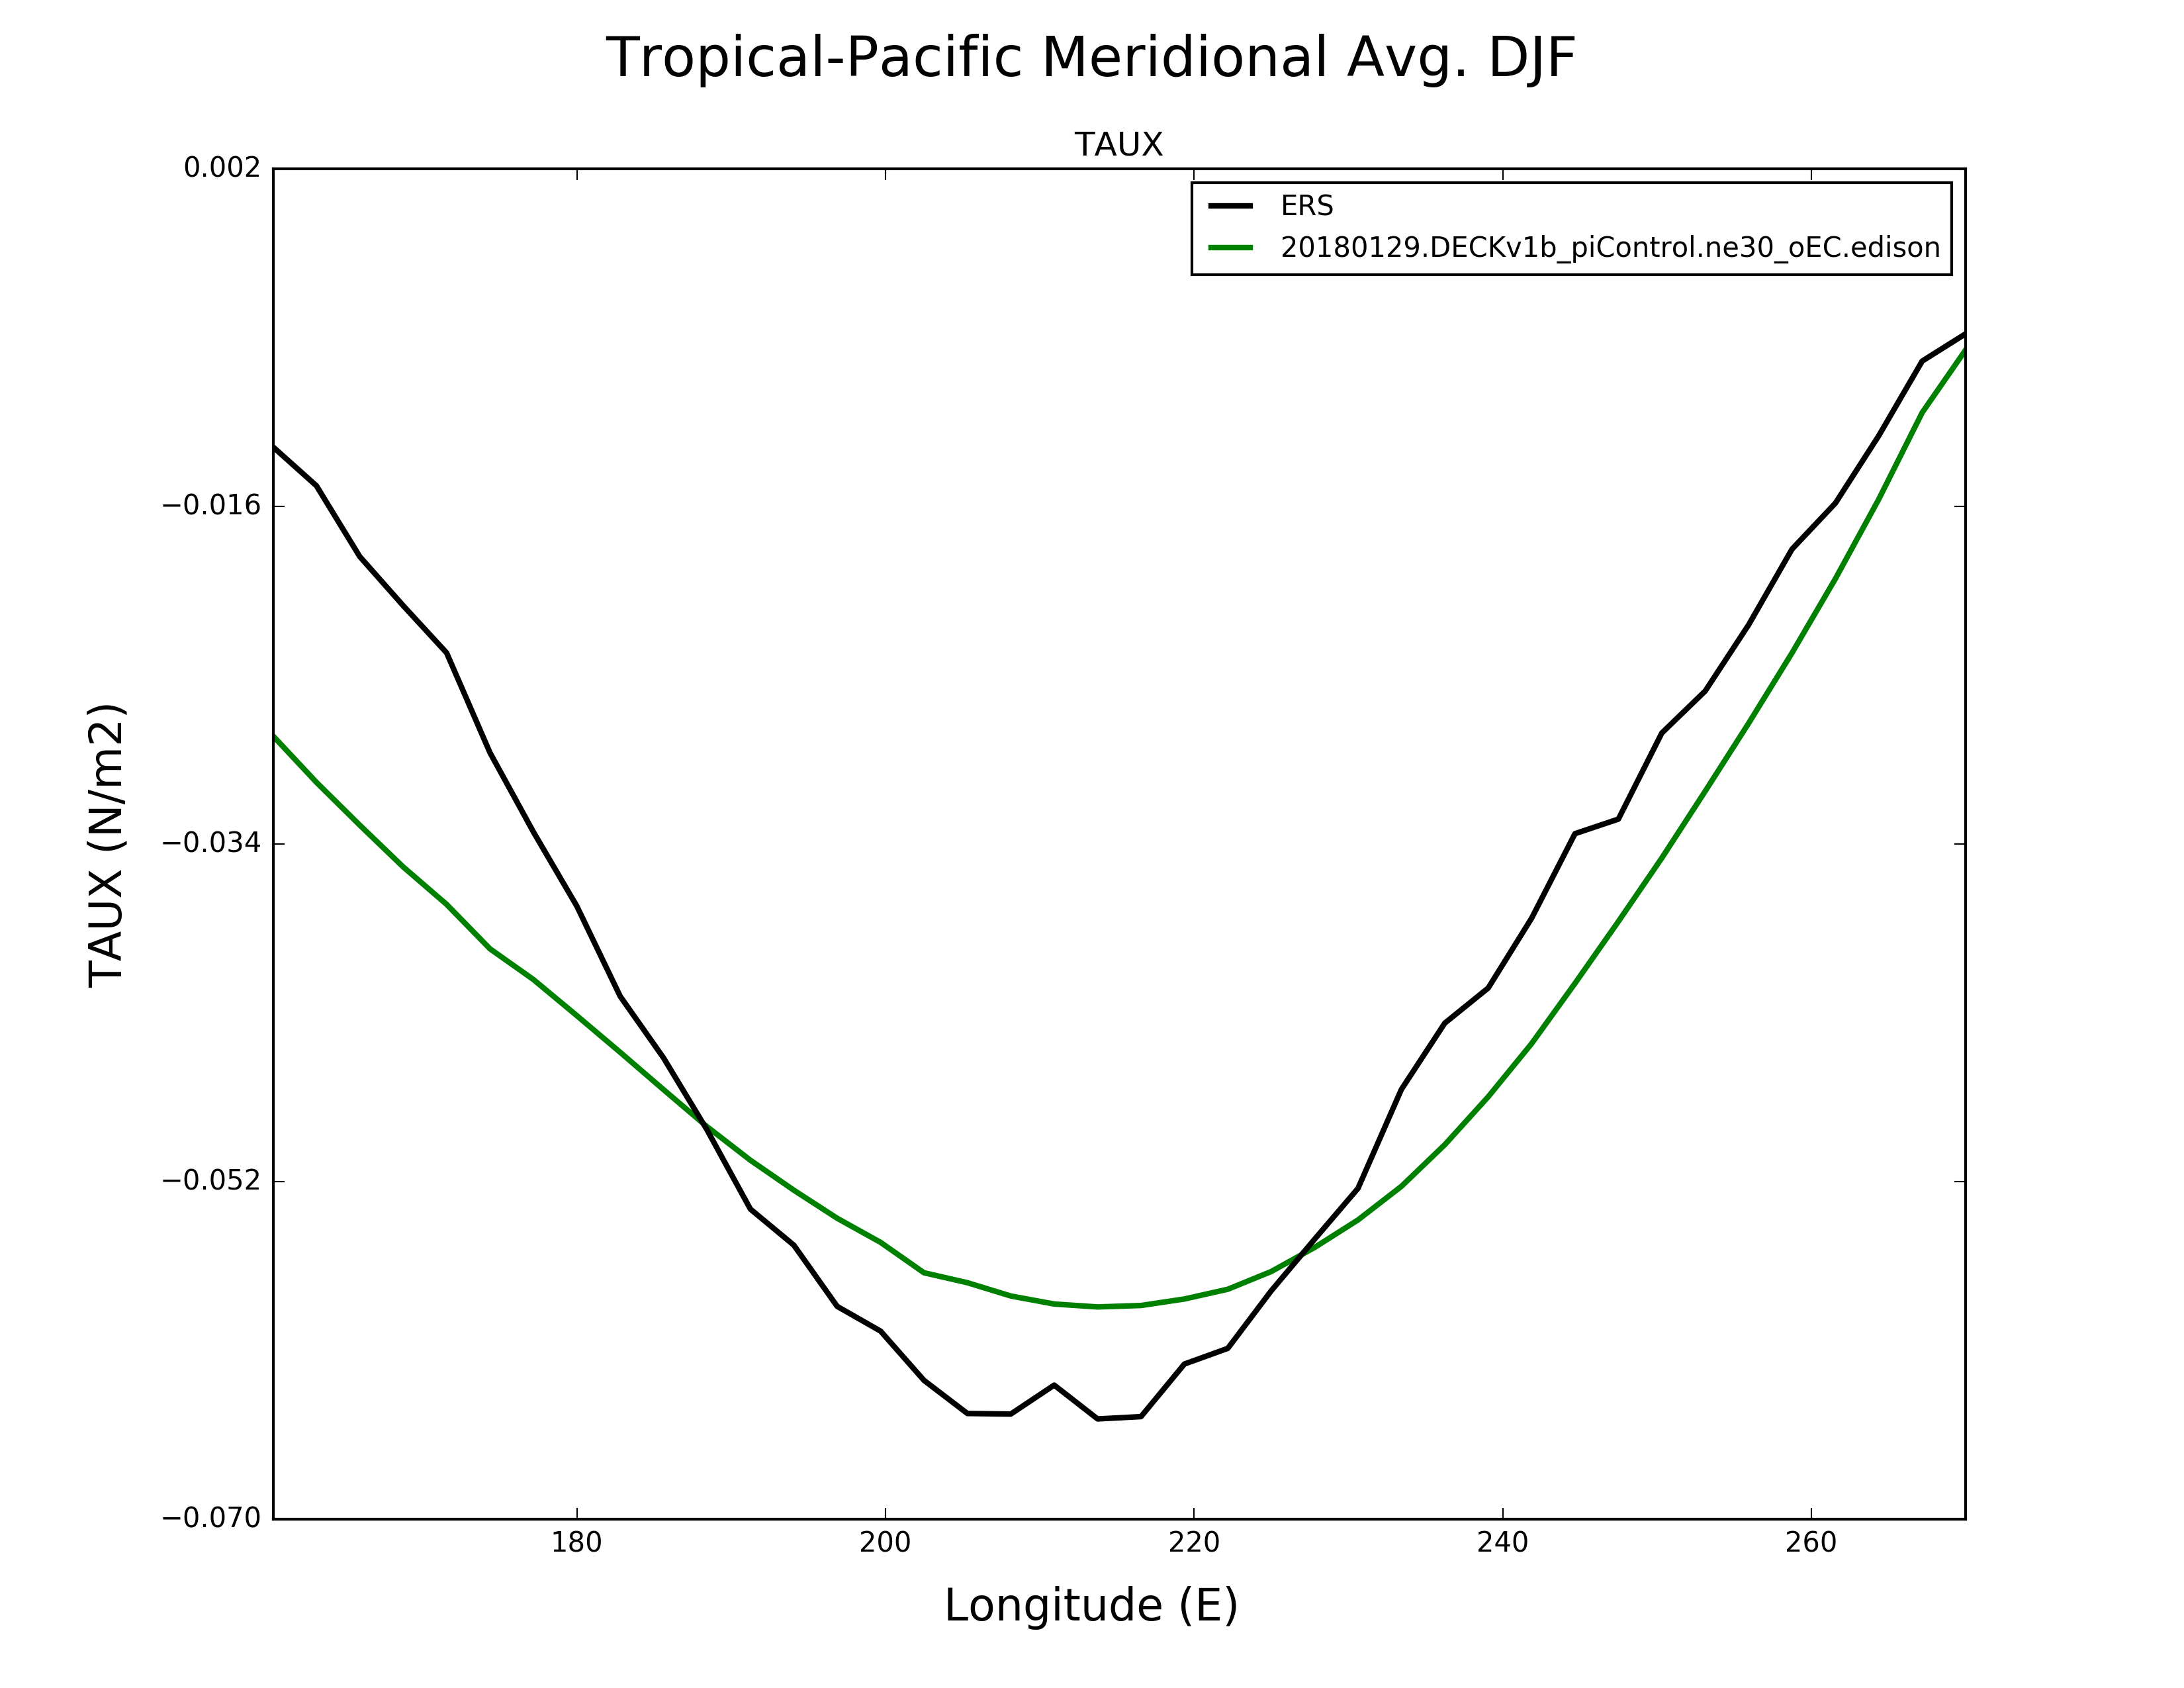
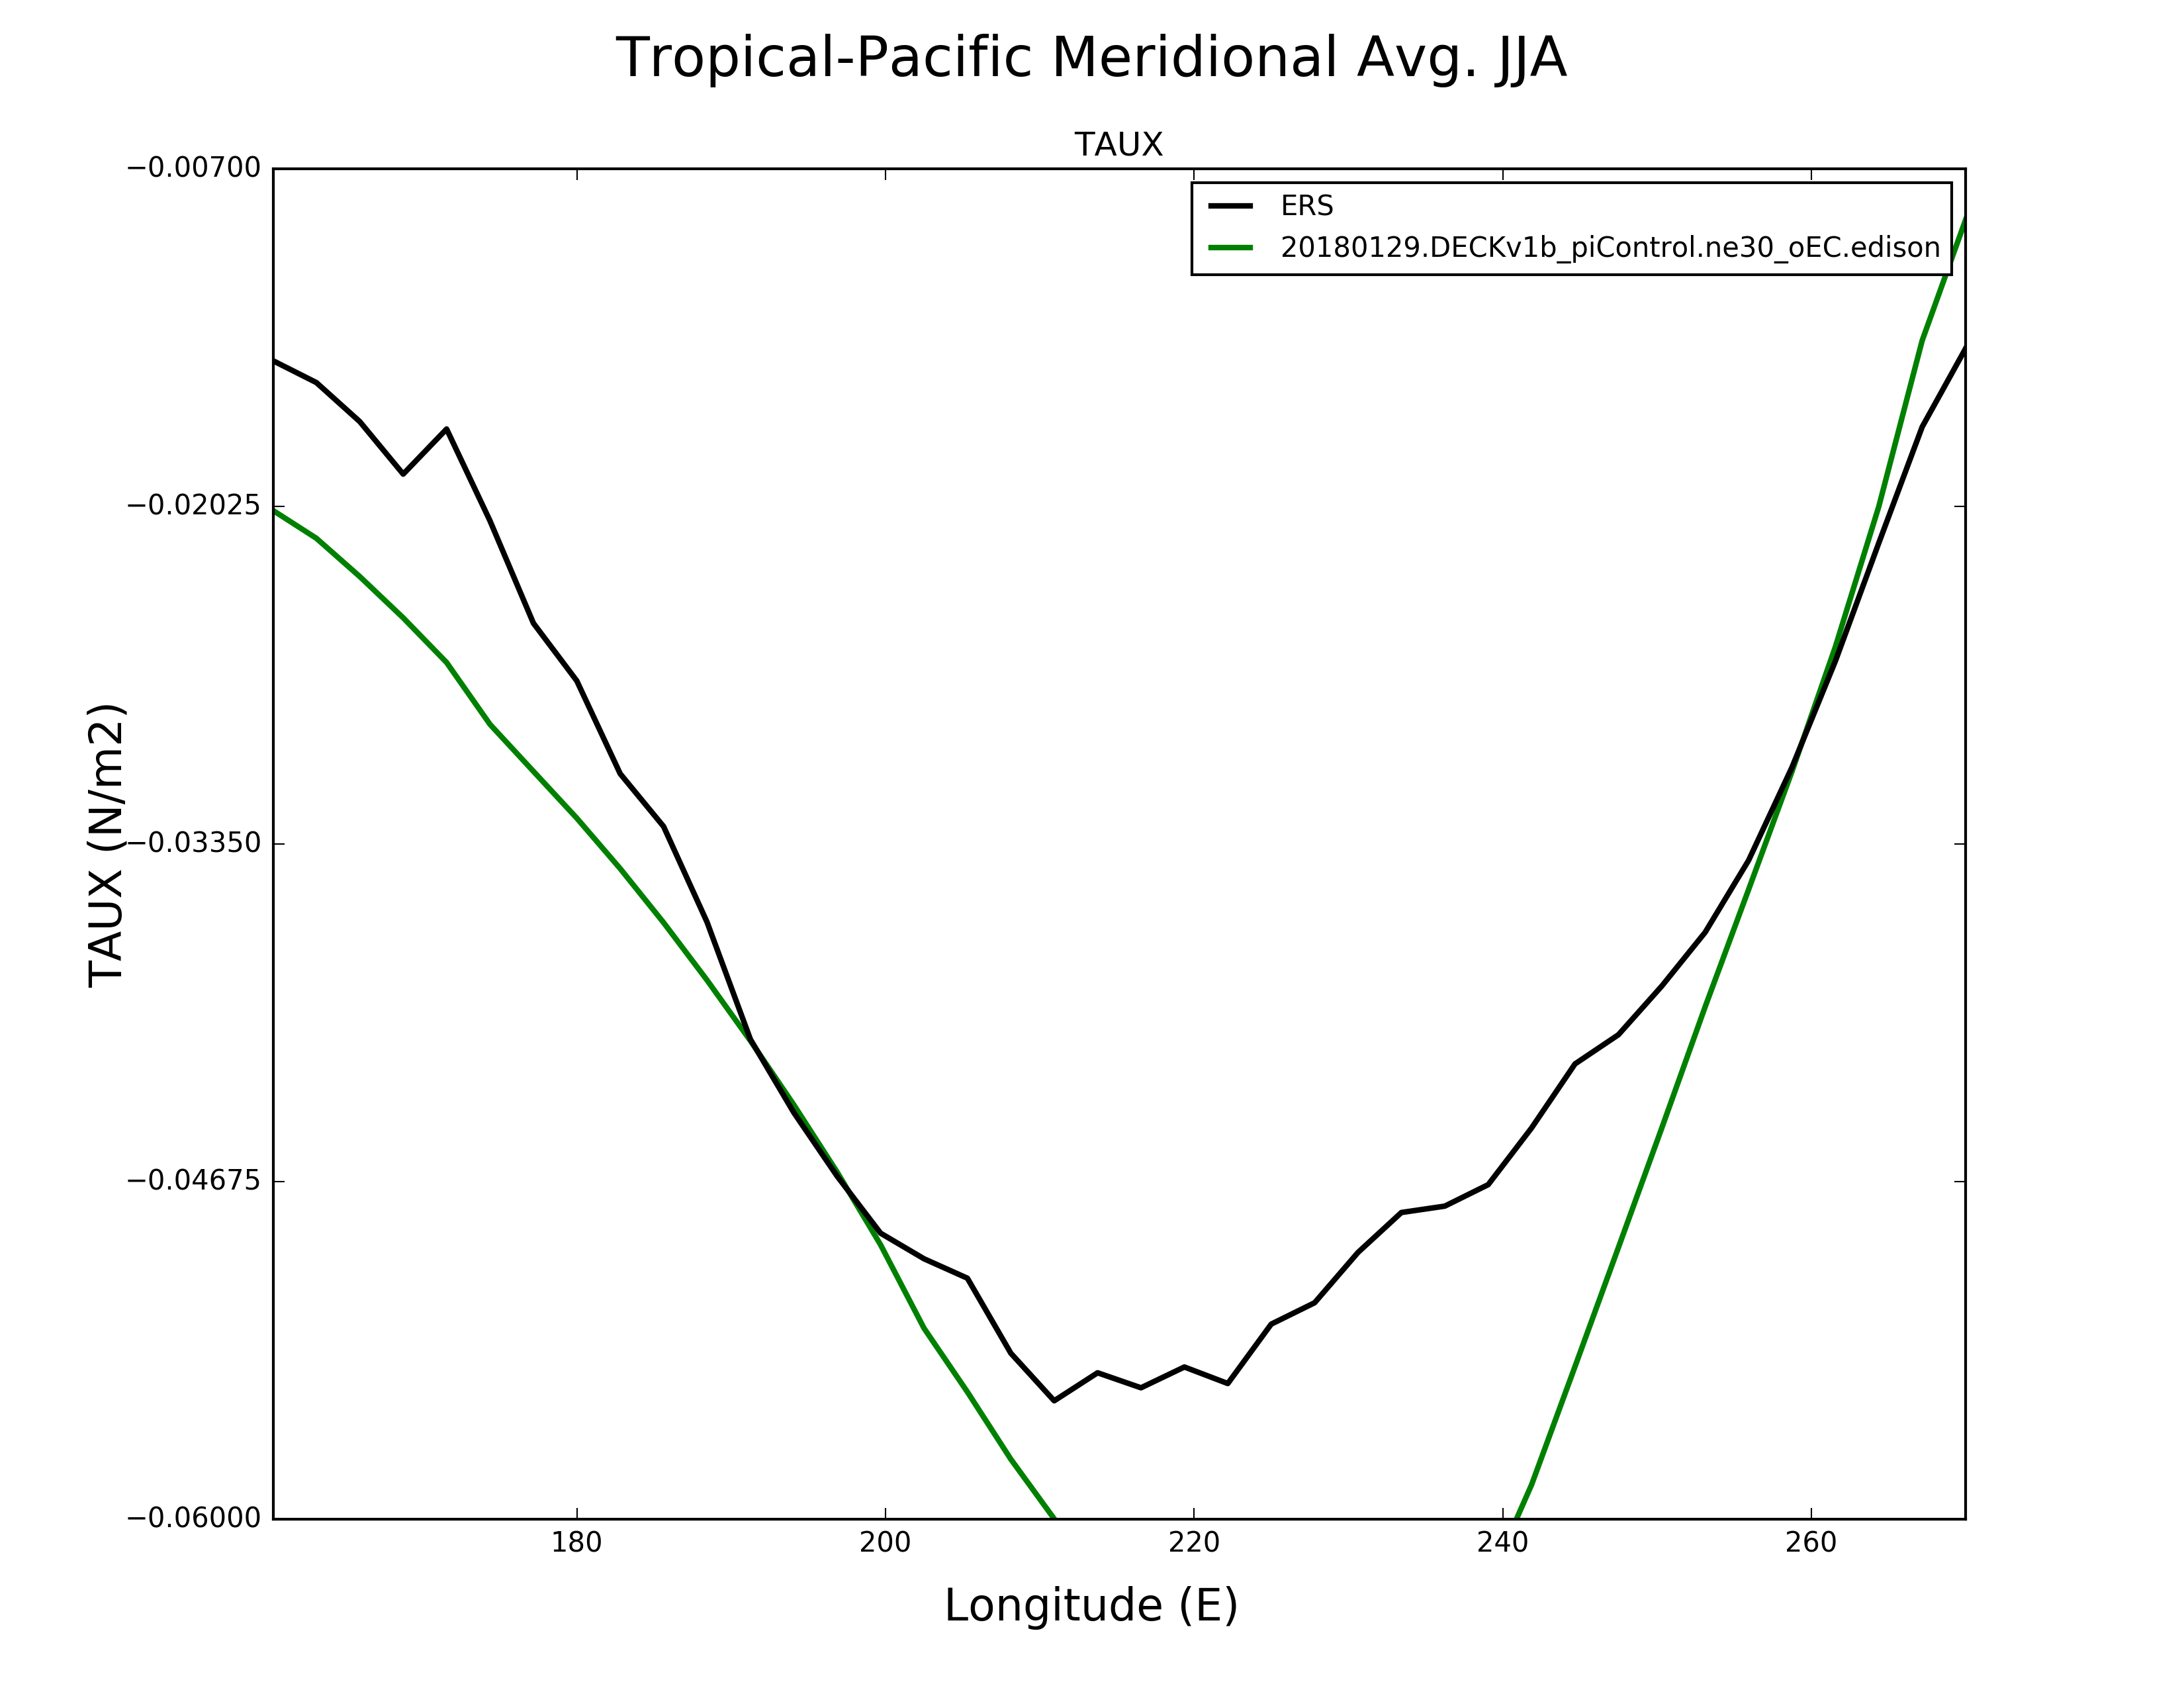
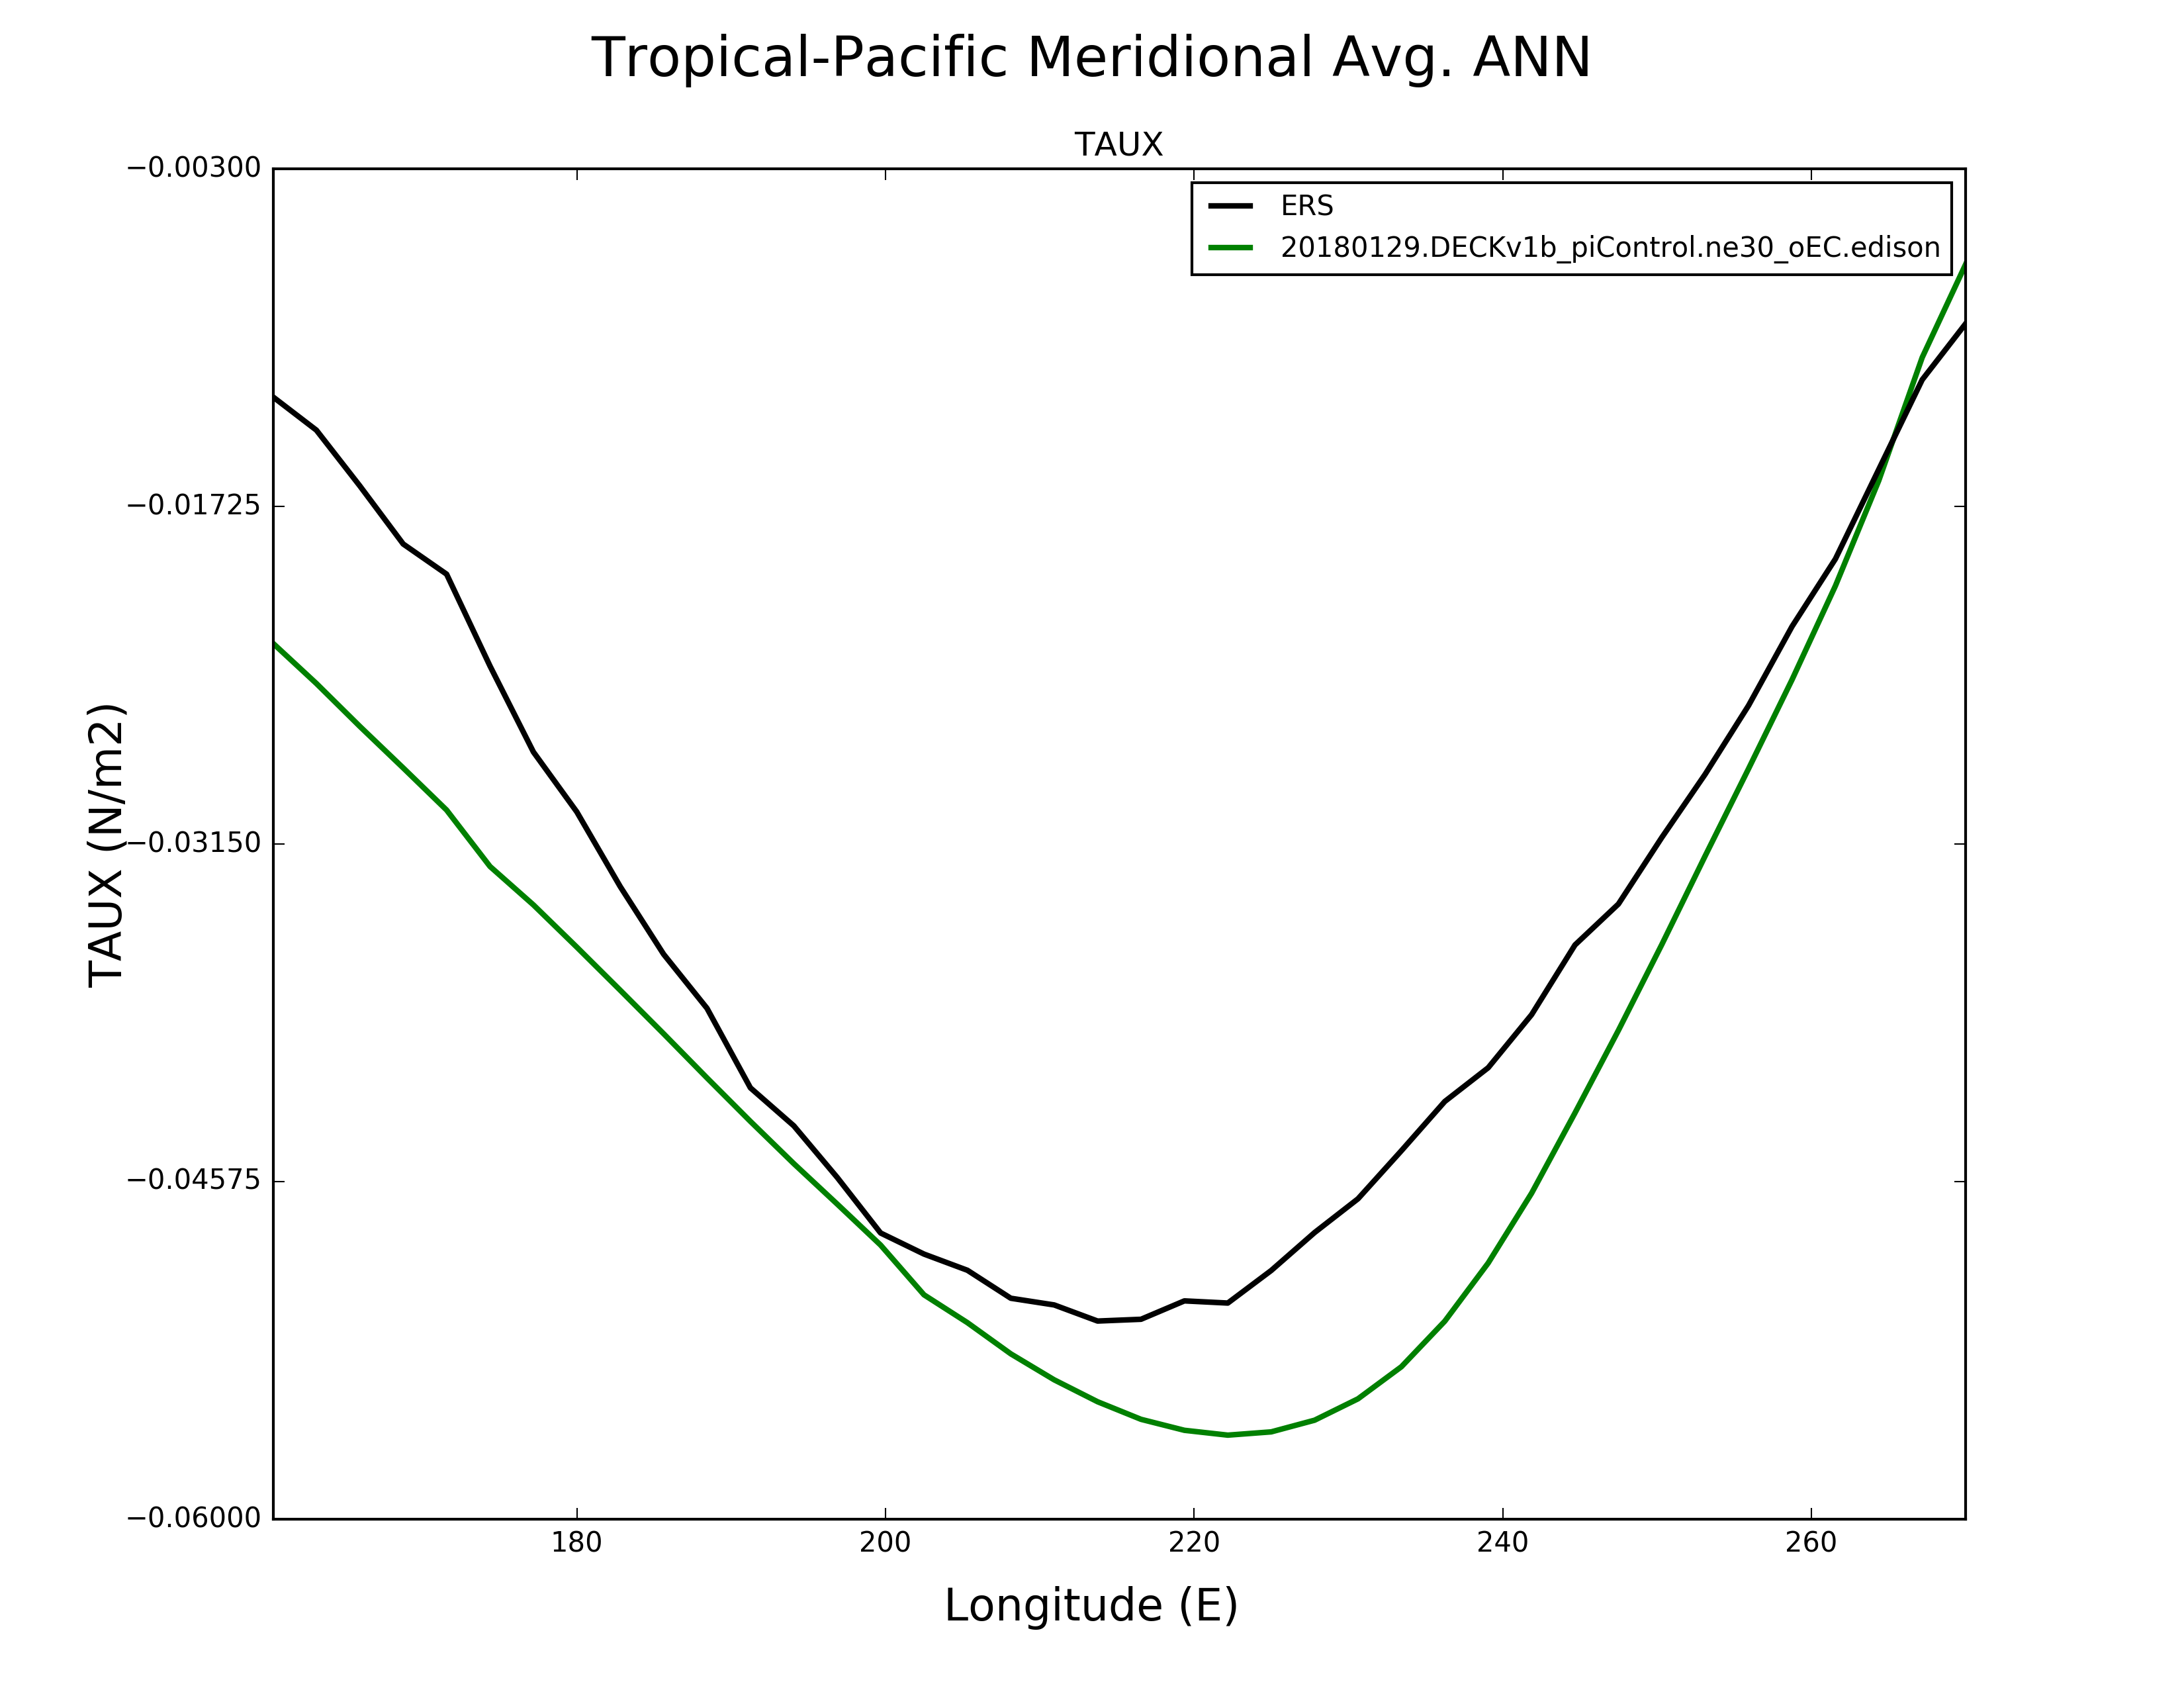
Meridional Avg. Over Tropical Pacific (5S-5N)
| Precipitation (GPCP)
| DJF
| JJA
| ANN
|
| PRECT
| Precipitation Rate
| plot
| plot
| plot
|
|
| Temperature (HadISST)
| DJF
| JJA
| ANN
|
| TS
| Surface Temperature
| plot
| plot
| plot
|
|
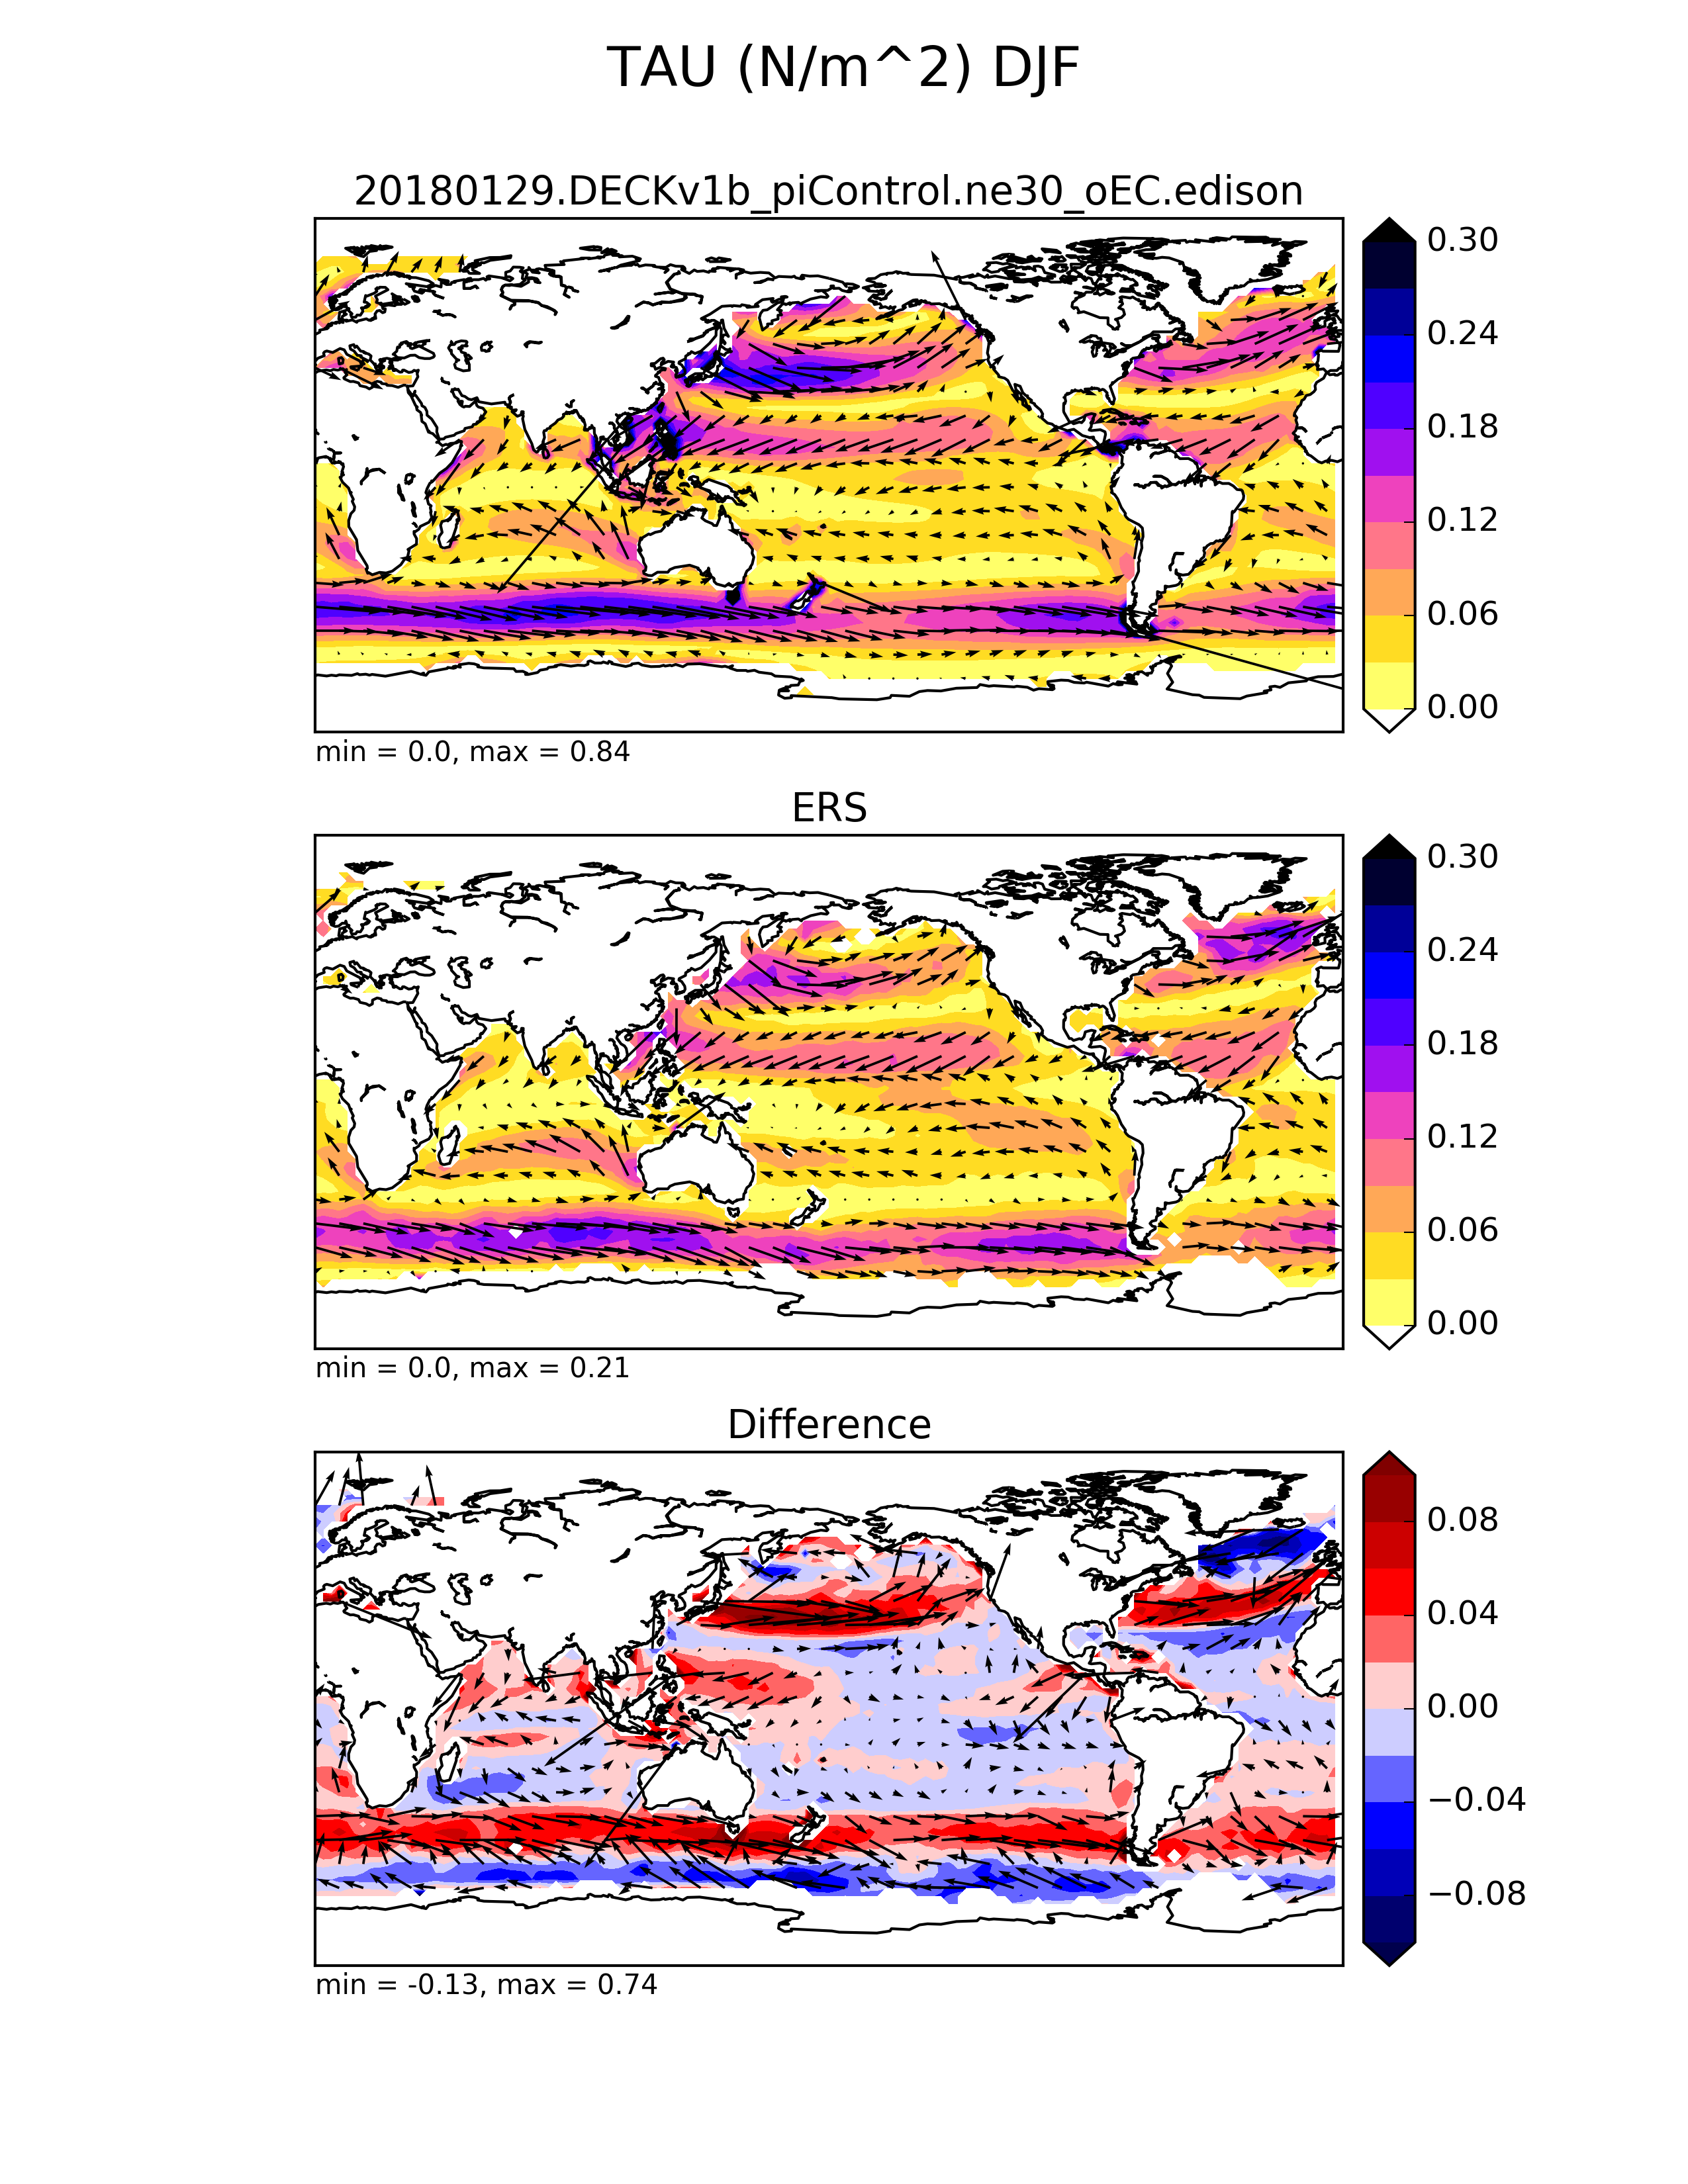
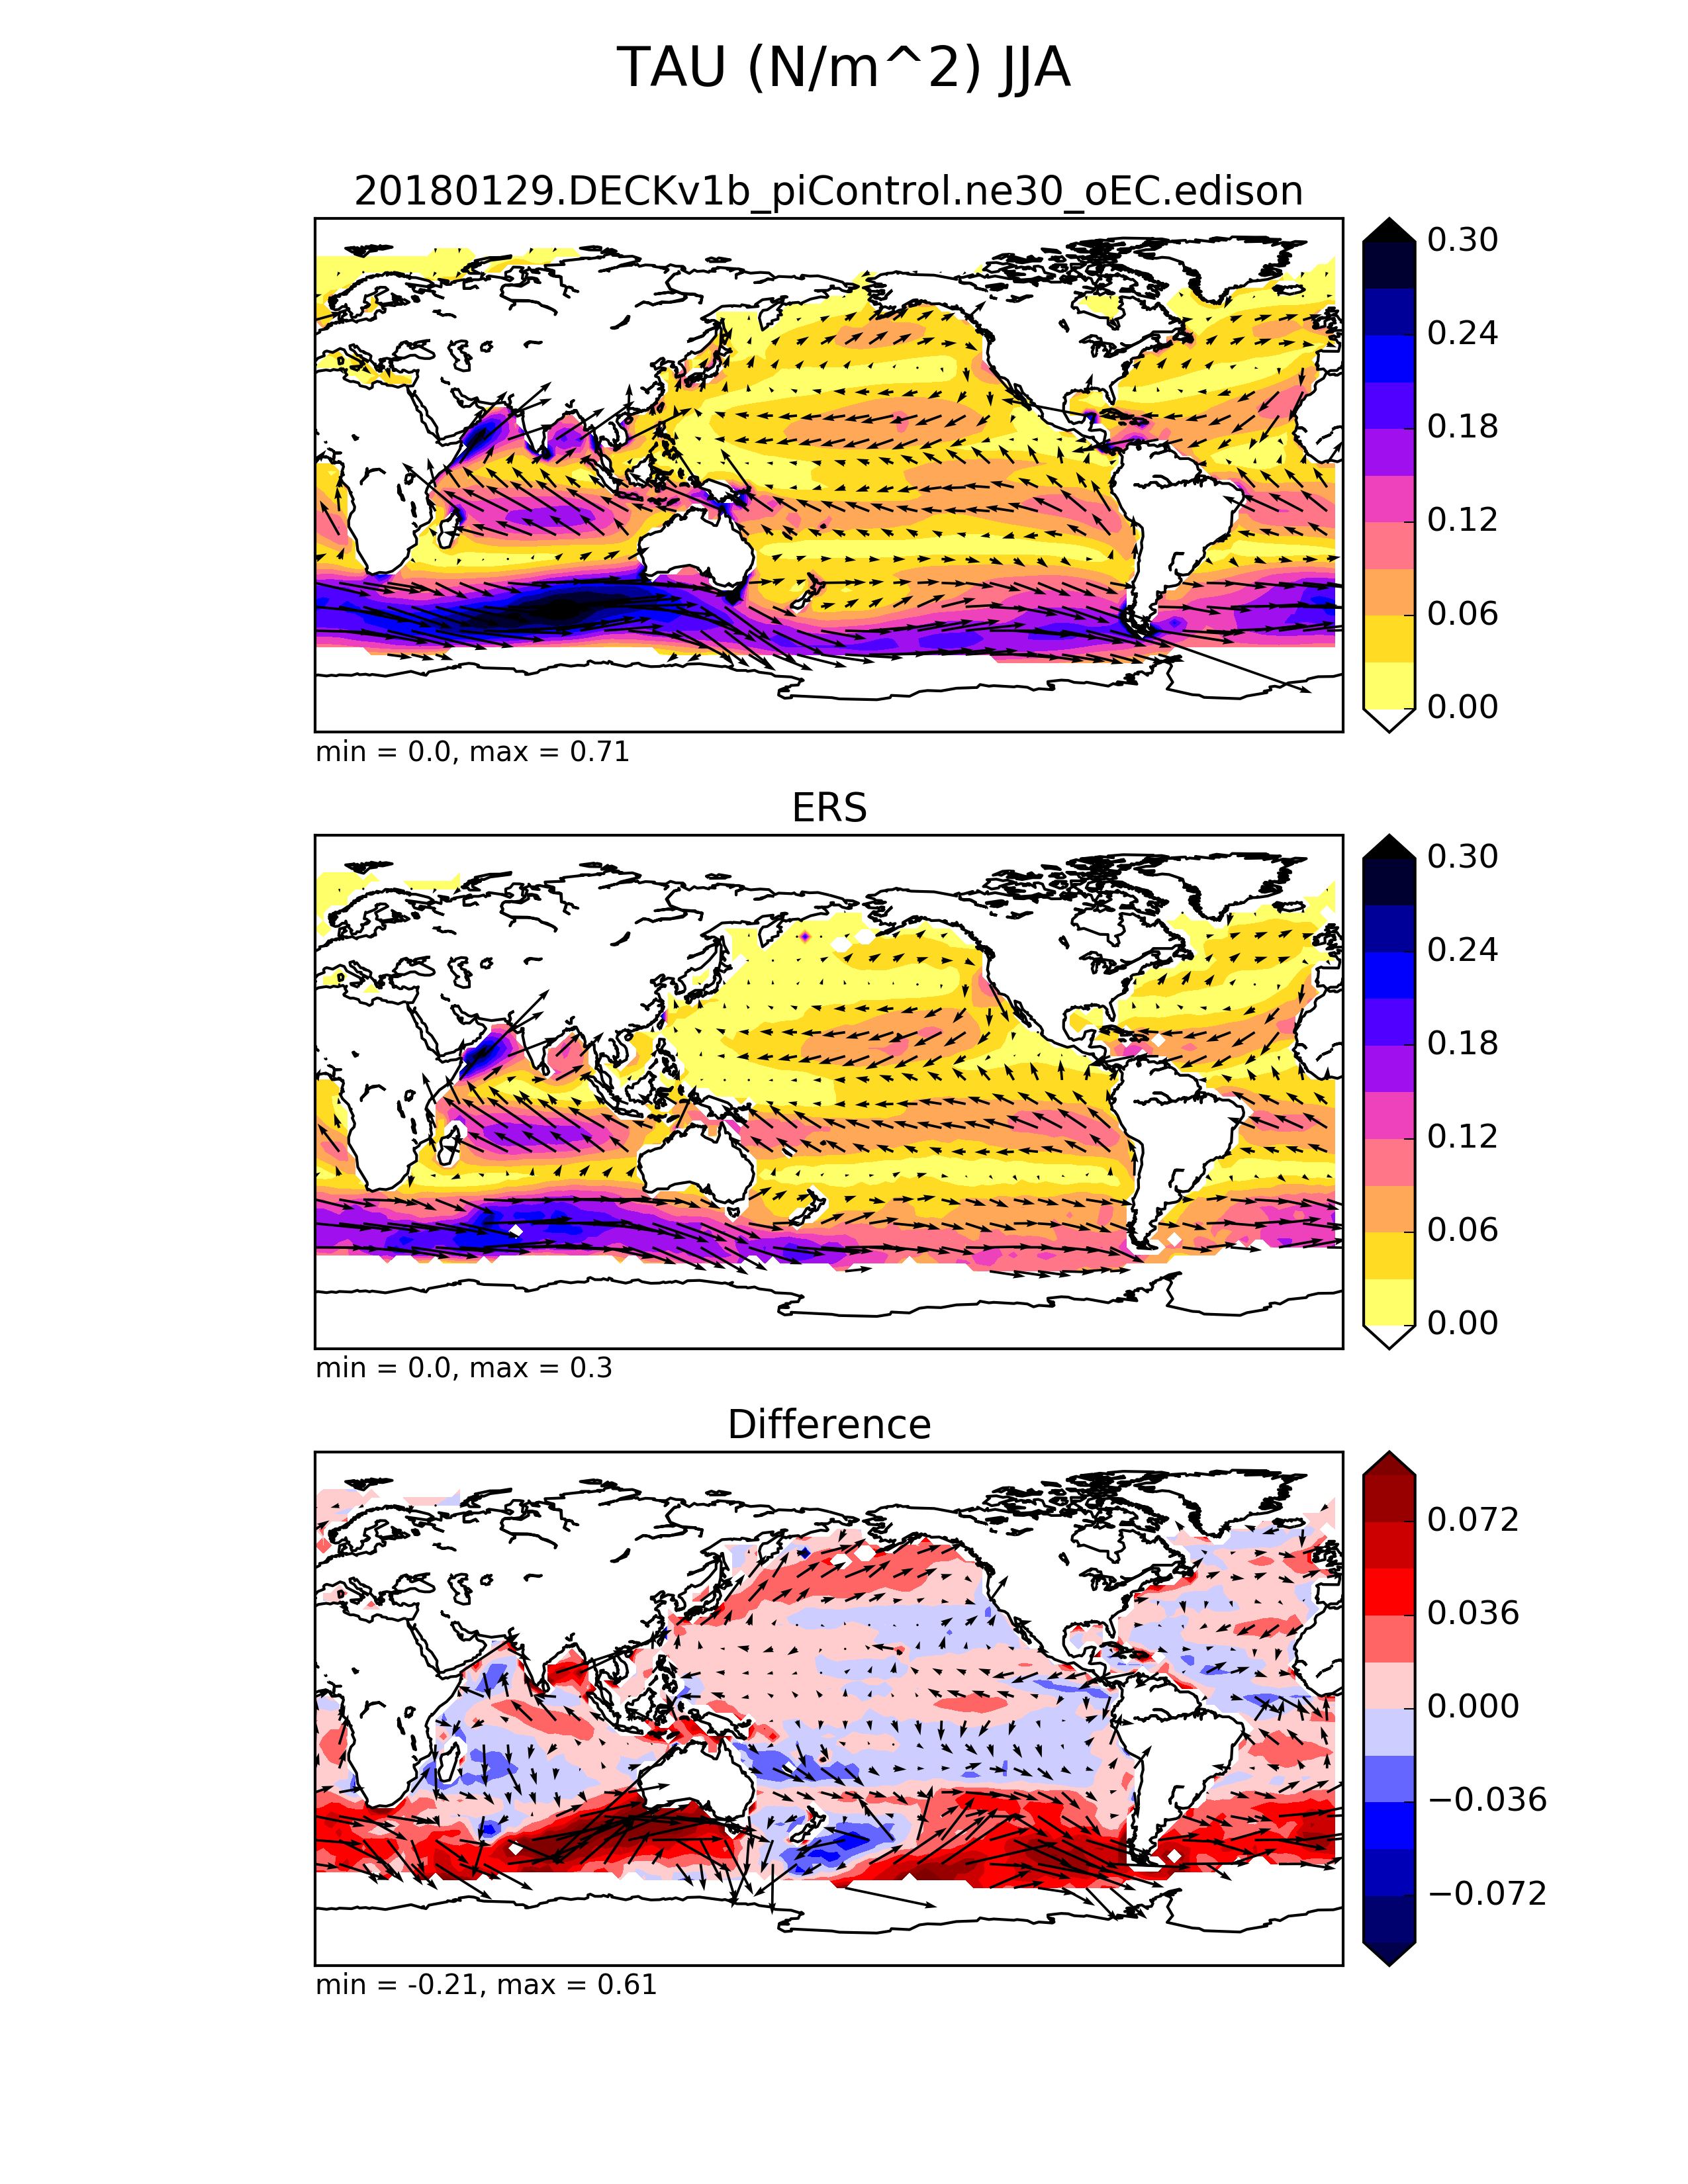
| Wind Stress (ERS)
| DJF
| JJA
| ANN
|
| TAUX
| Ocean Zonal Wind Stress
| plot
| plot
| plot
|
|
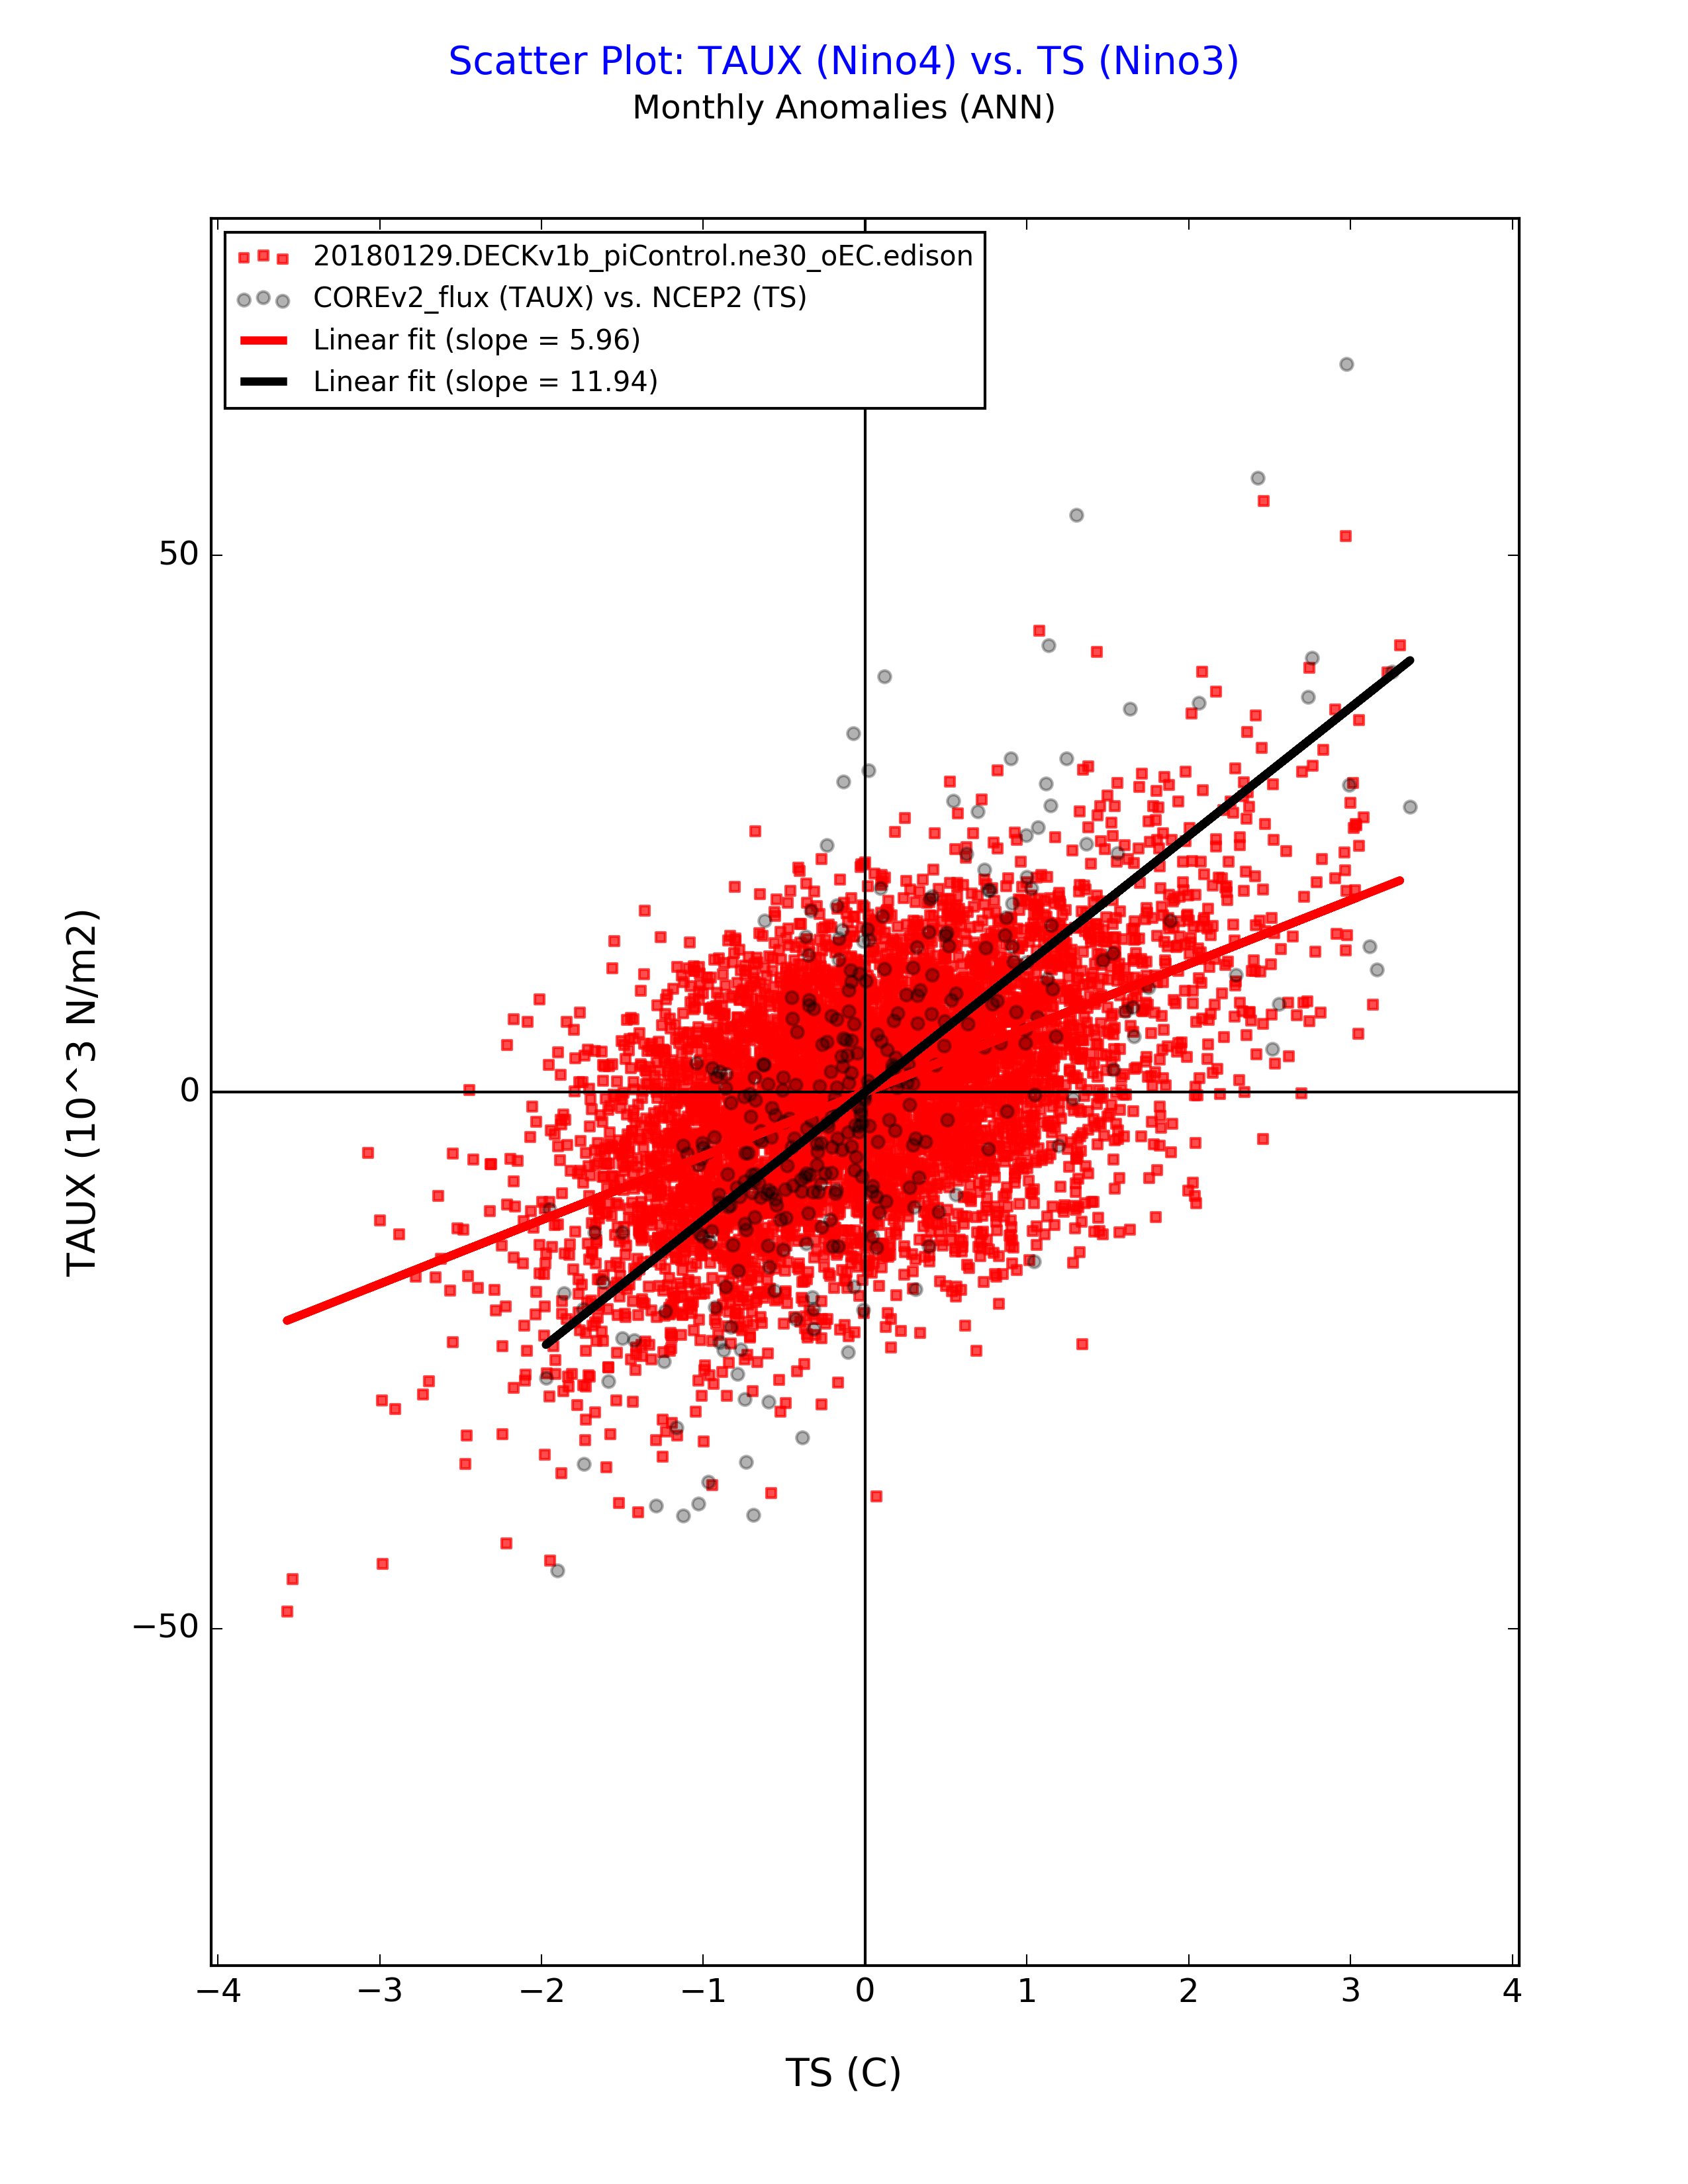
Bjerknes Feedback: (Nino4 TAUX vs. Nino3 SST)
| Wind Stress (COREv2_flux)
| Scatter Plot
|
| TAUX
| Ocean Zonal Wind Stress
| plot
|
|
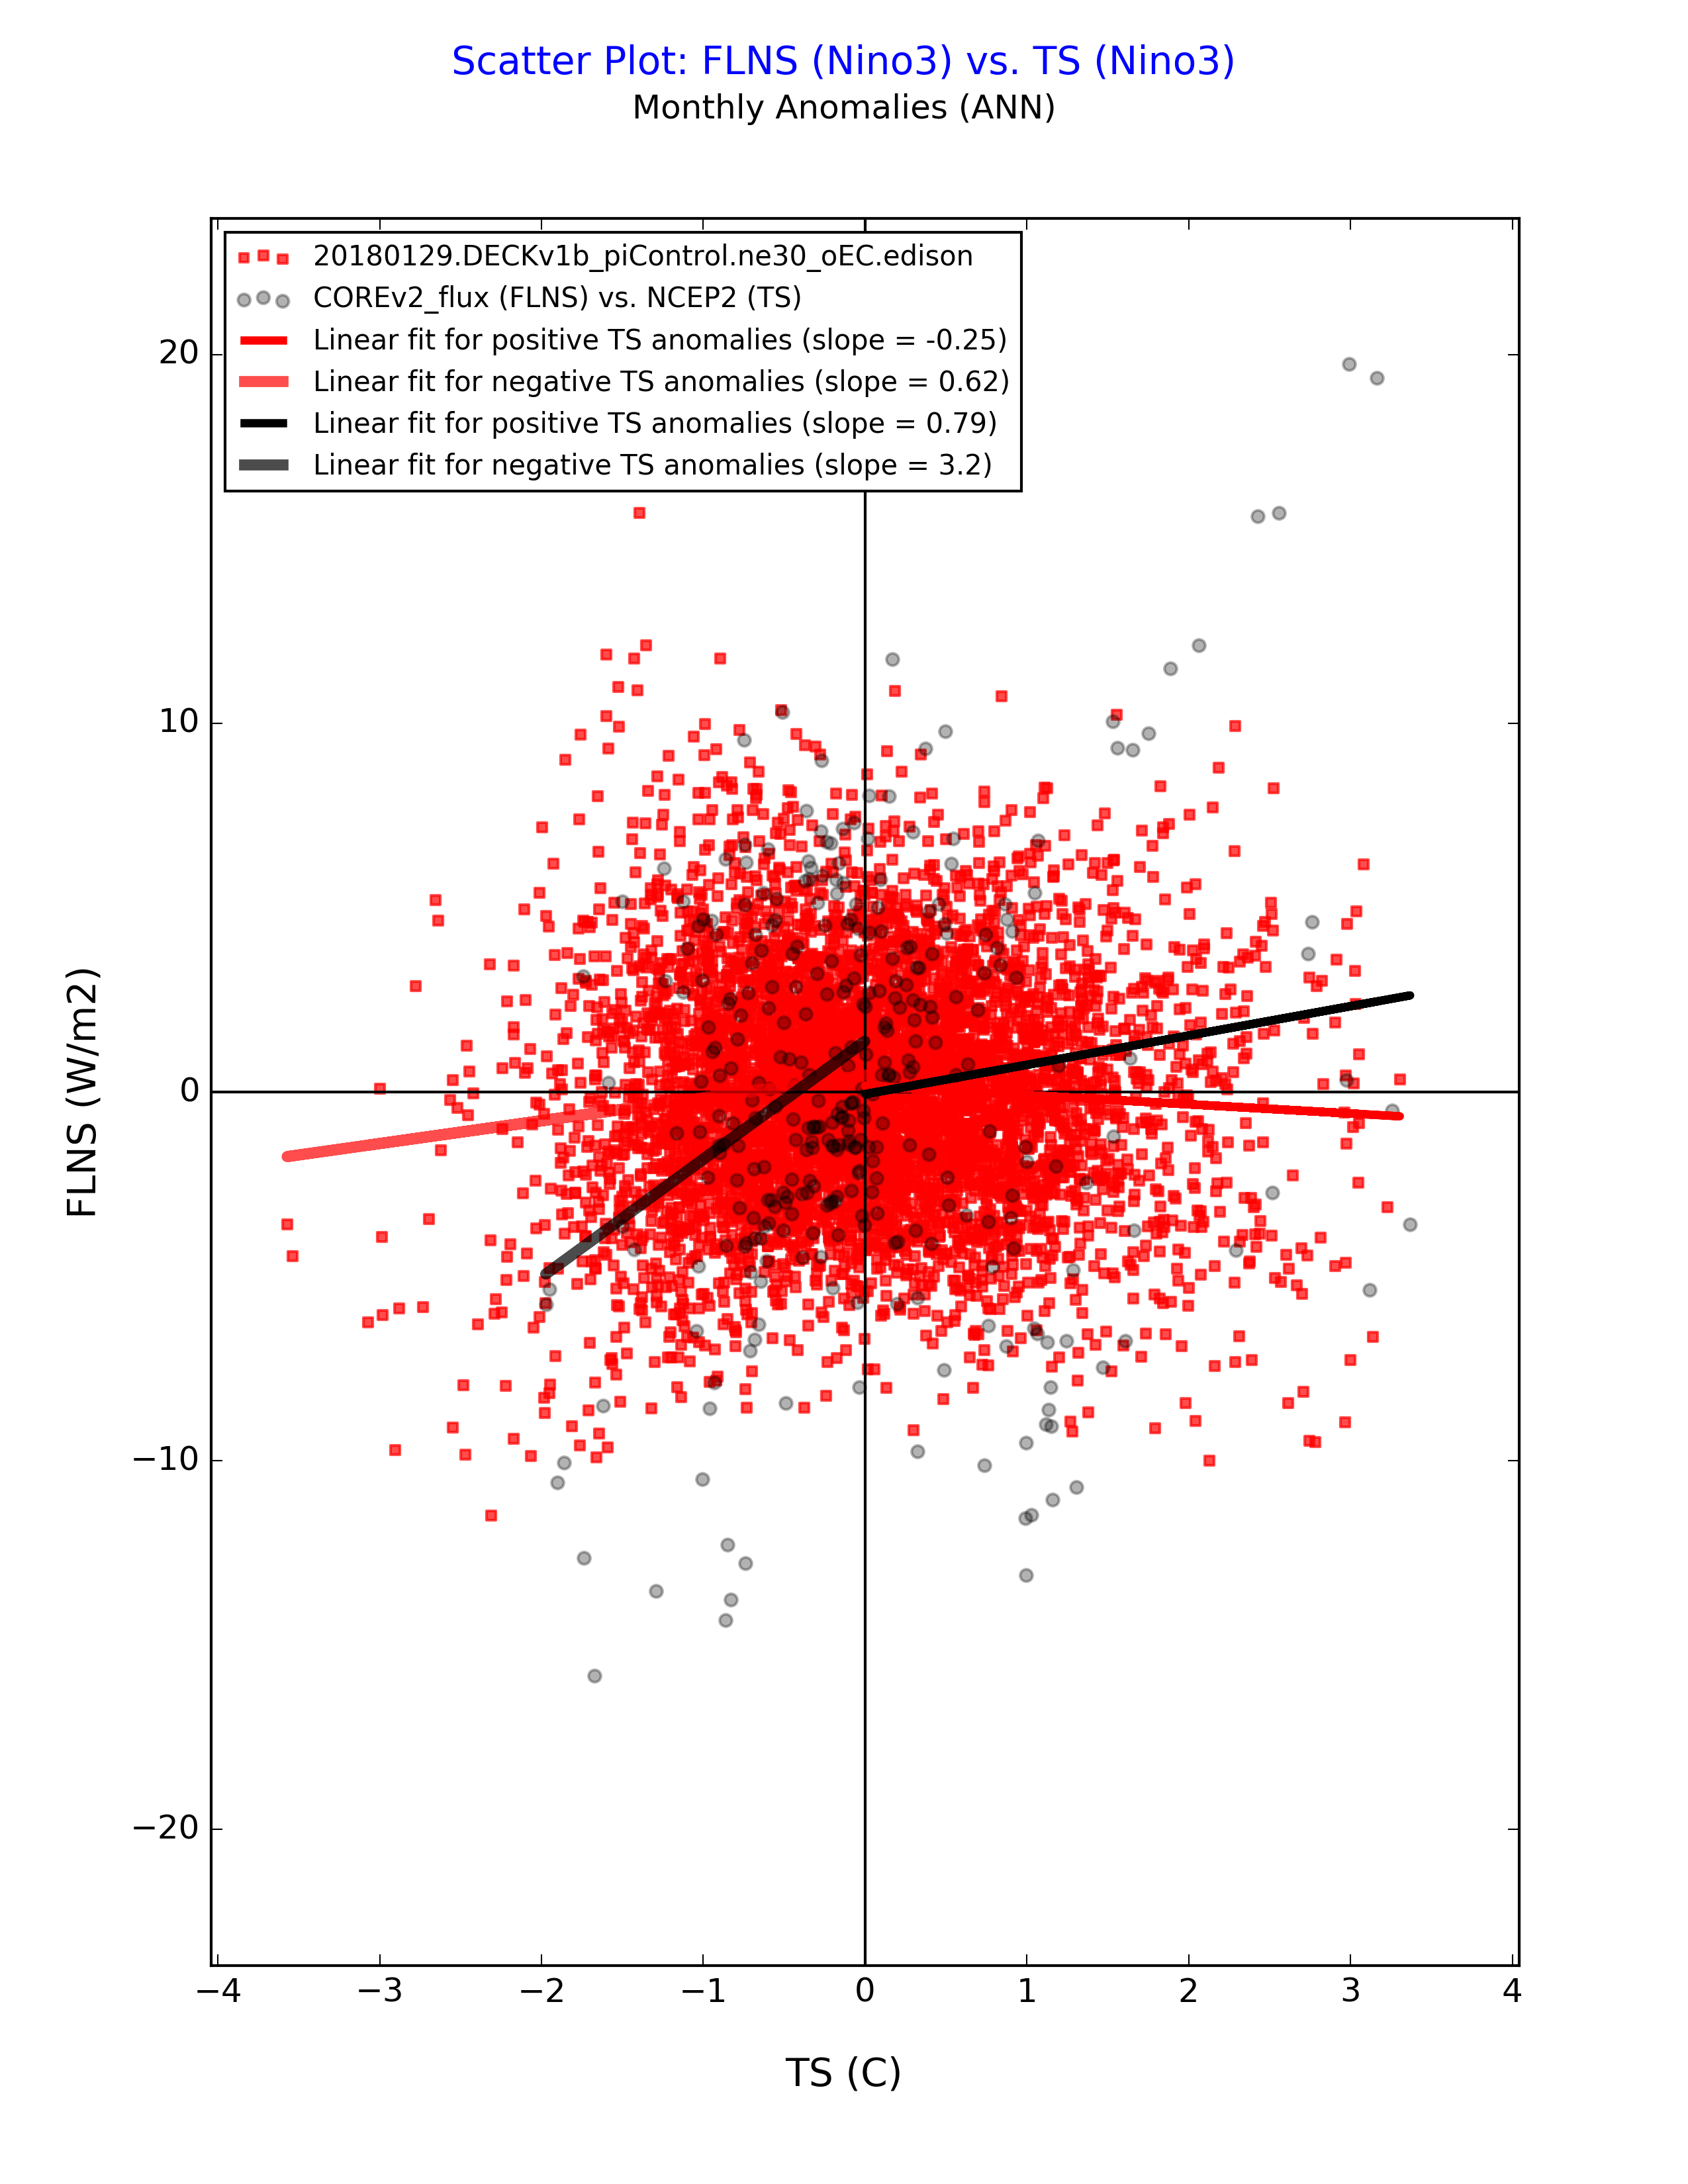
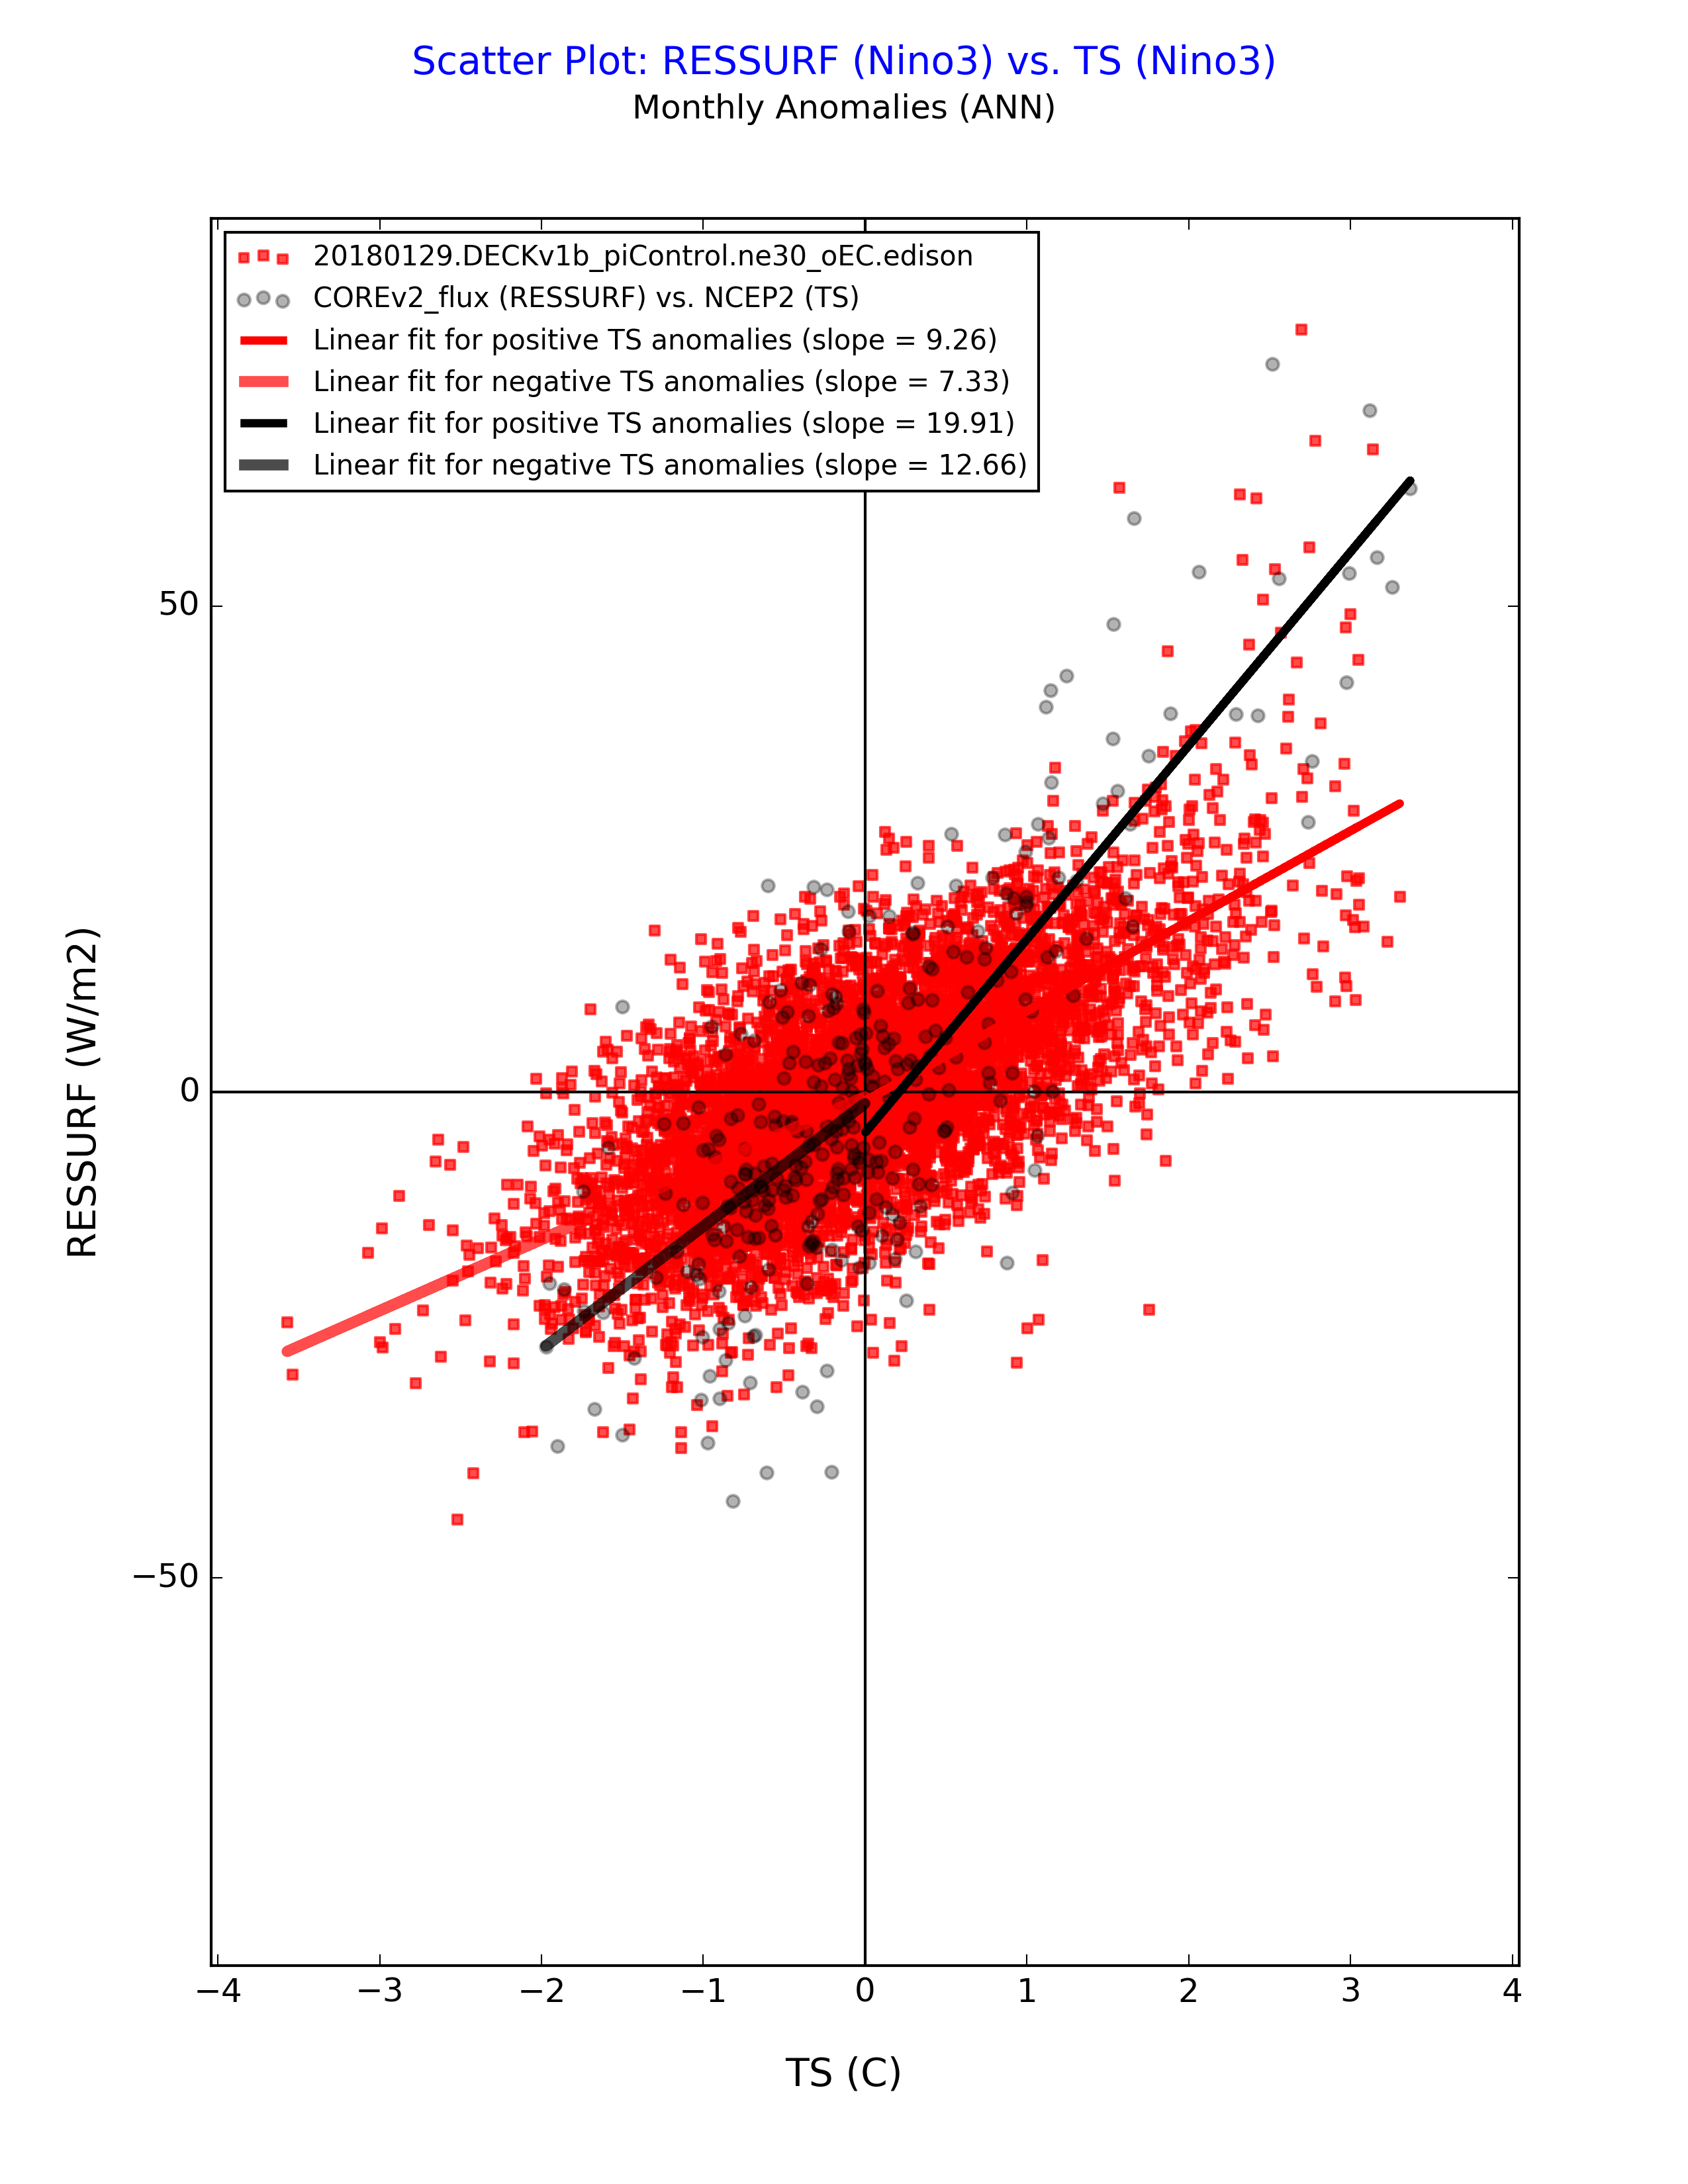
Heat Flux-SST Feedbacks: Nino3 Region
| Surface Heat Flux (COREv2_flux)
| Scatter Plot
|
| LHFLX
| Latent Heat Flux
| plot
|
| SHFLX
| Sensible Heat Flux
| plot
|
| FLNS
| Longwave Heat Flux
| plot
|
| FSNS
| Shortwave Heat Flux
| plot
|
| RESSURF
| Surface Net Heat Flux
| plot
|
|
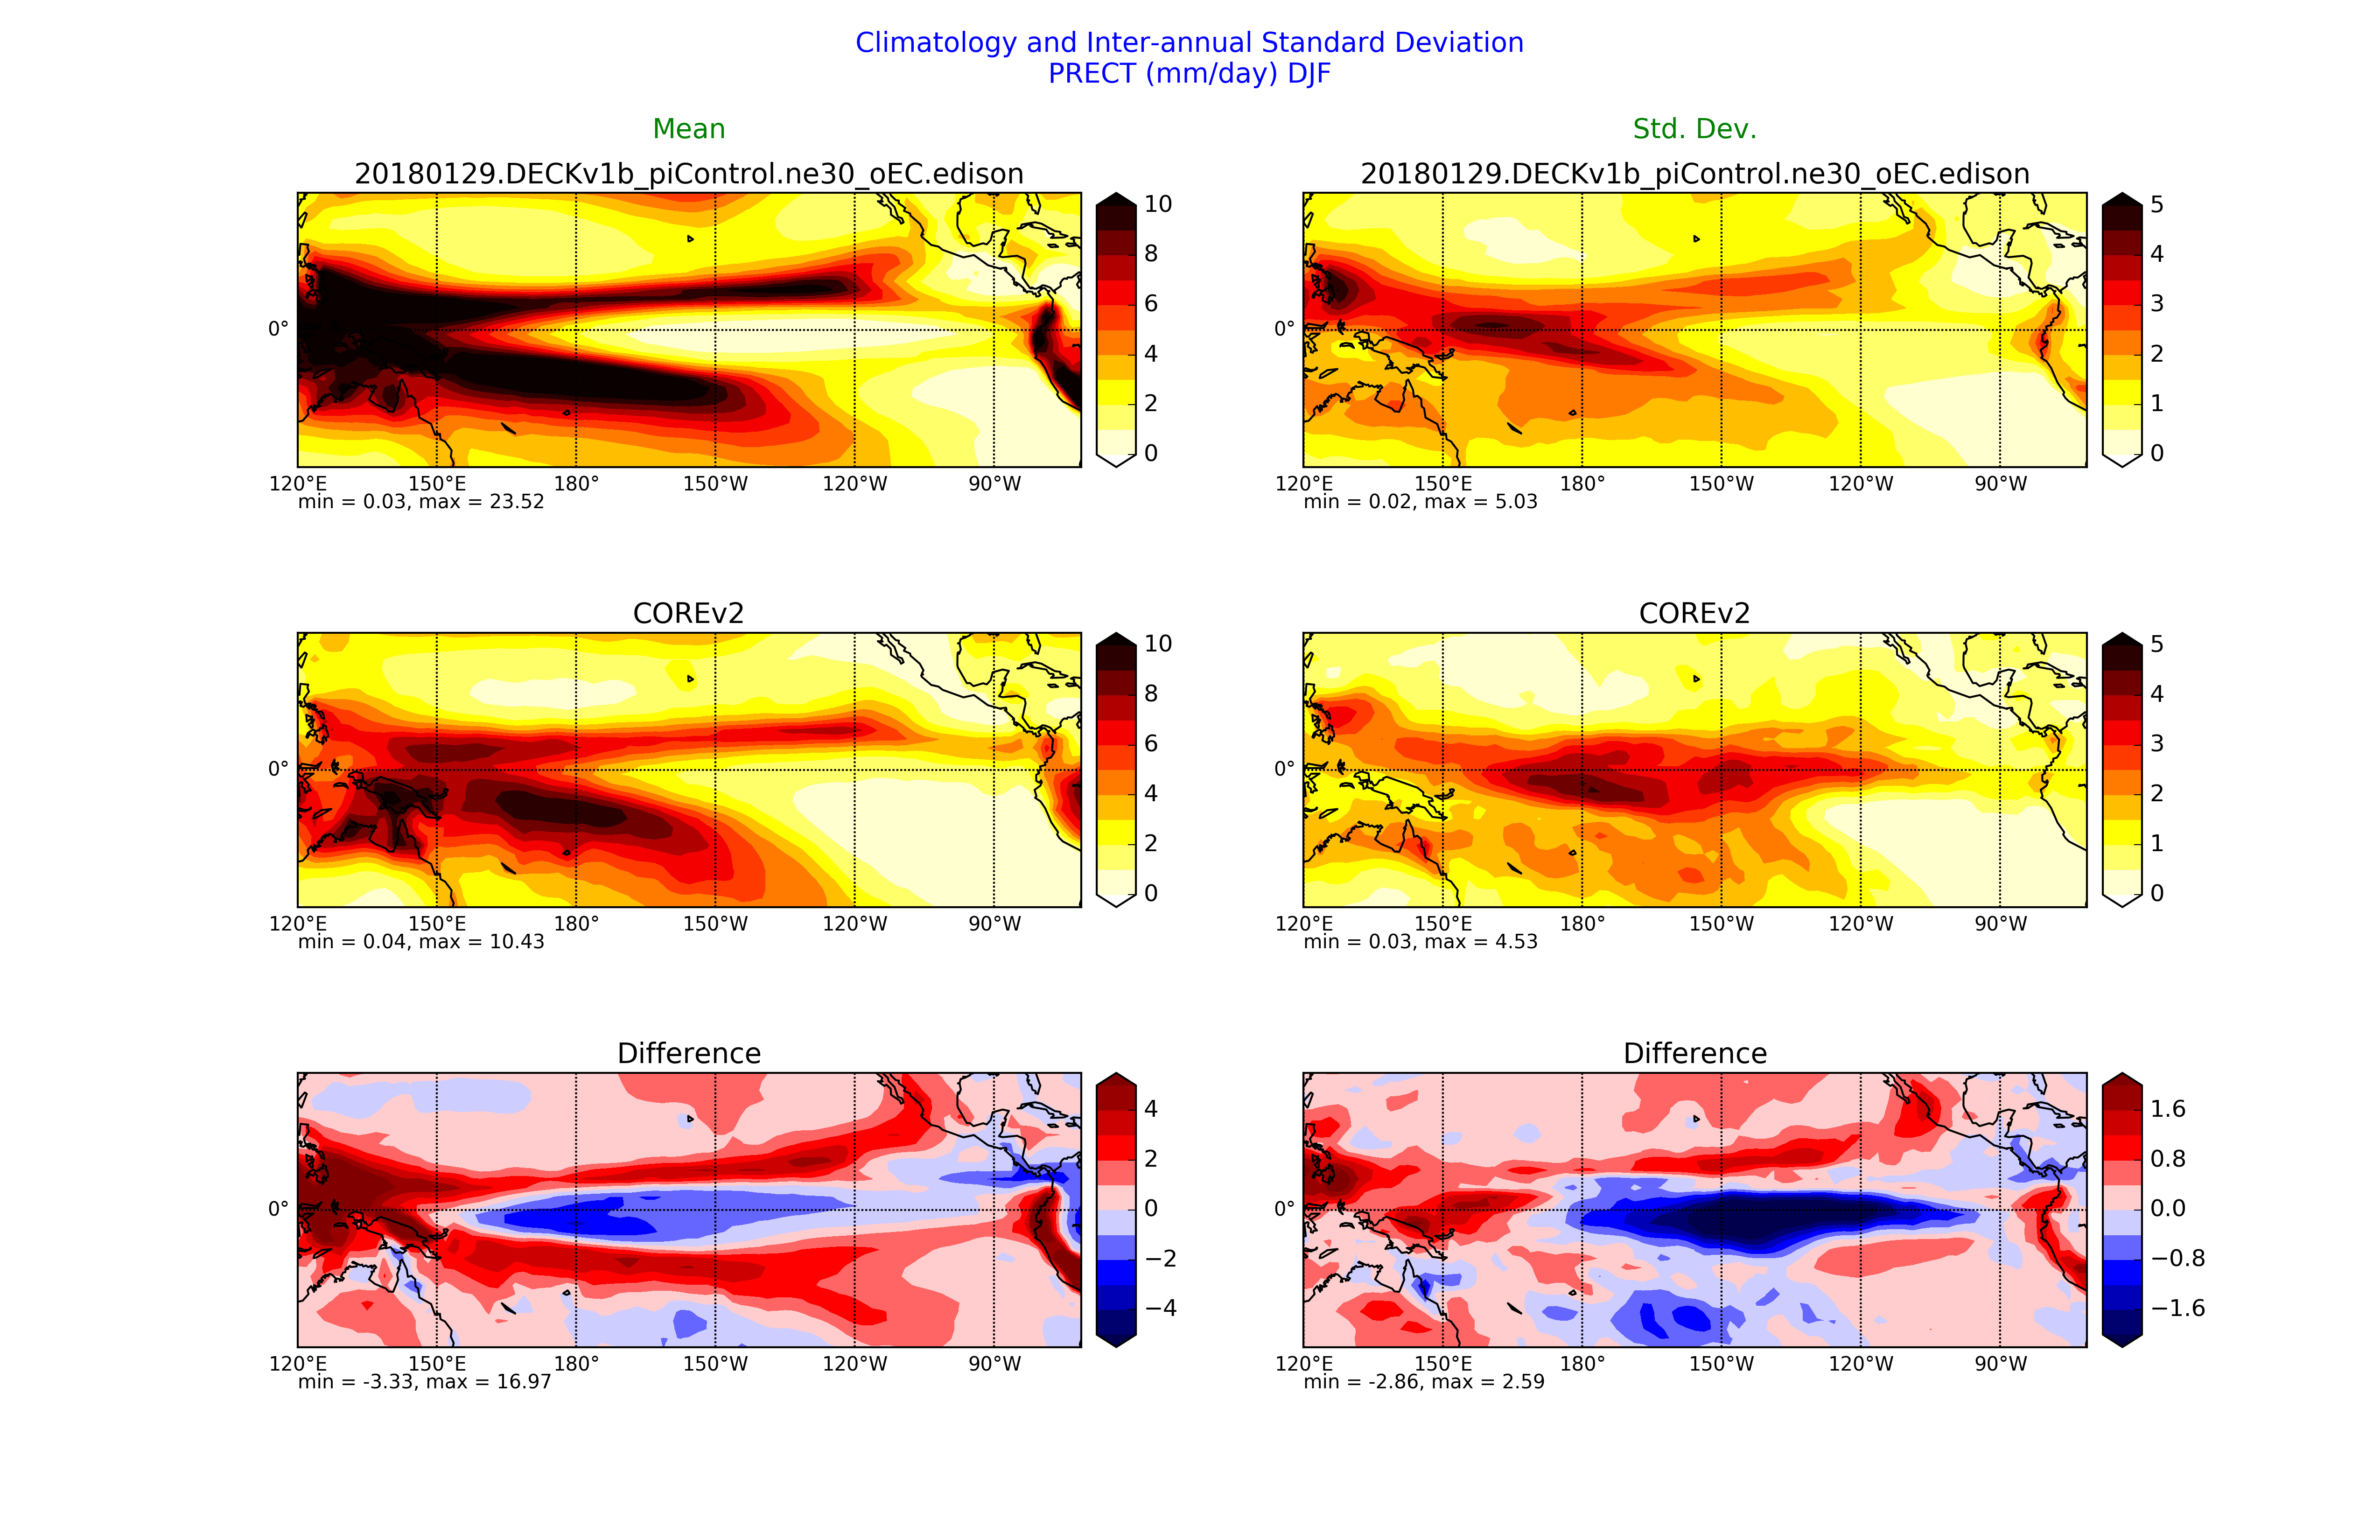
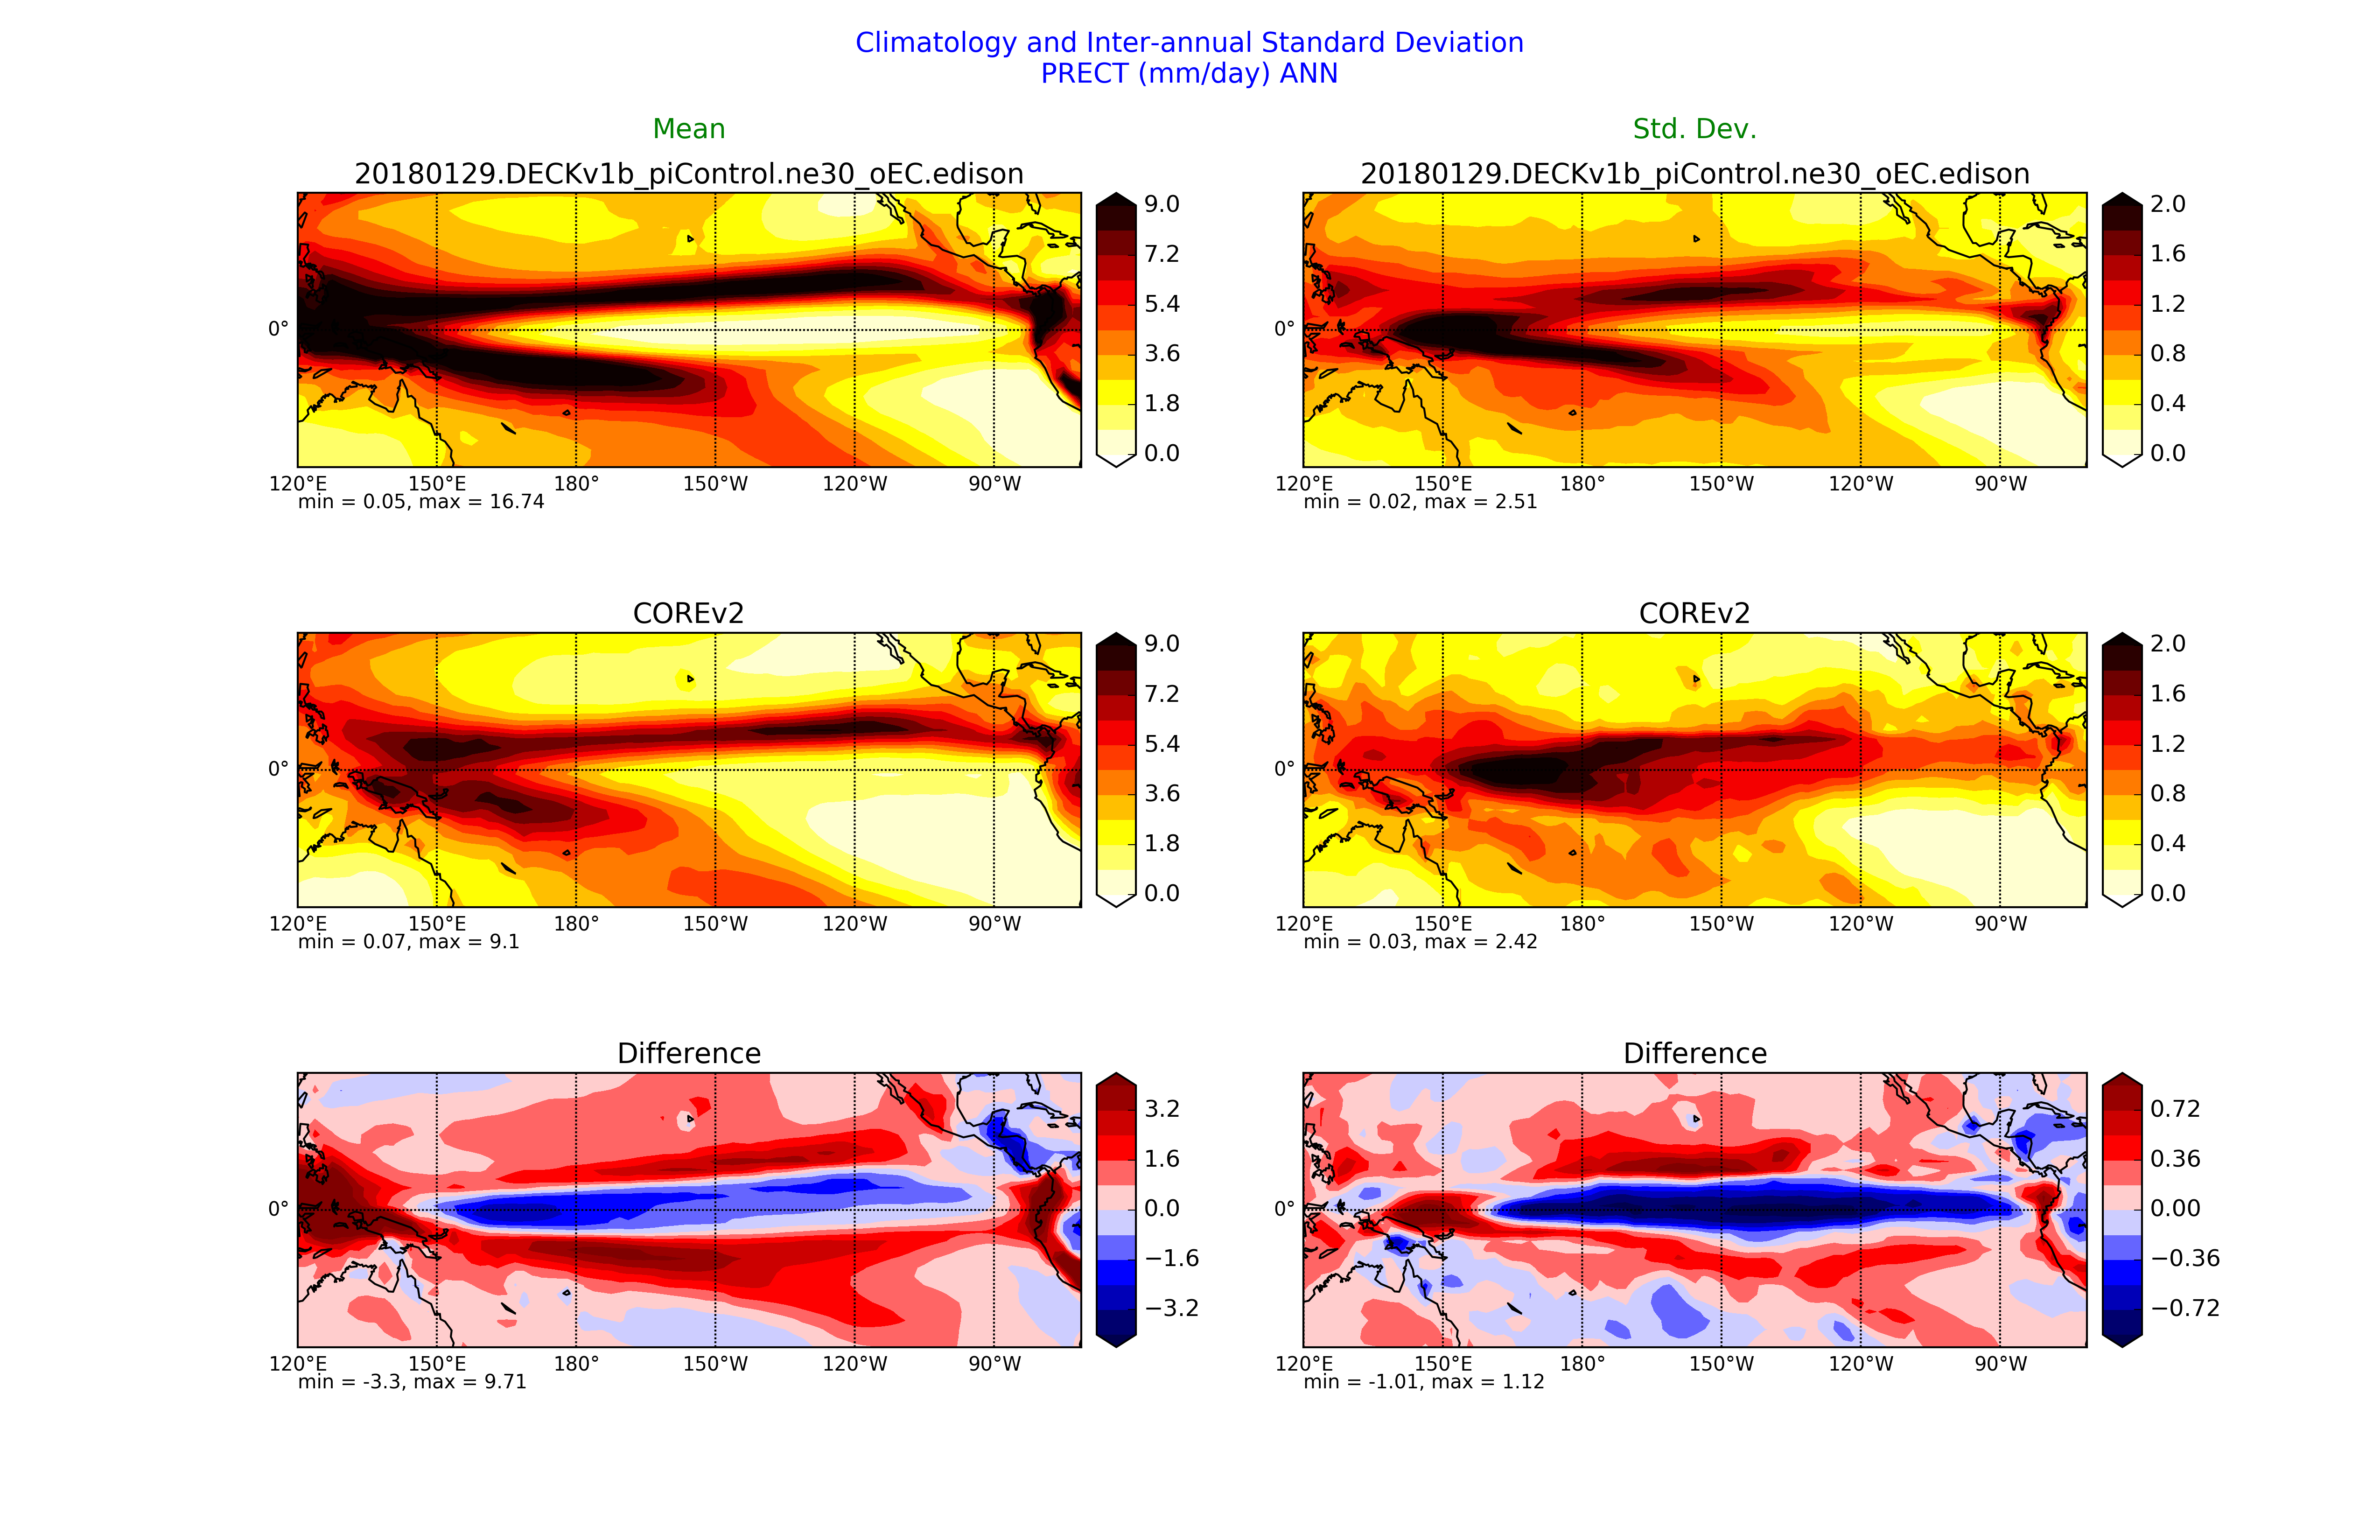
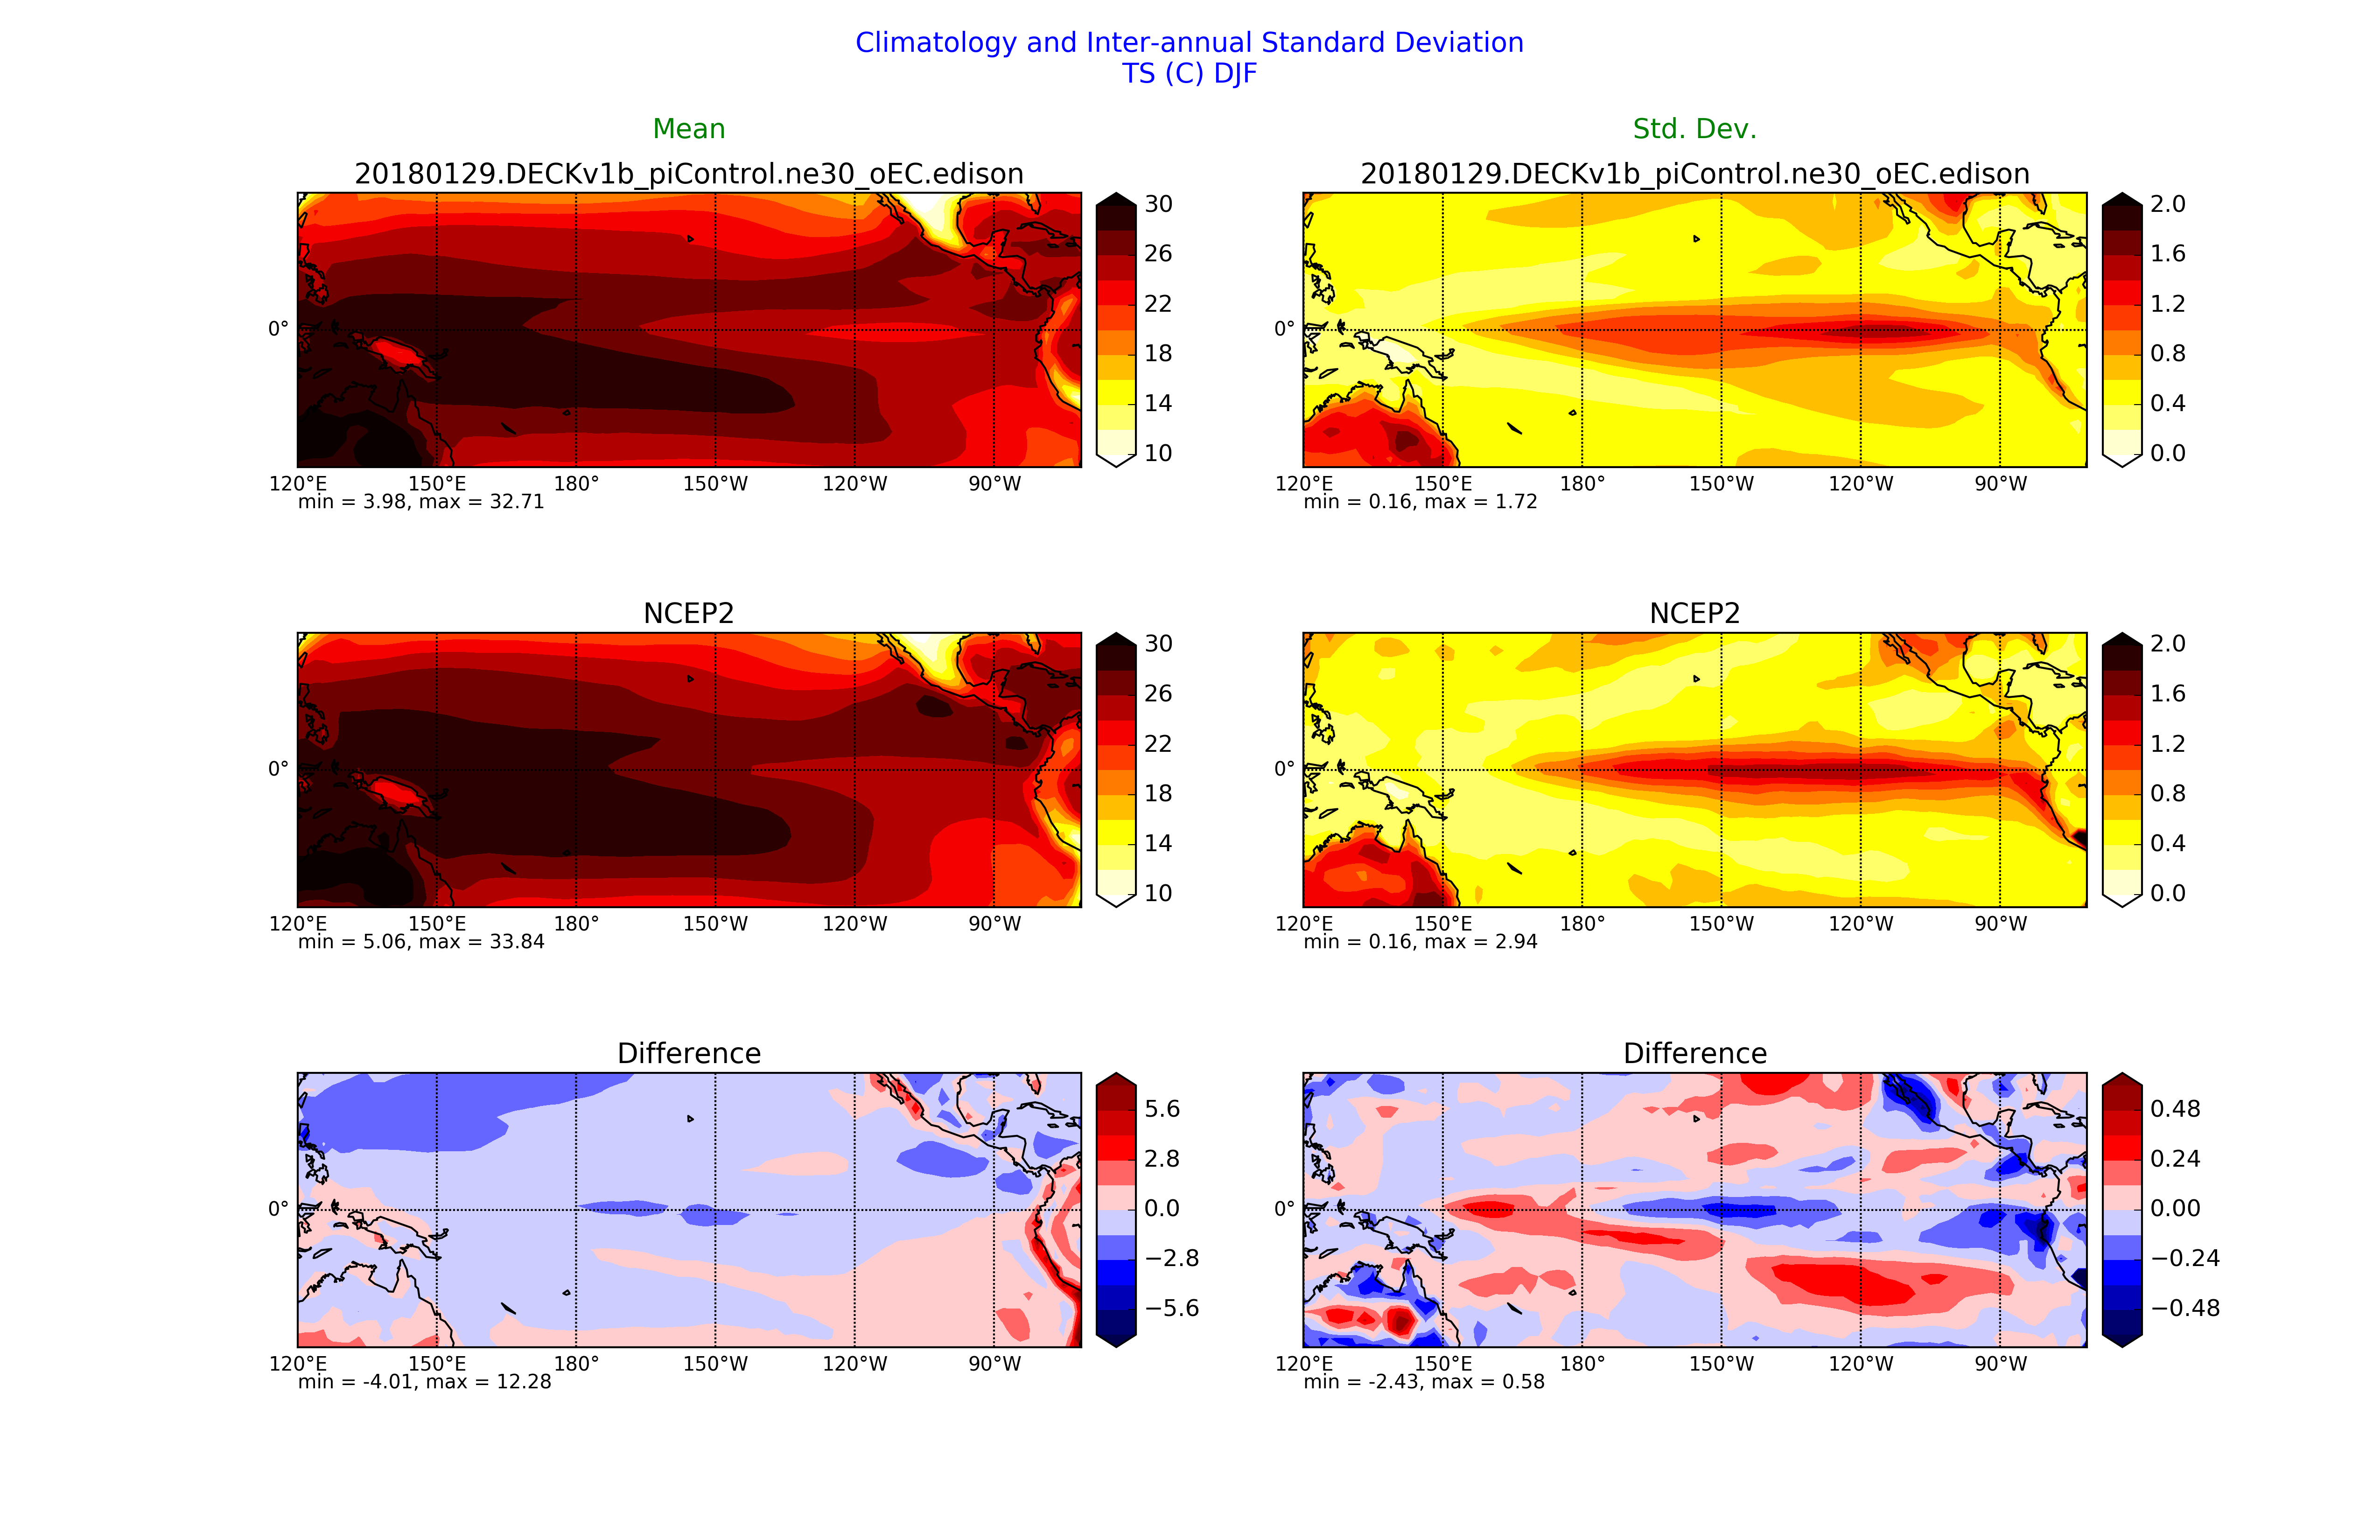
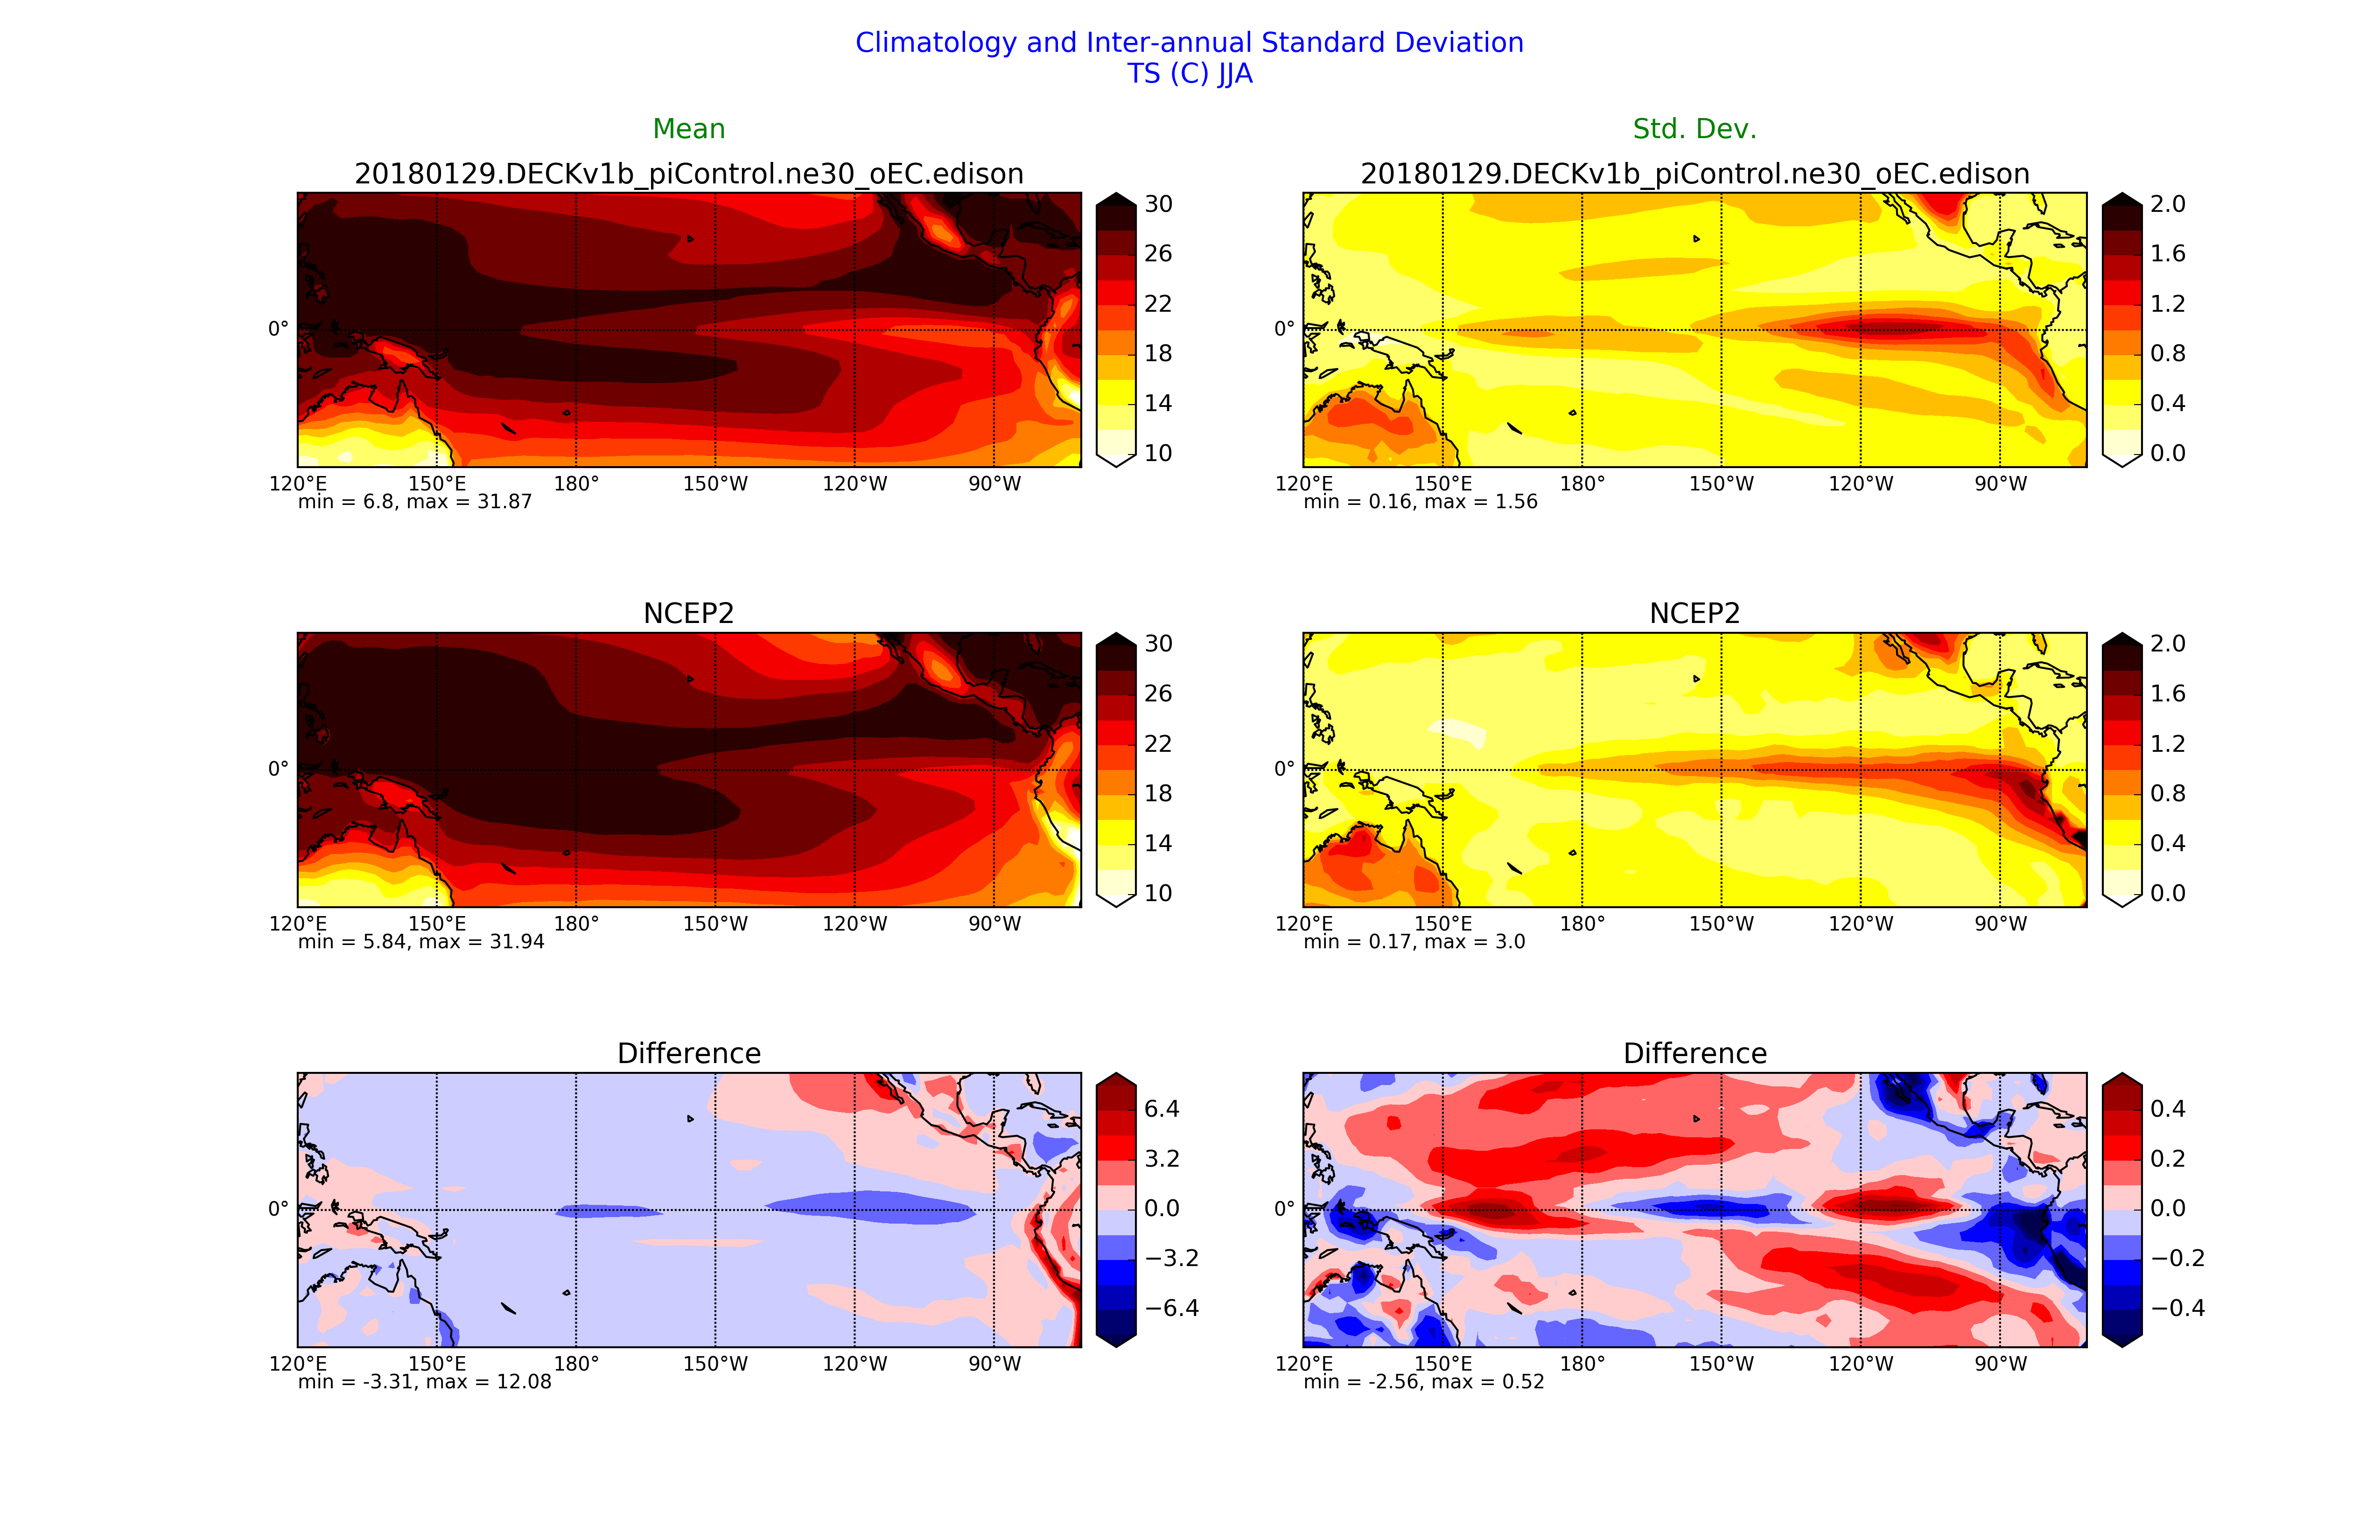
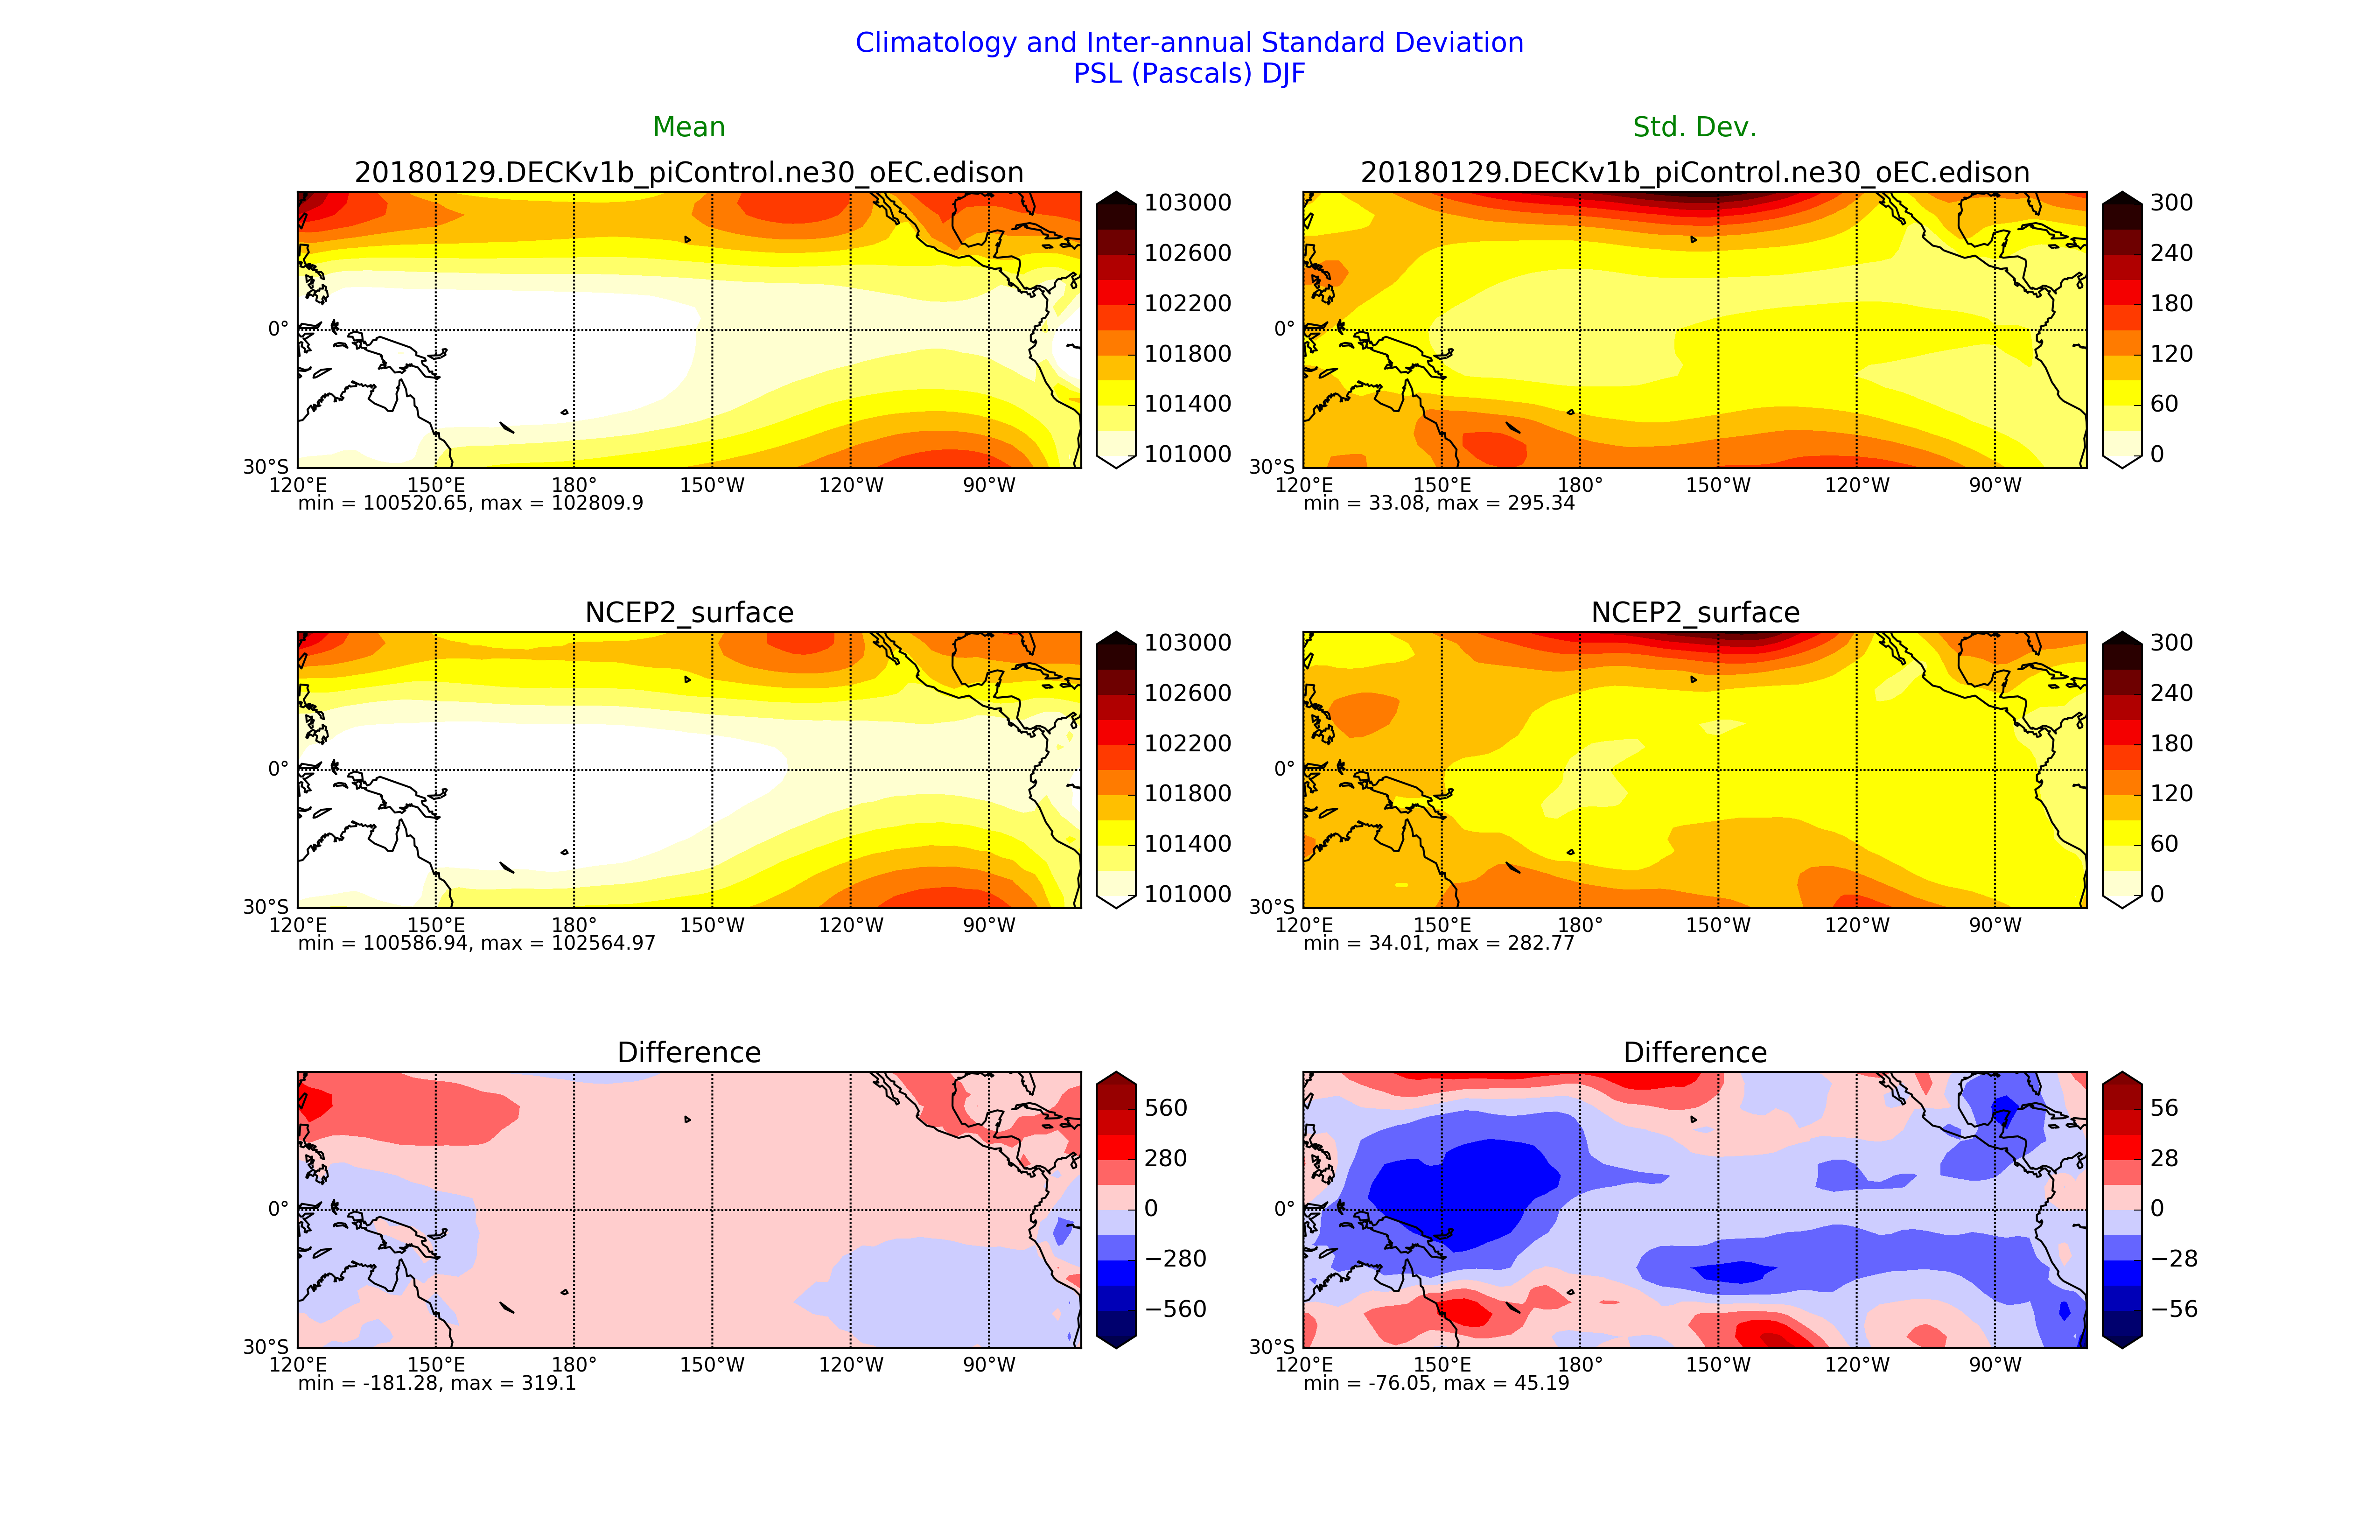
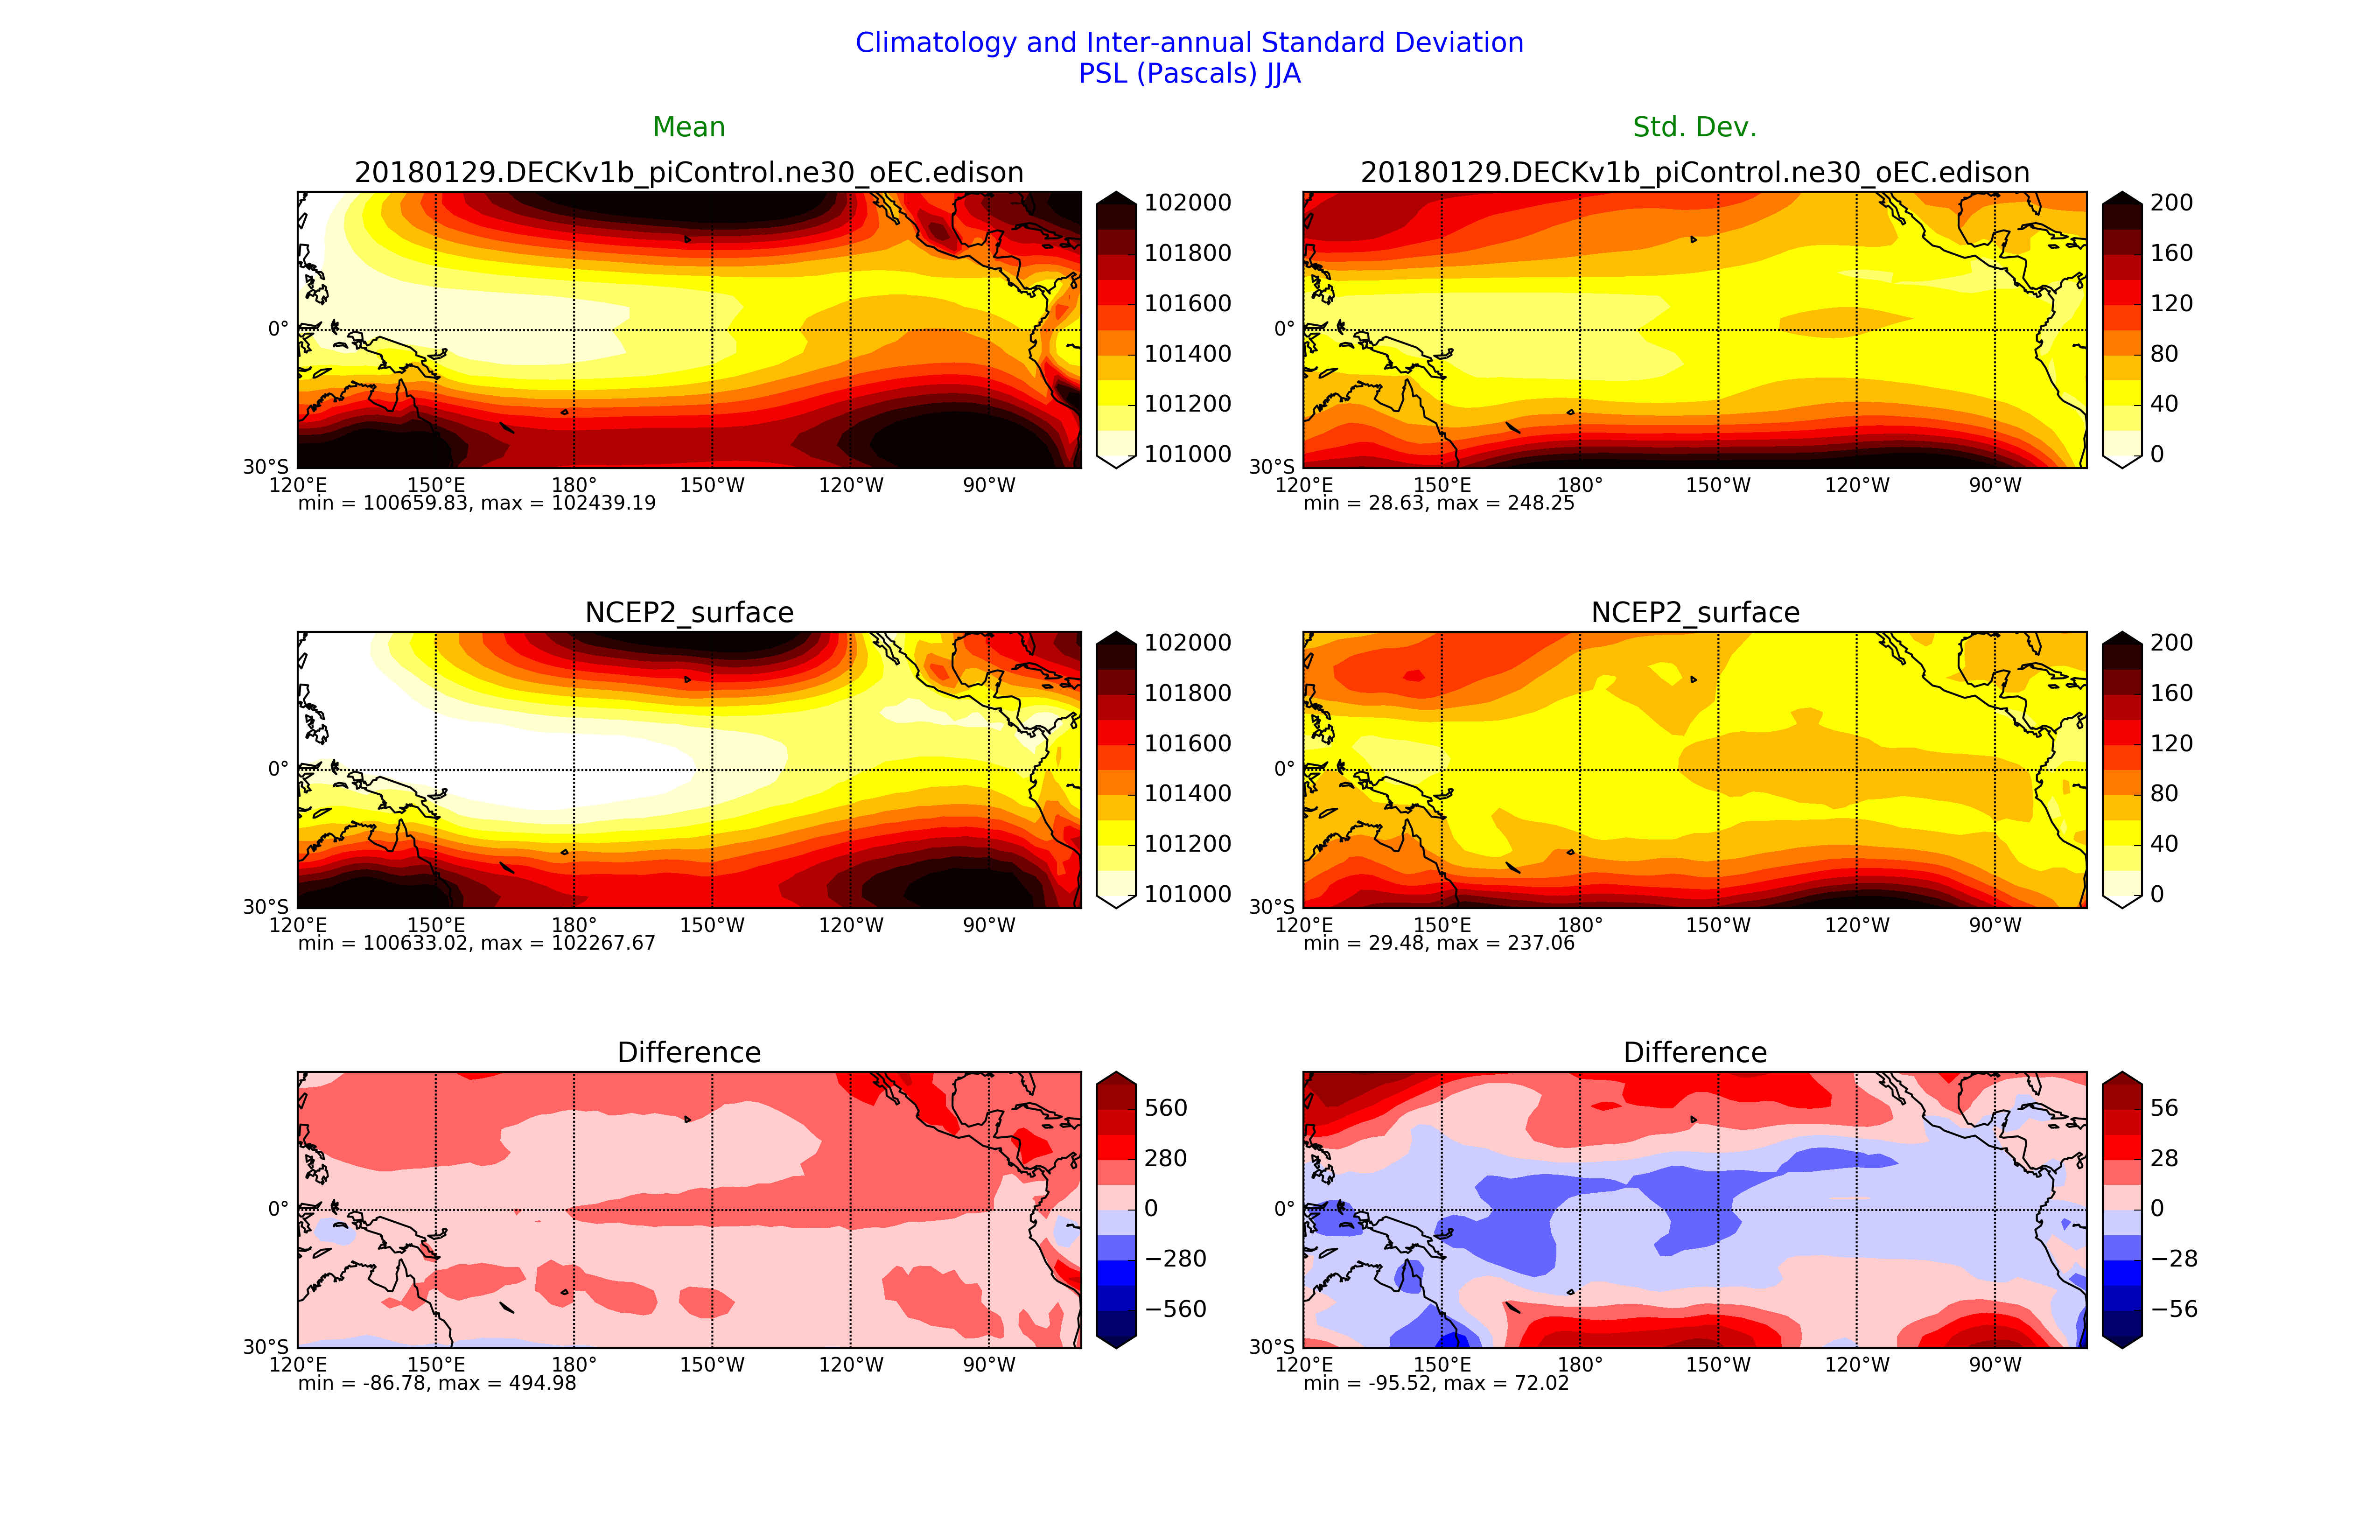
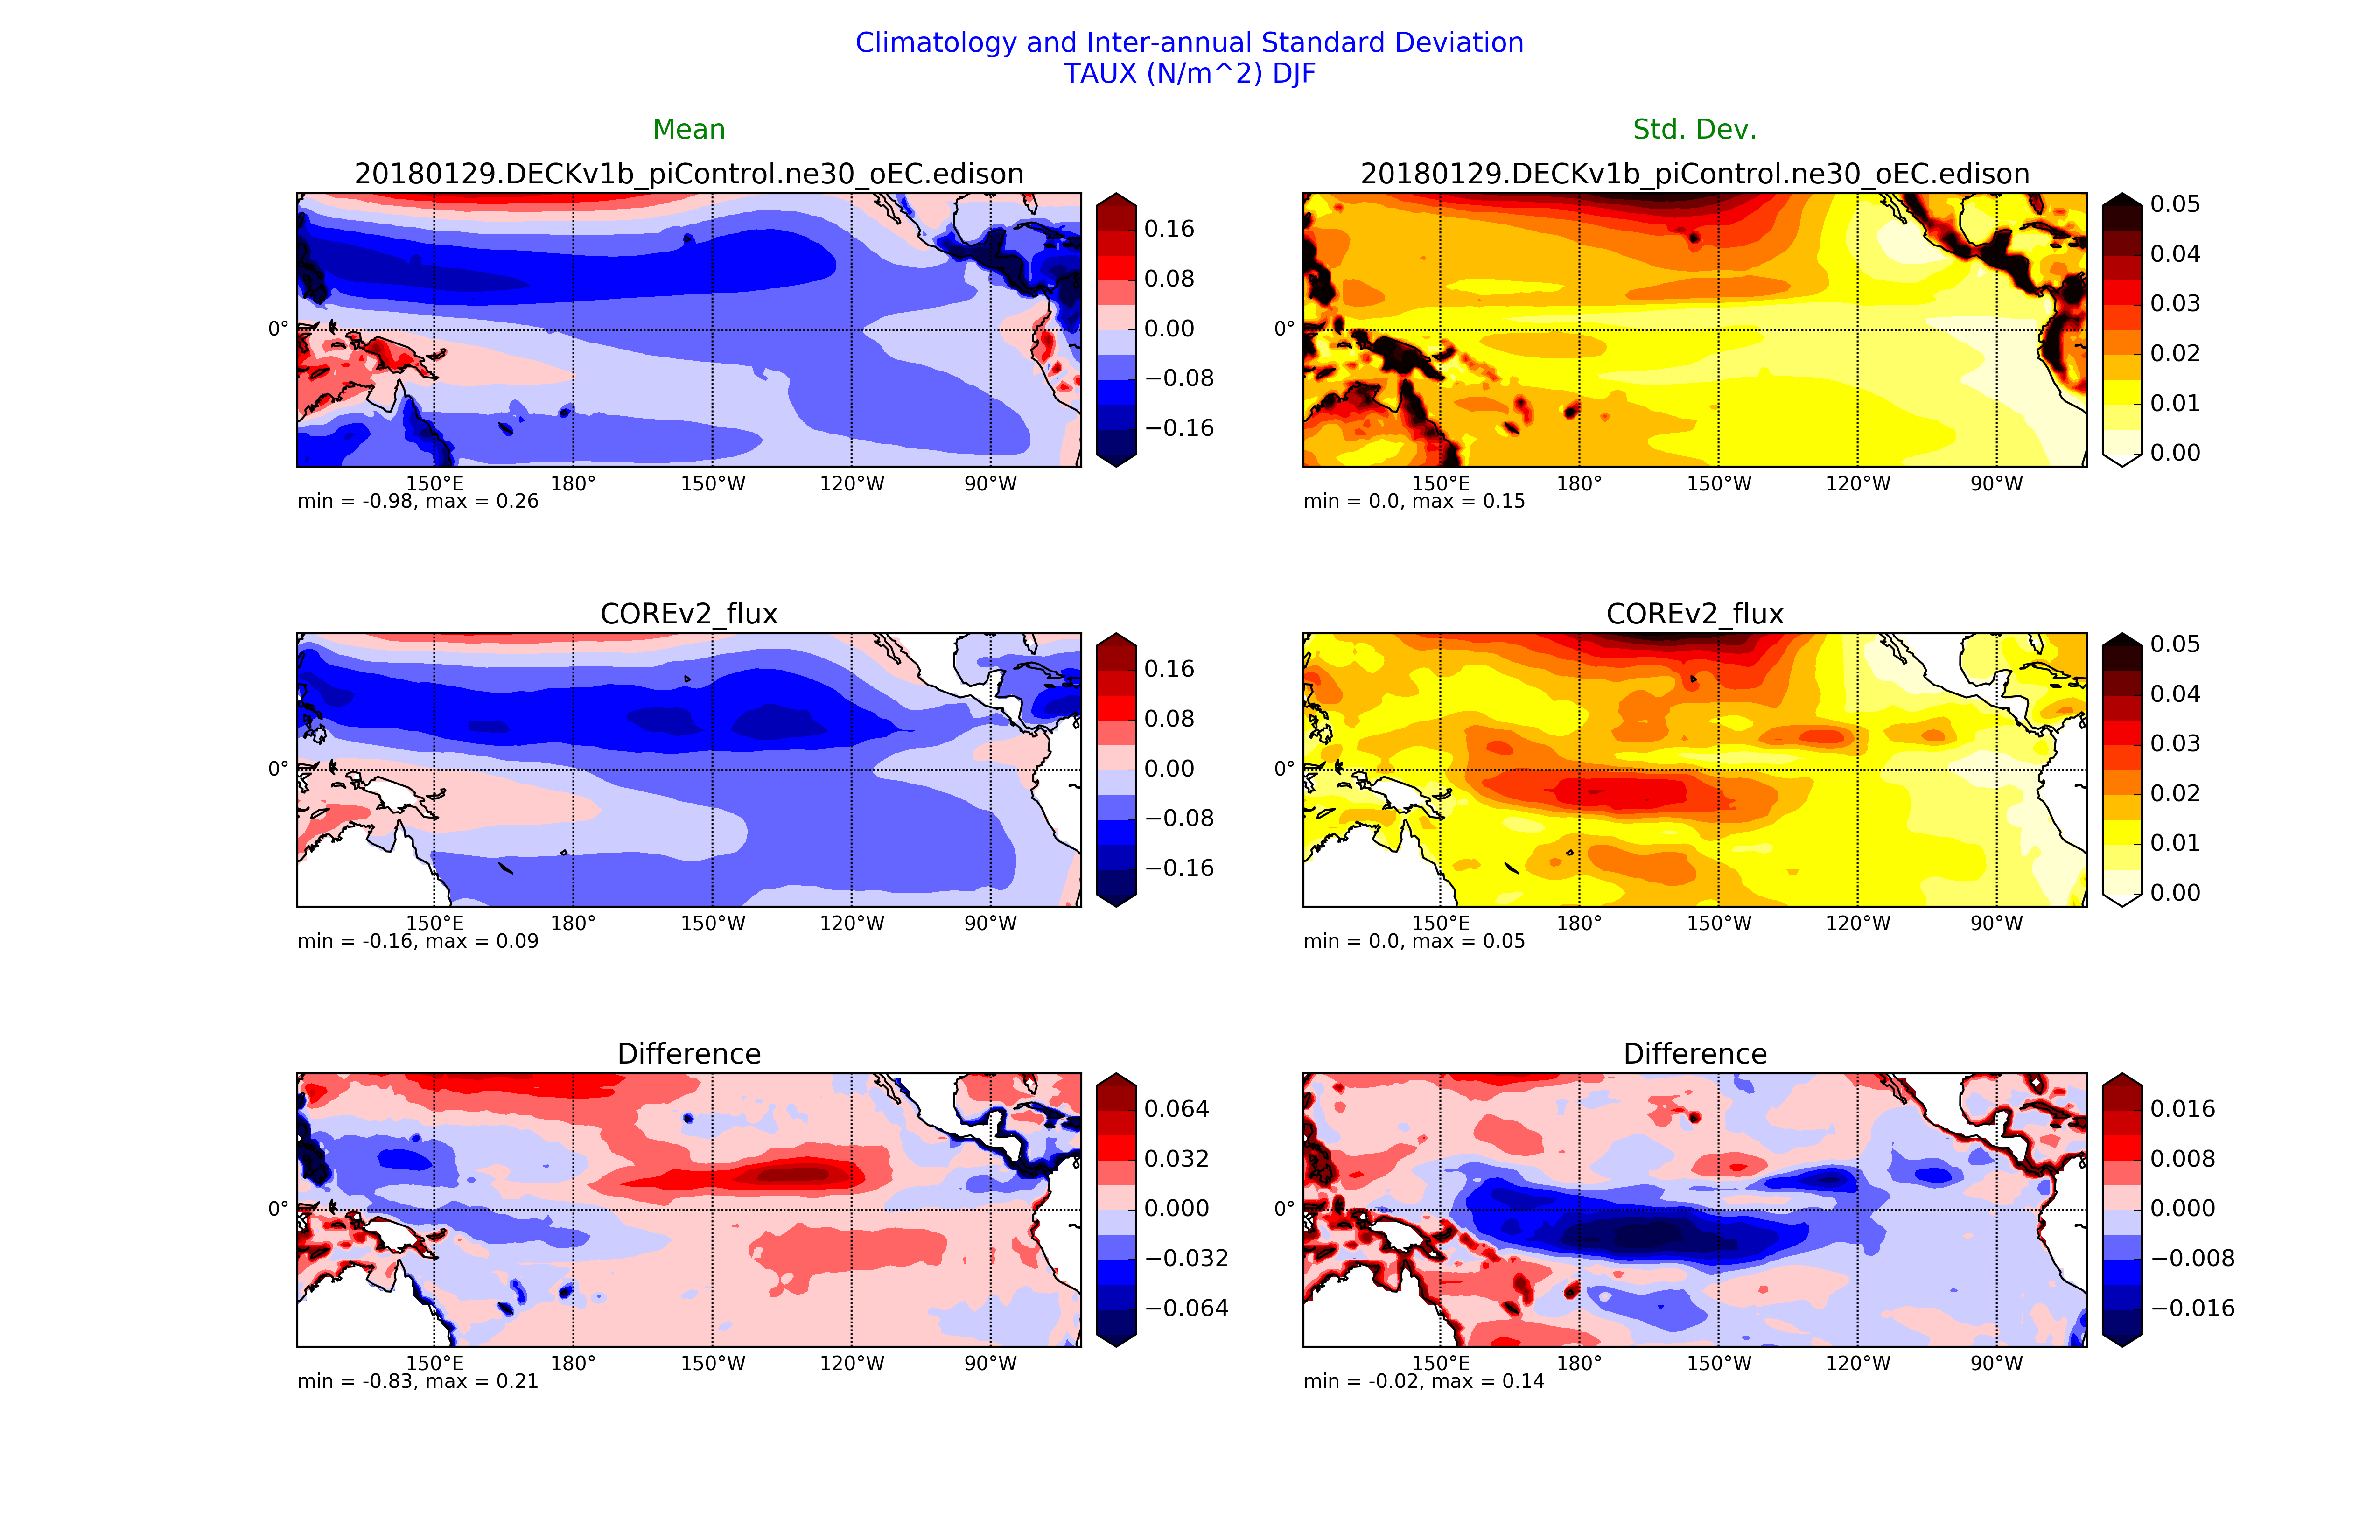
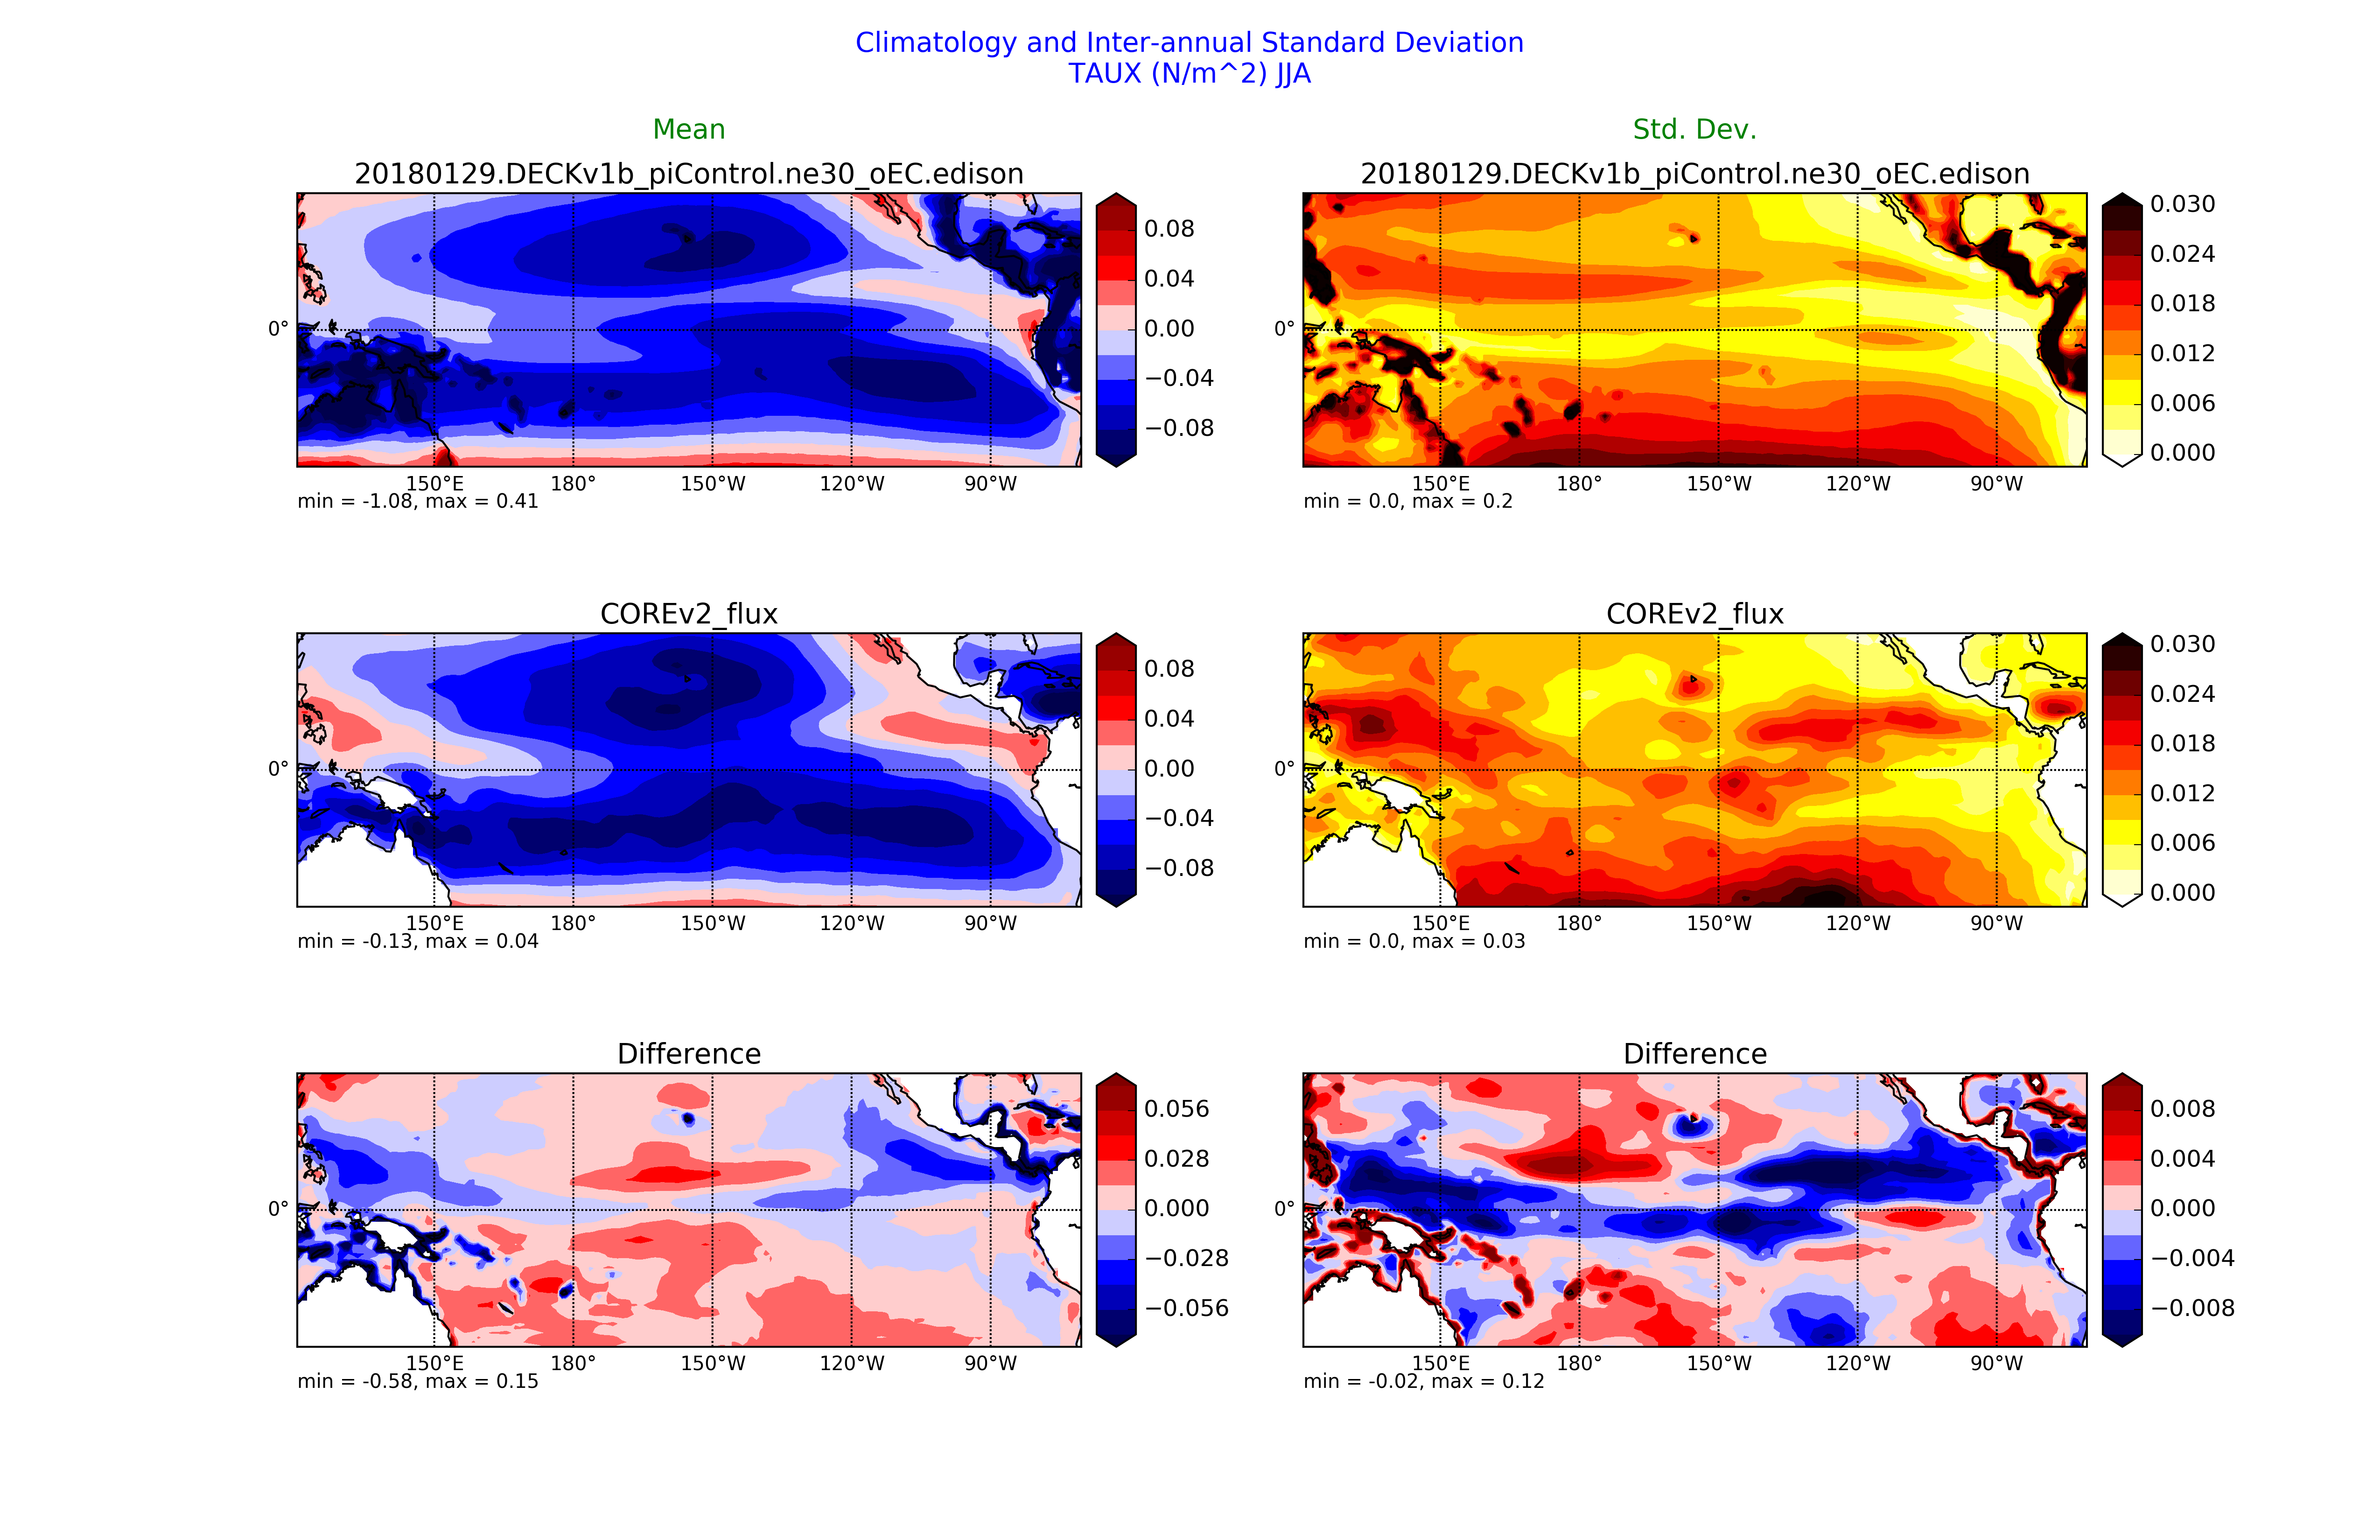
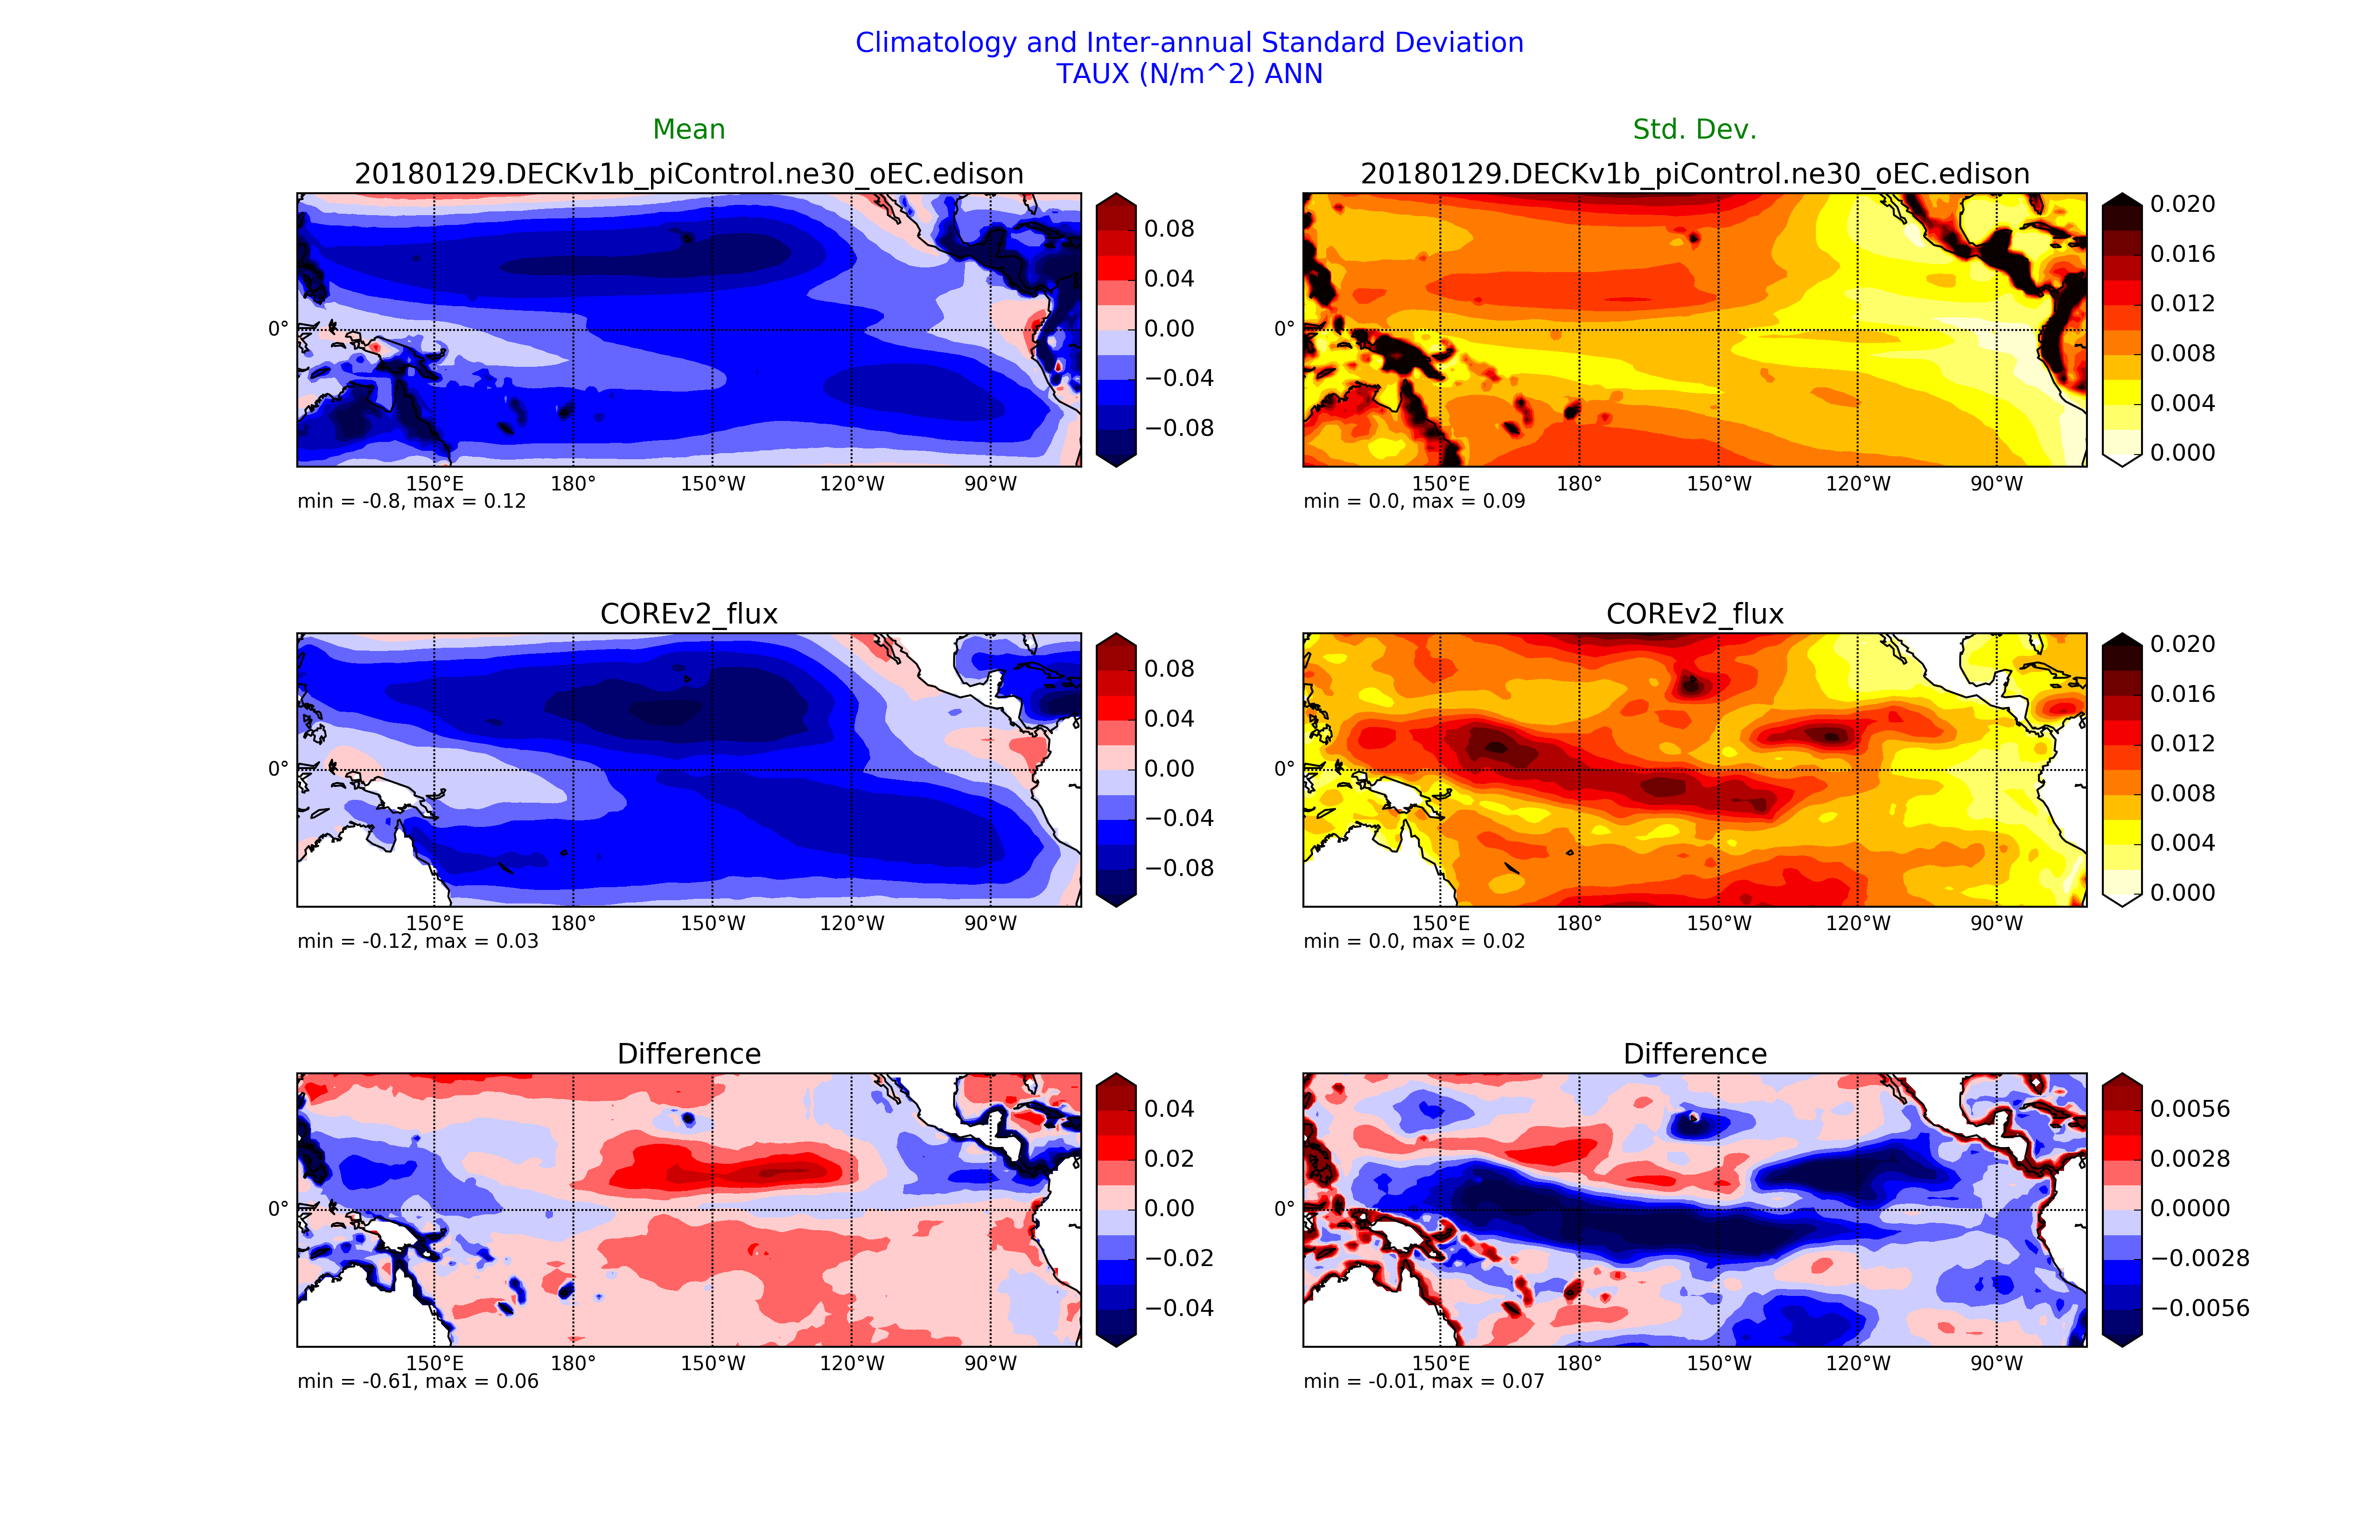
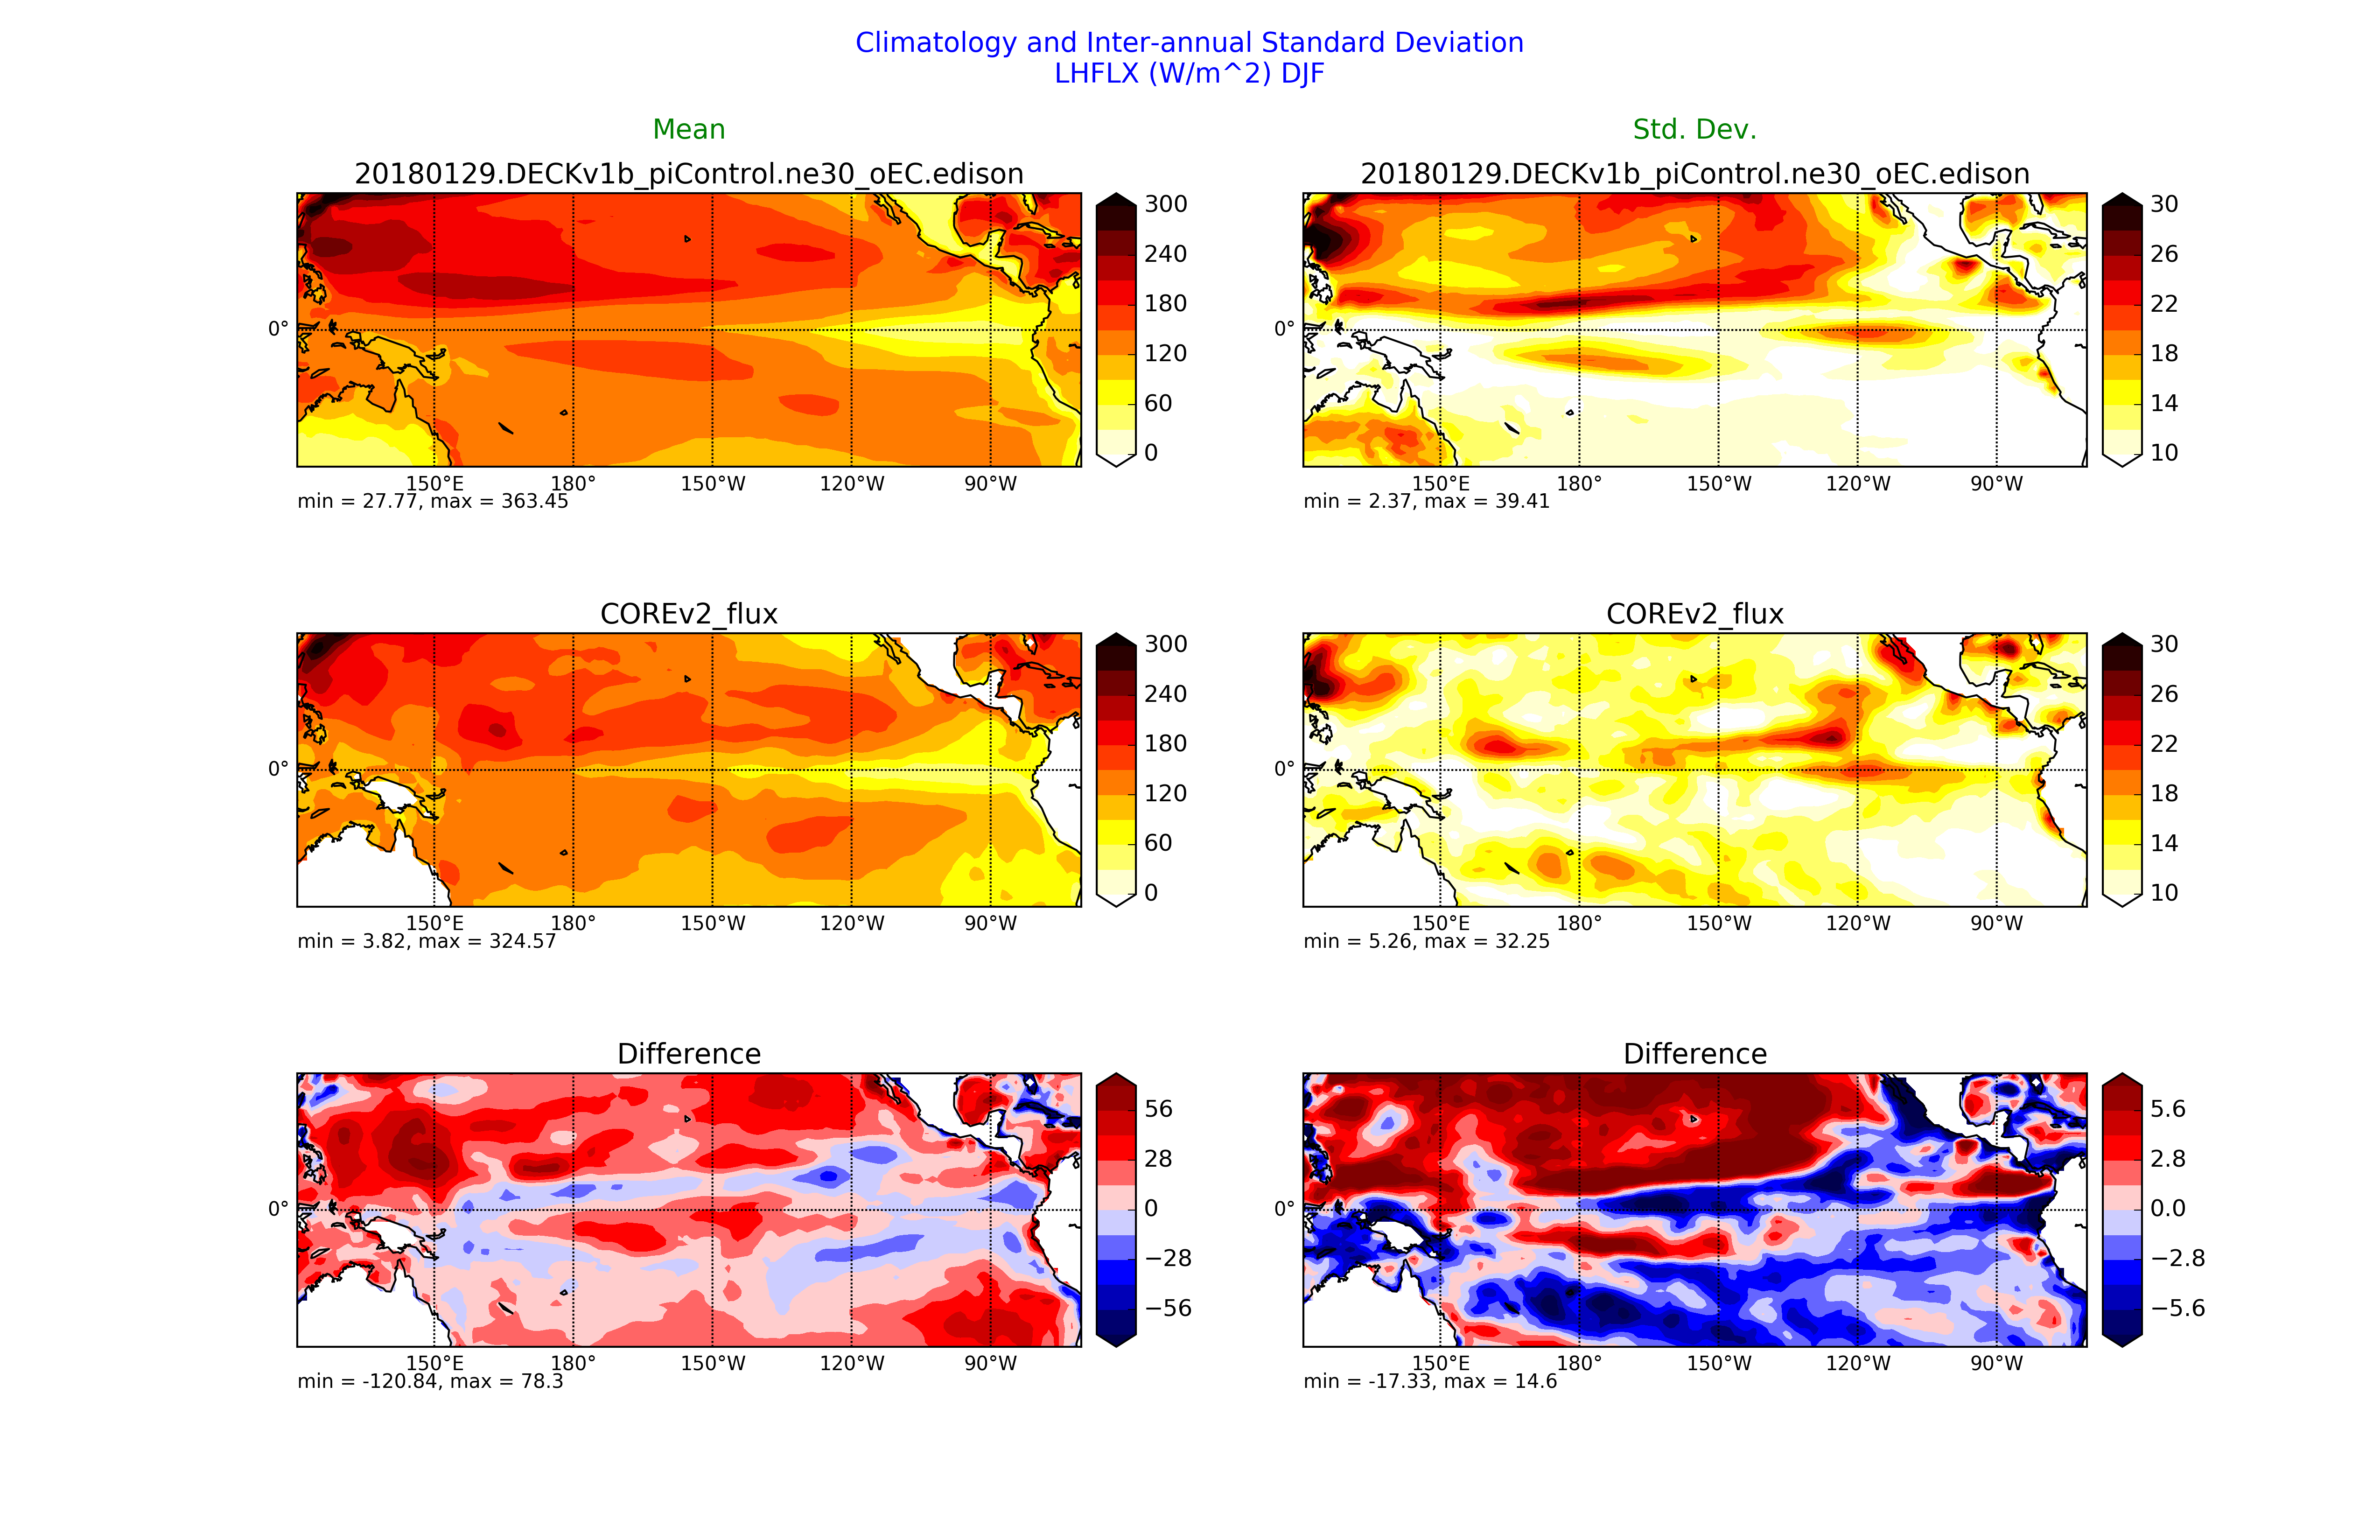
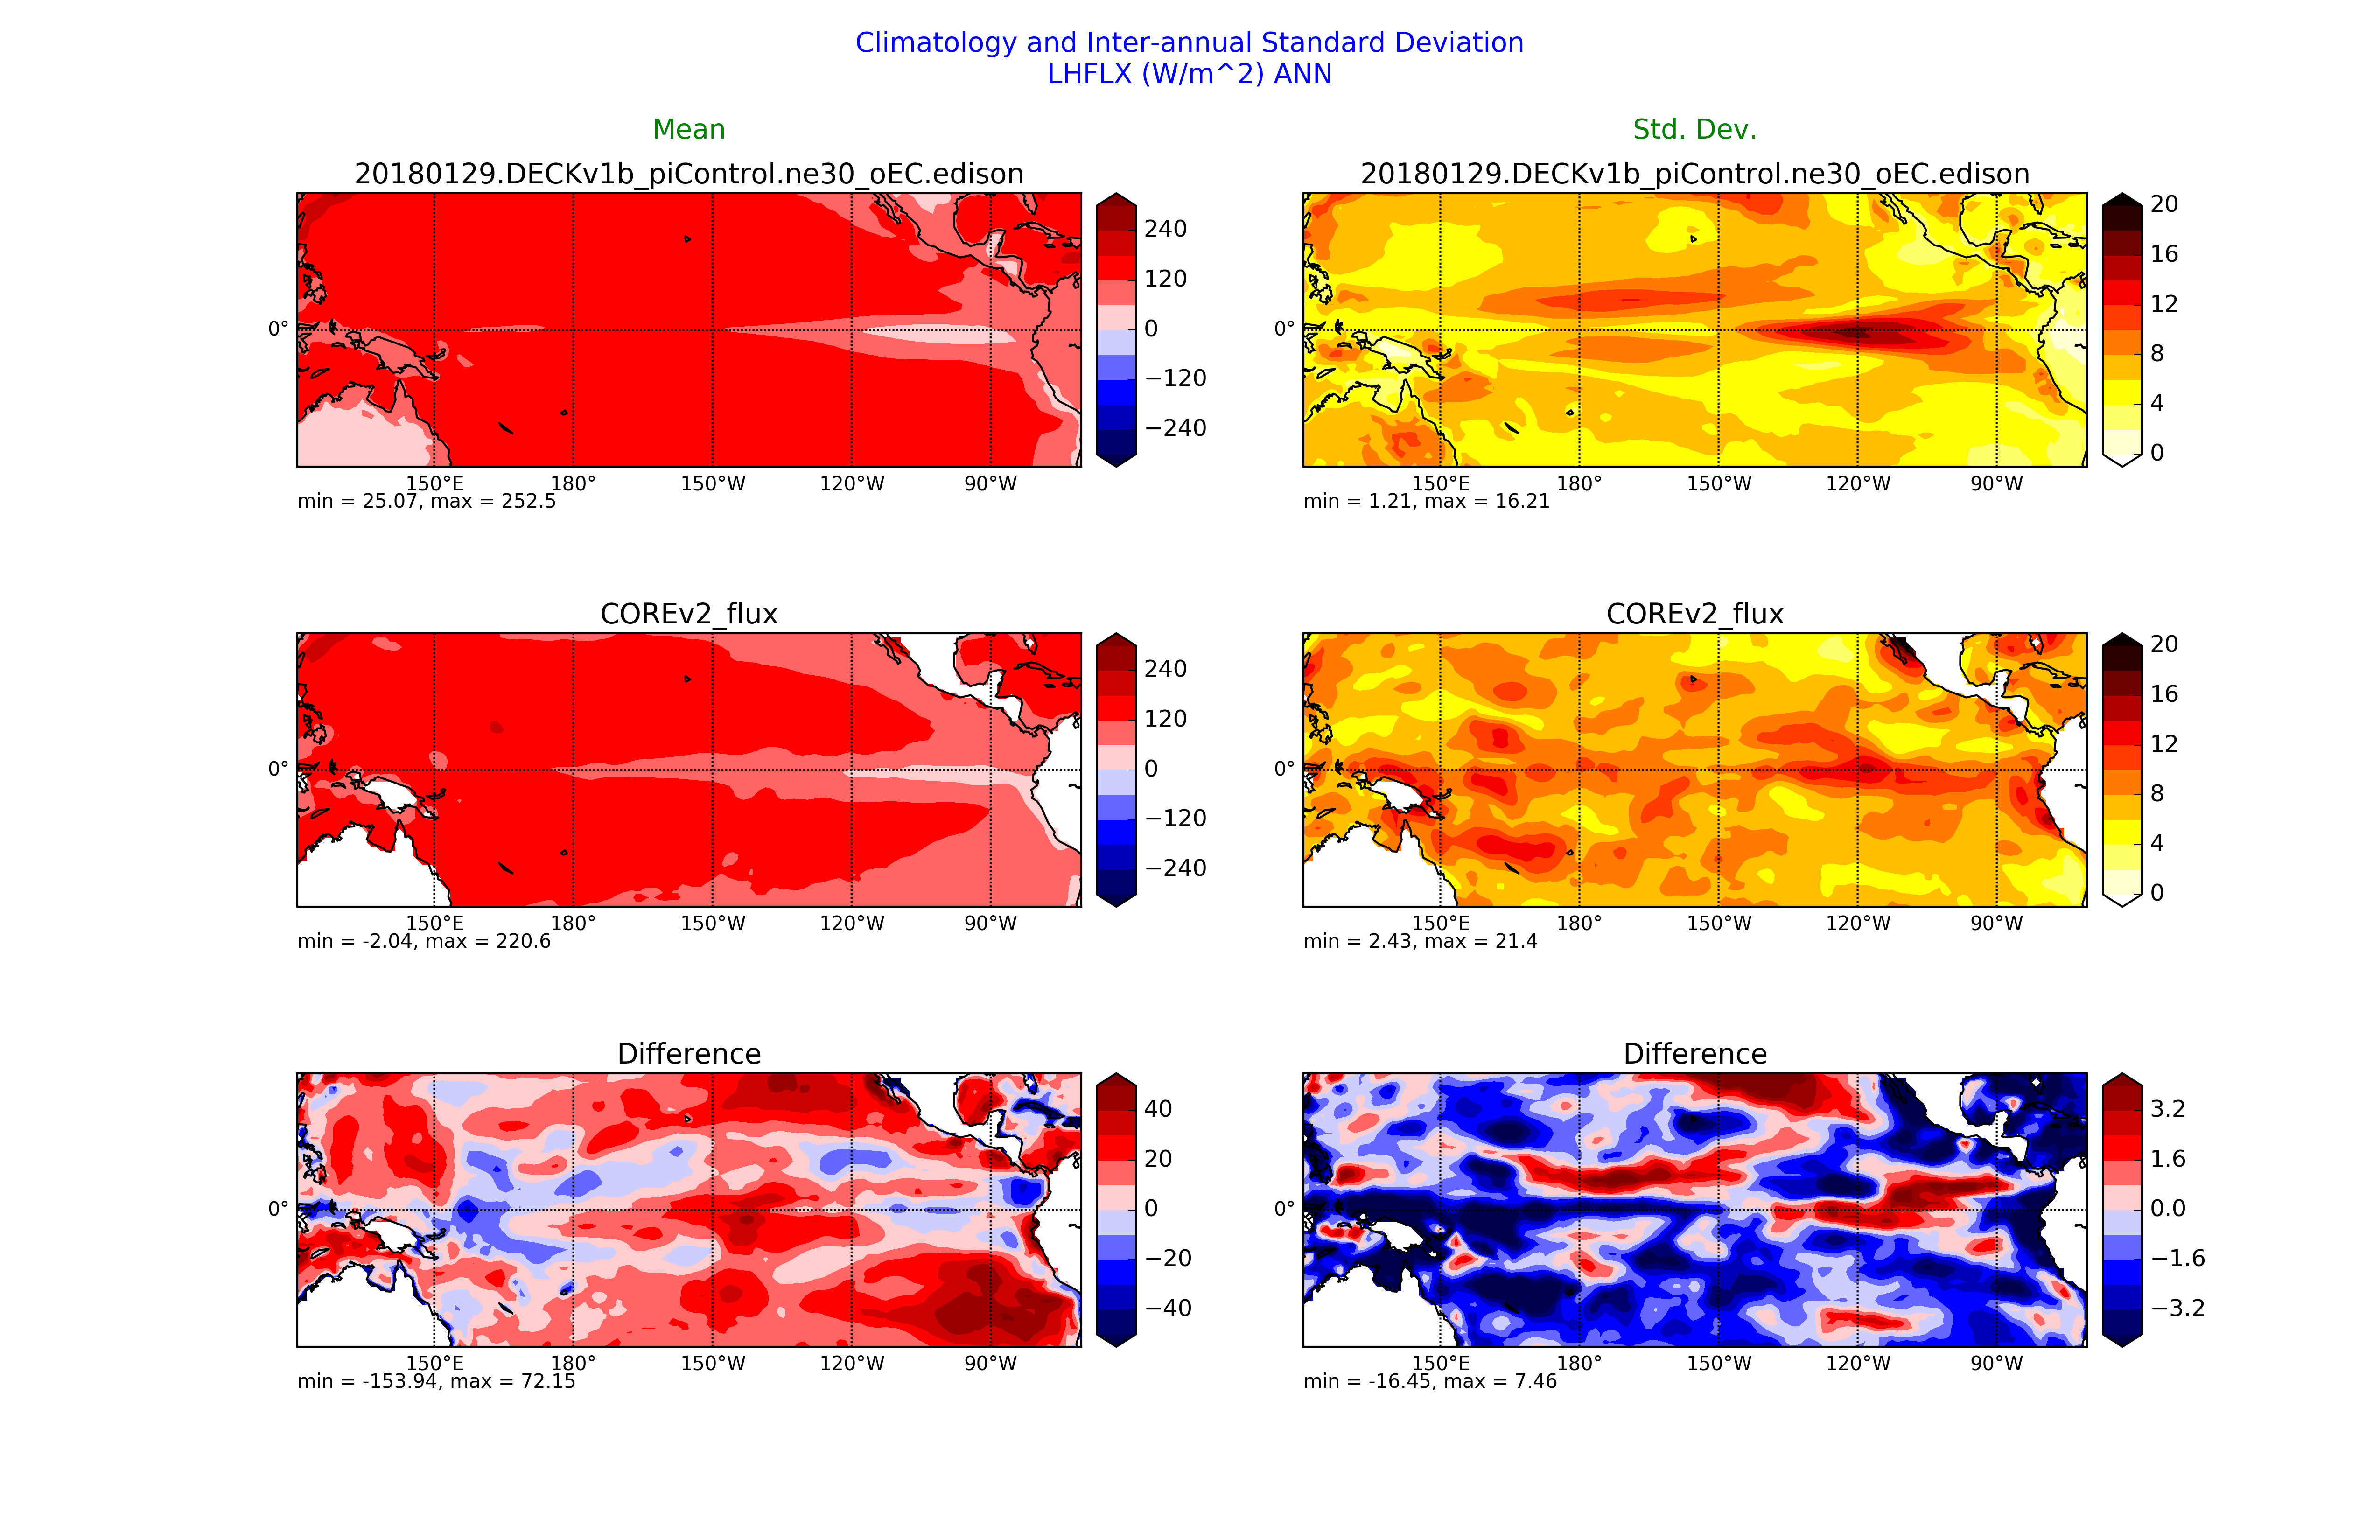
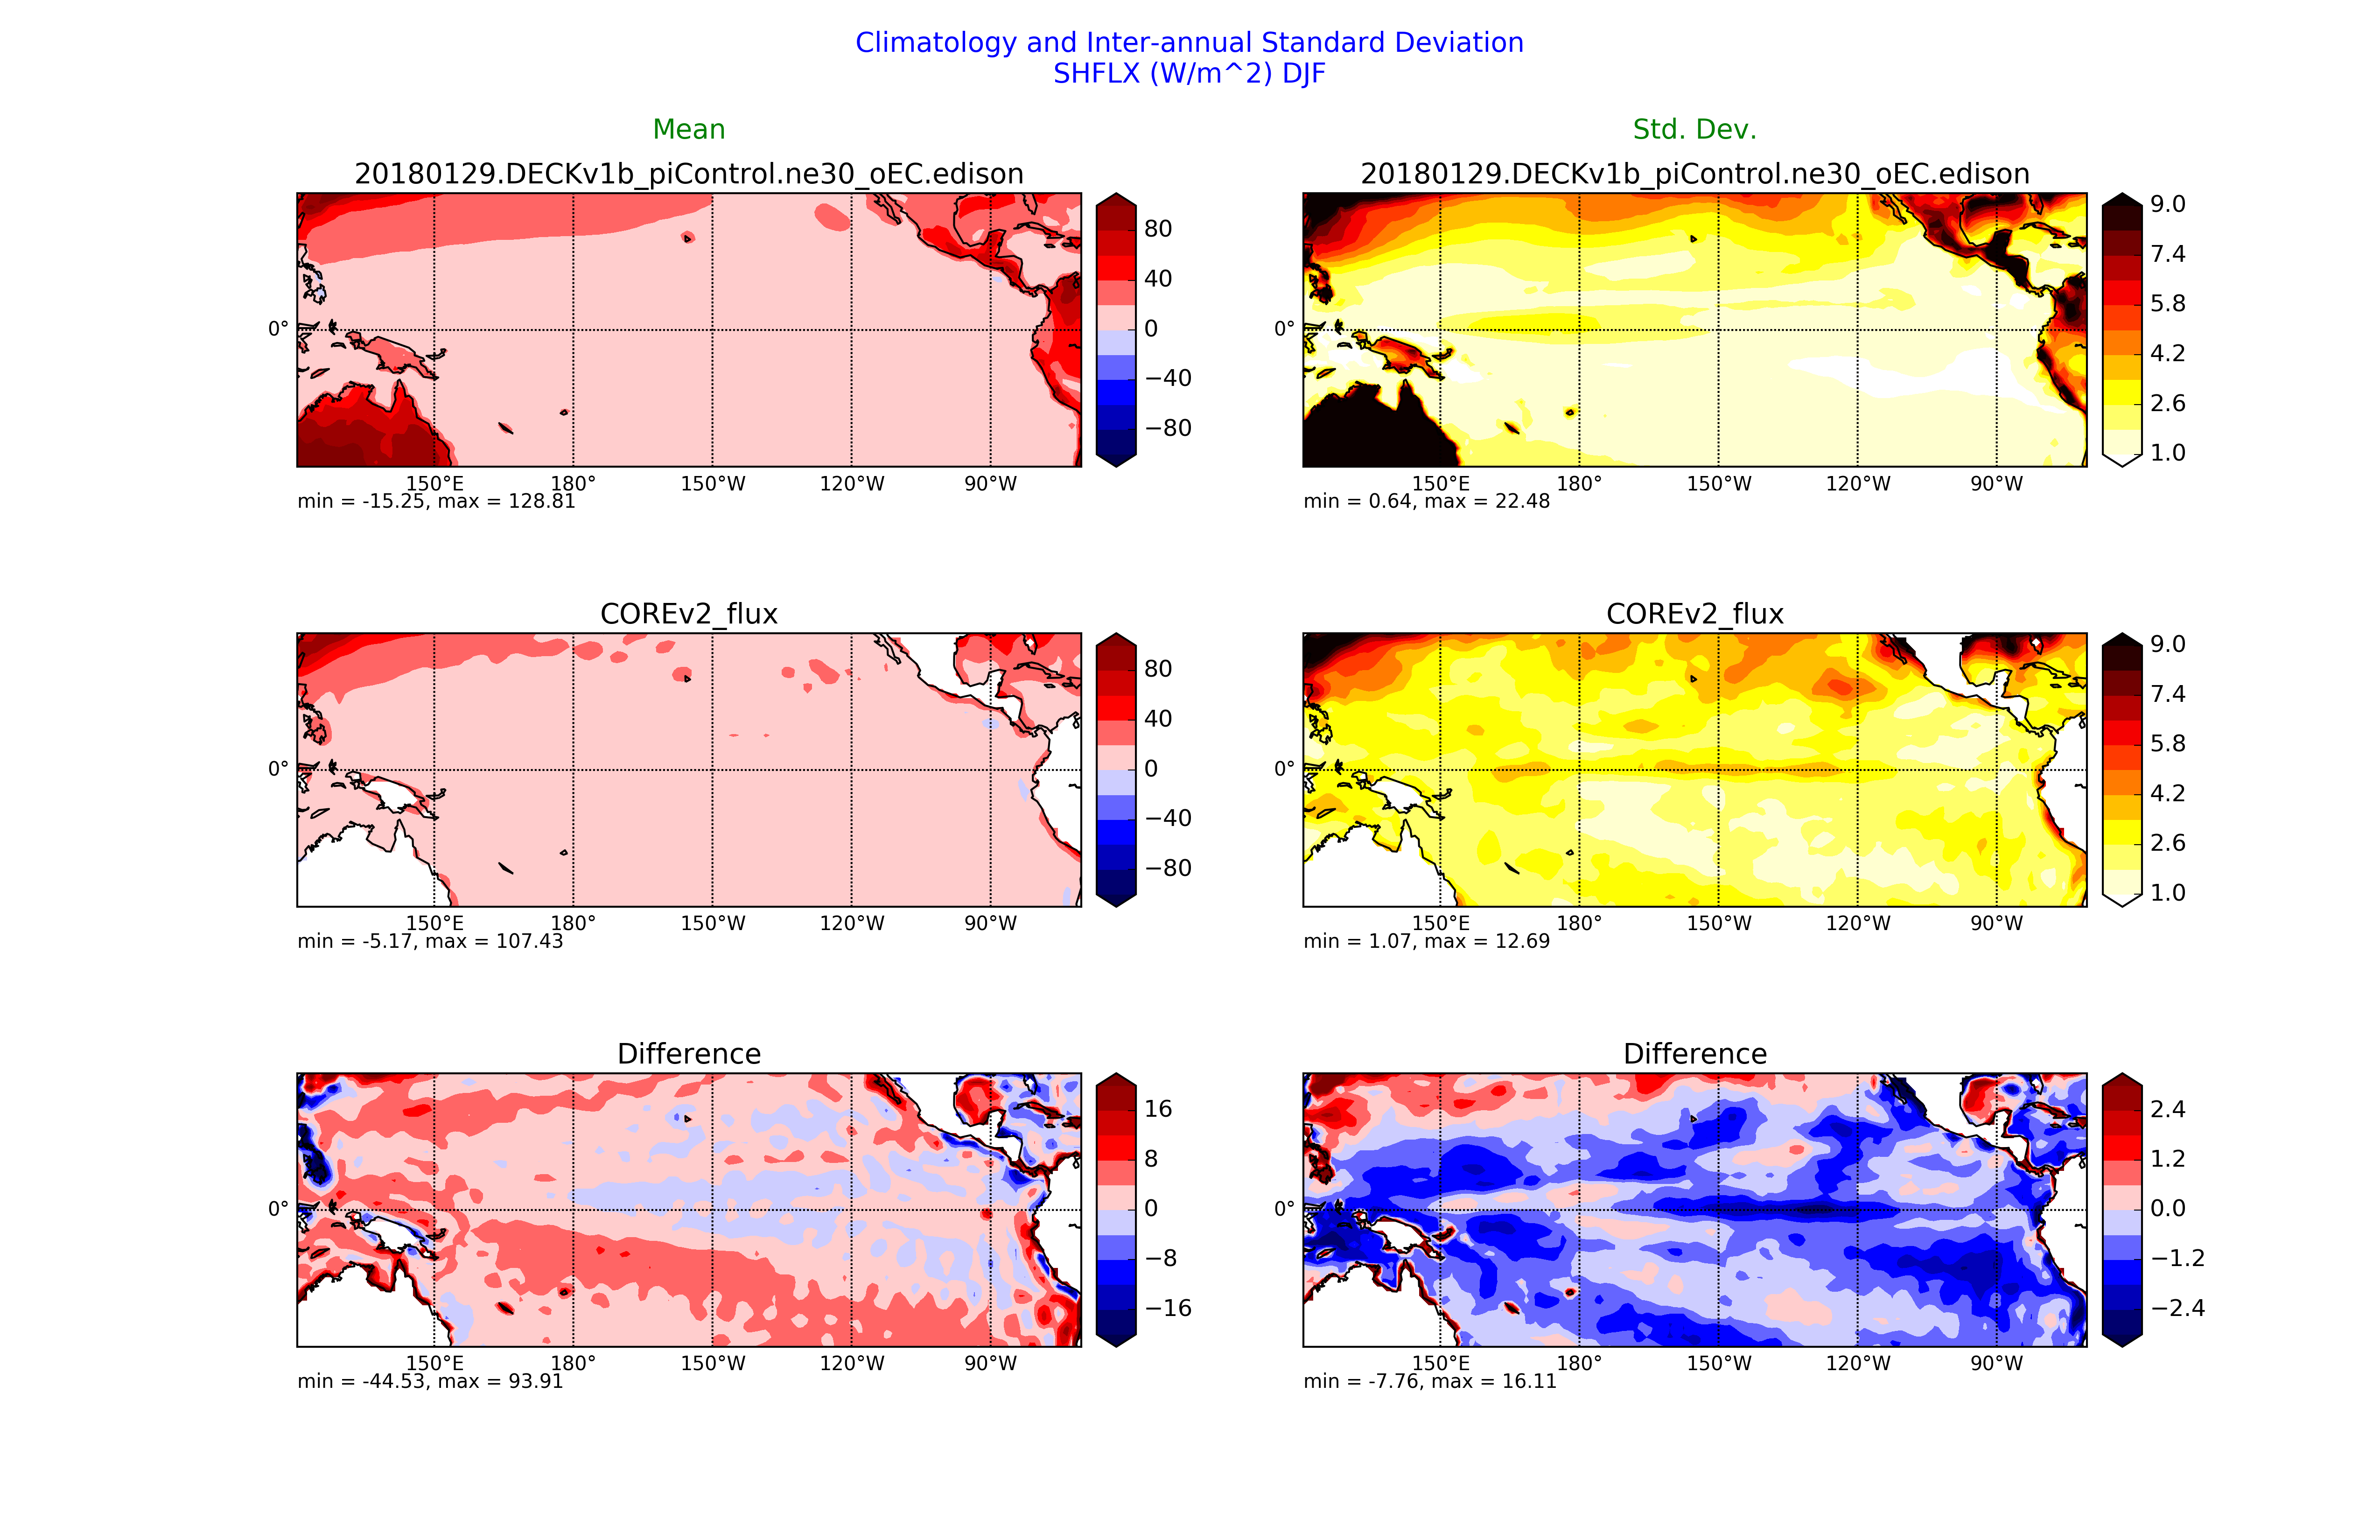
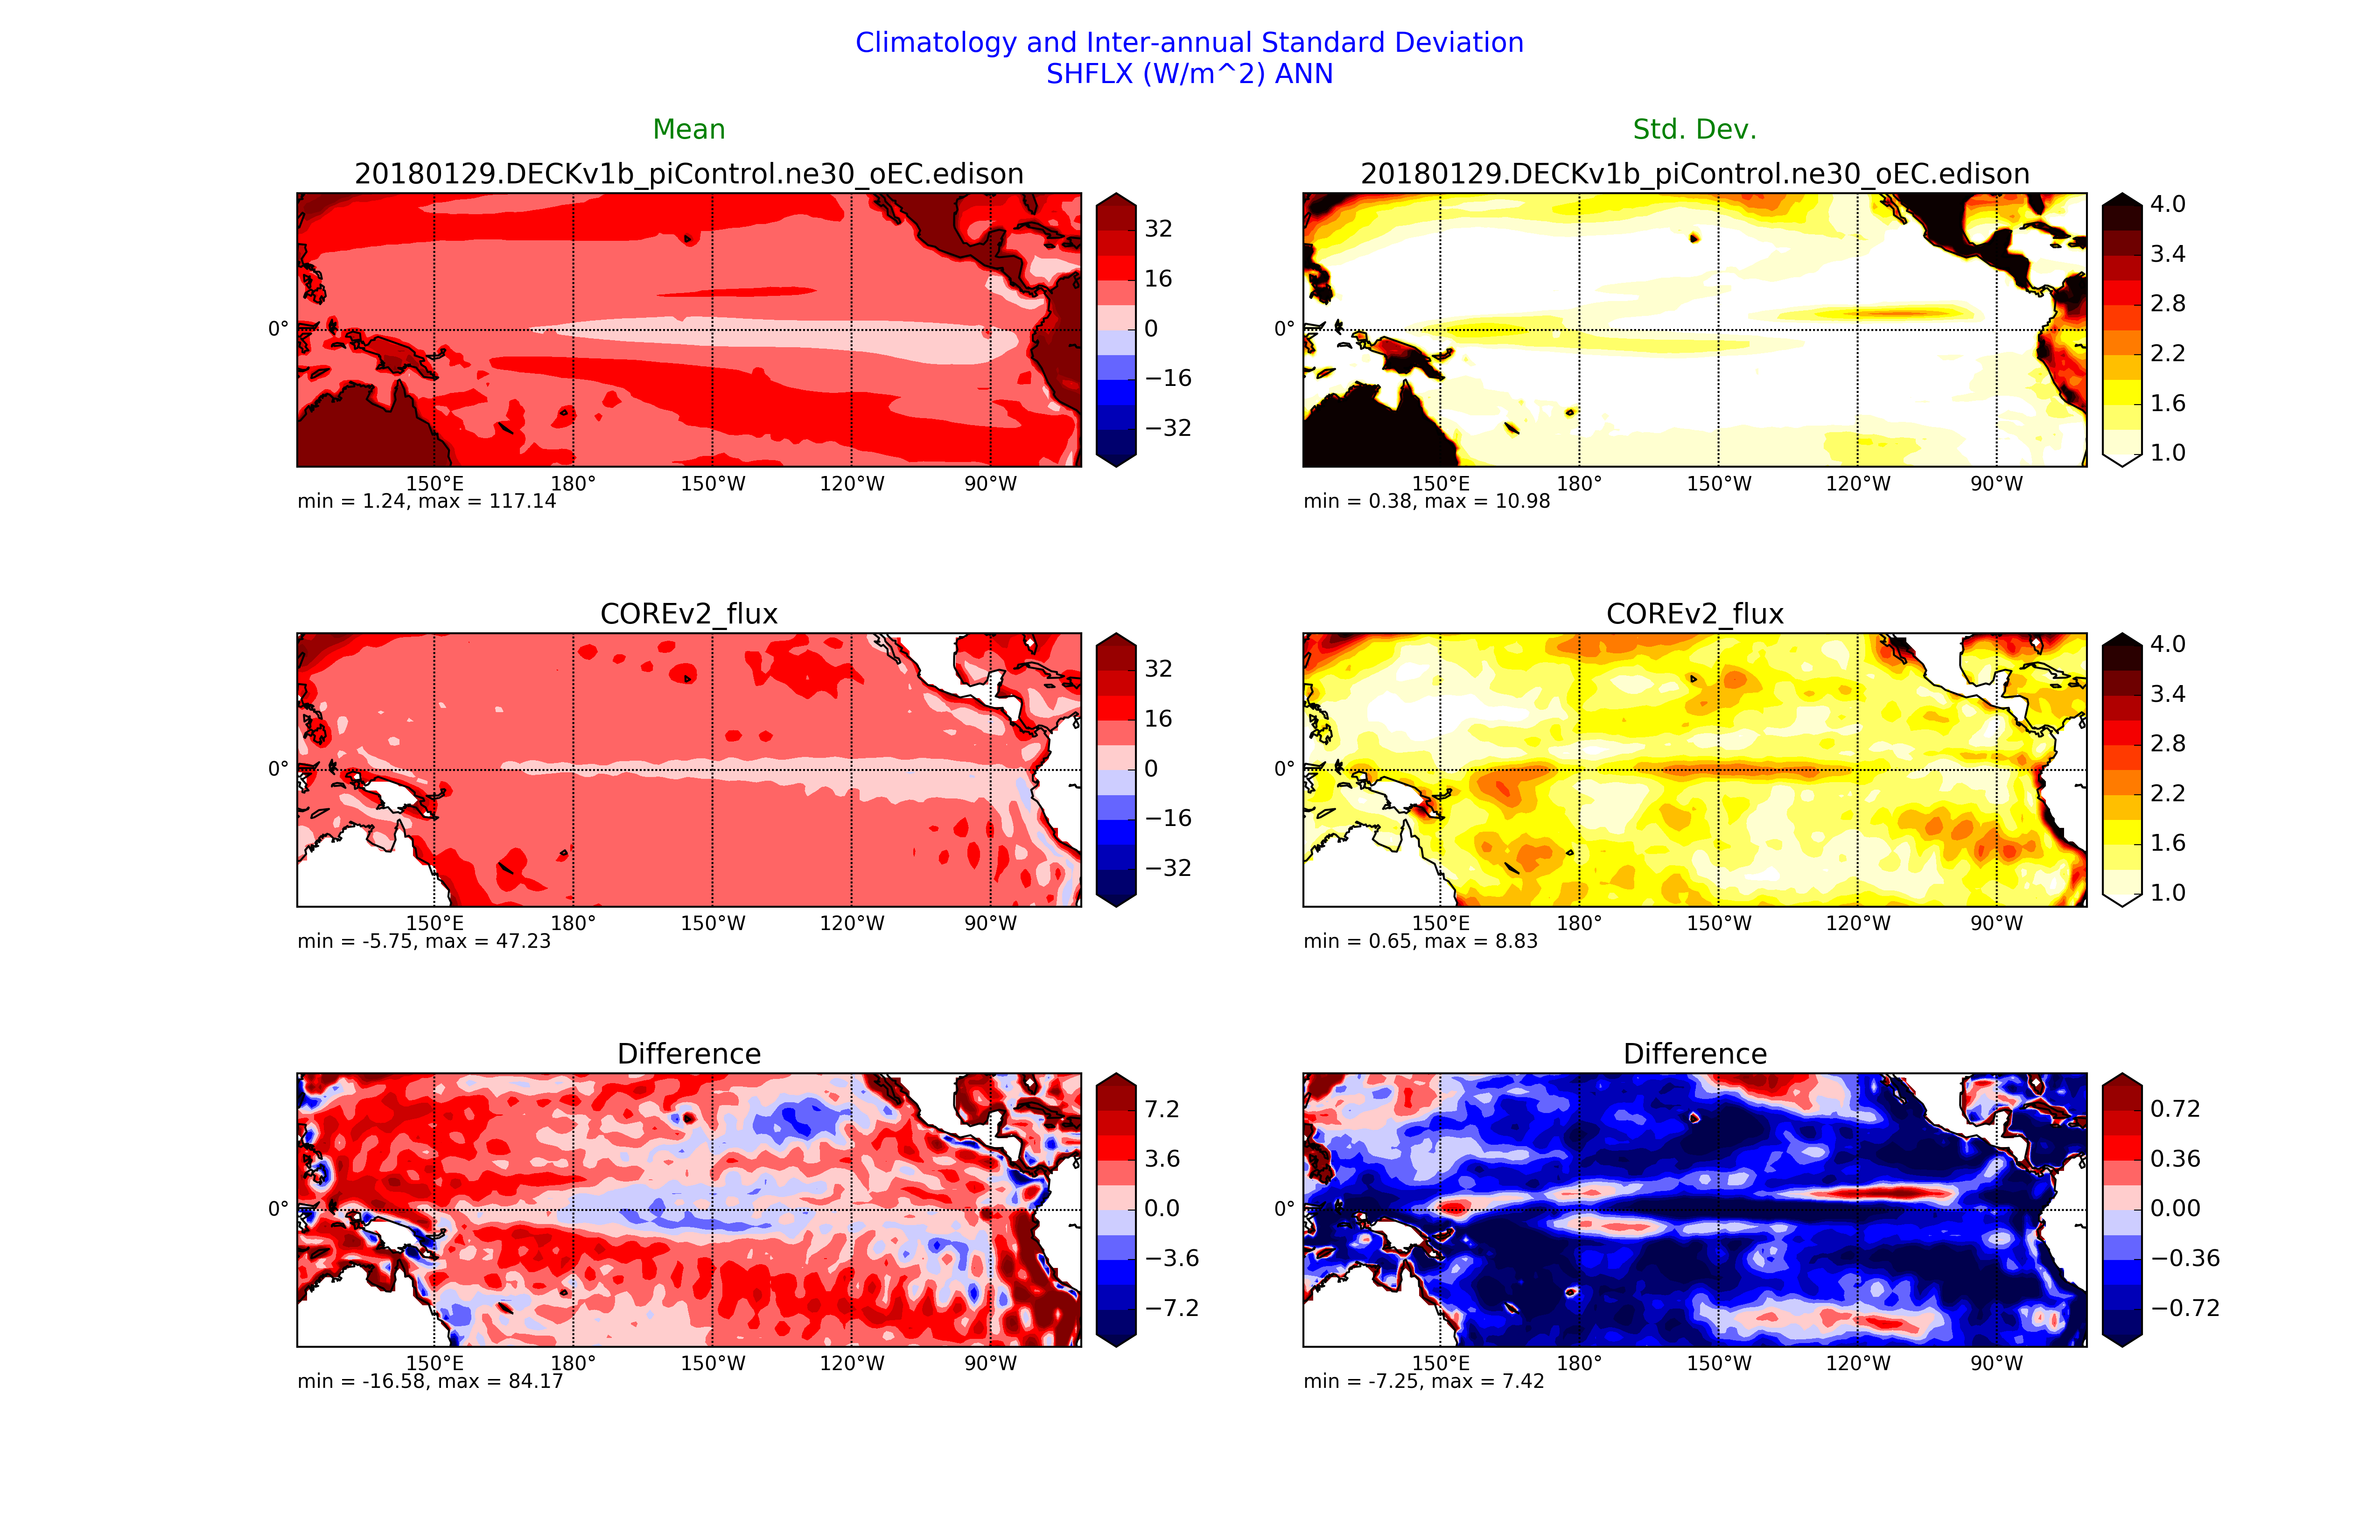
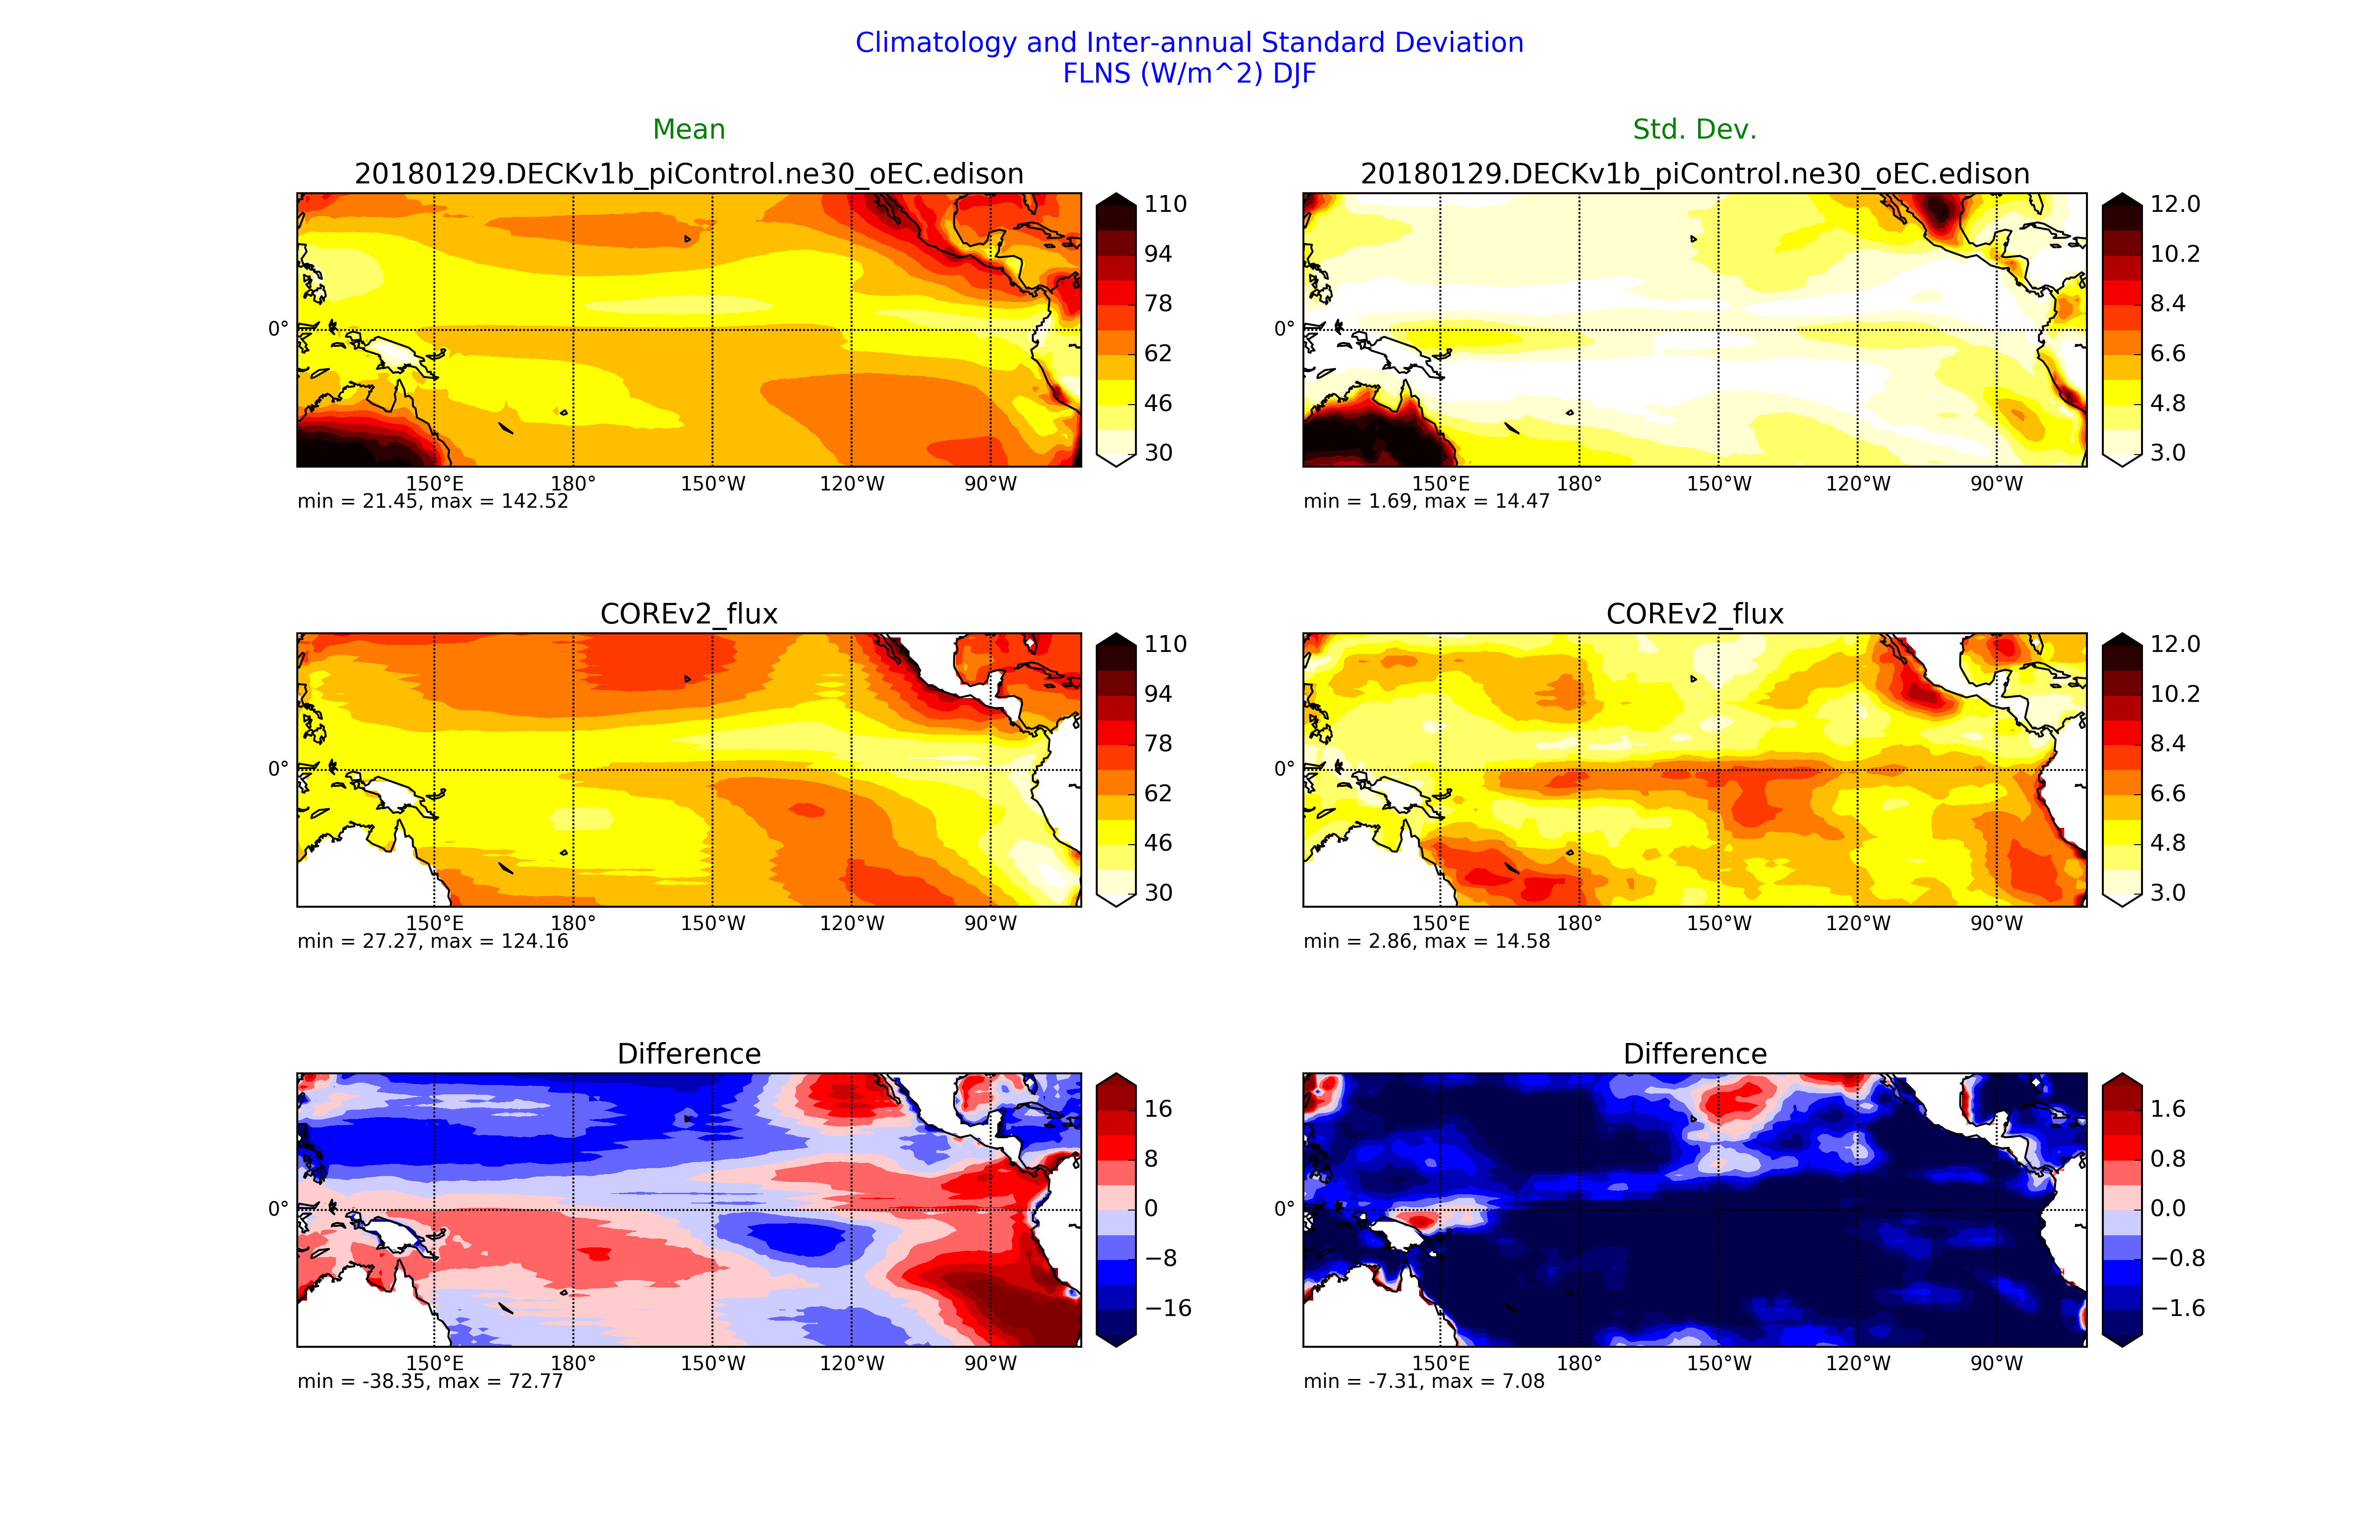
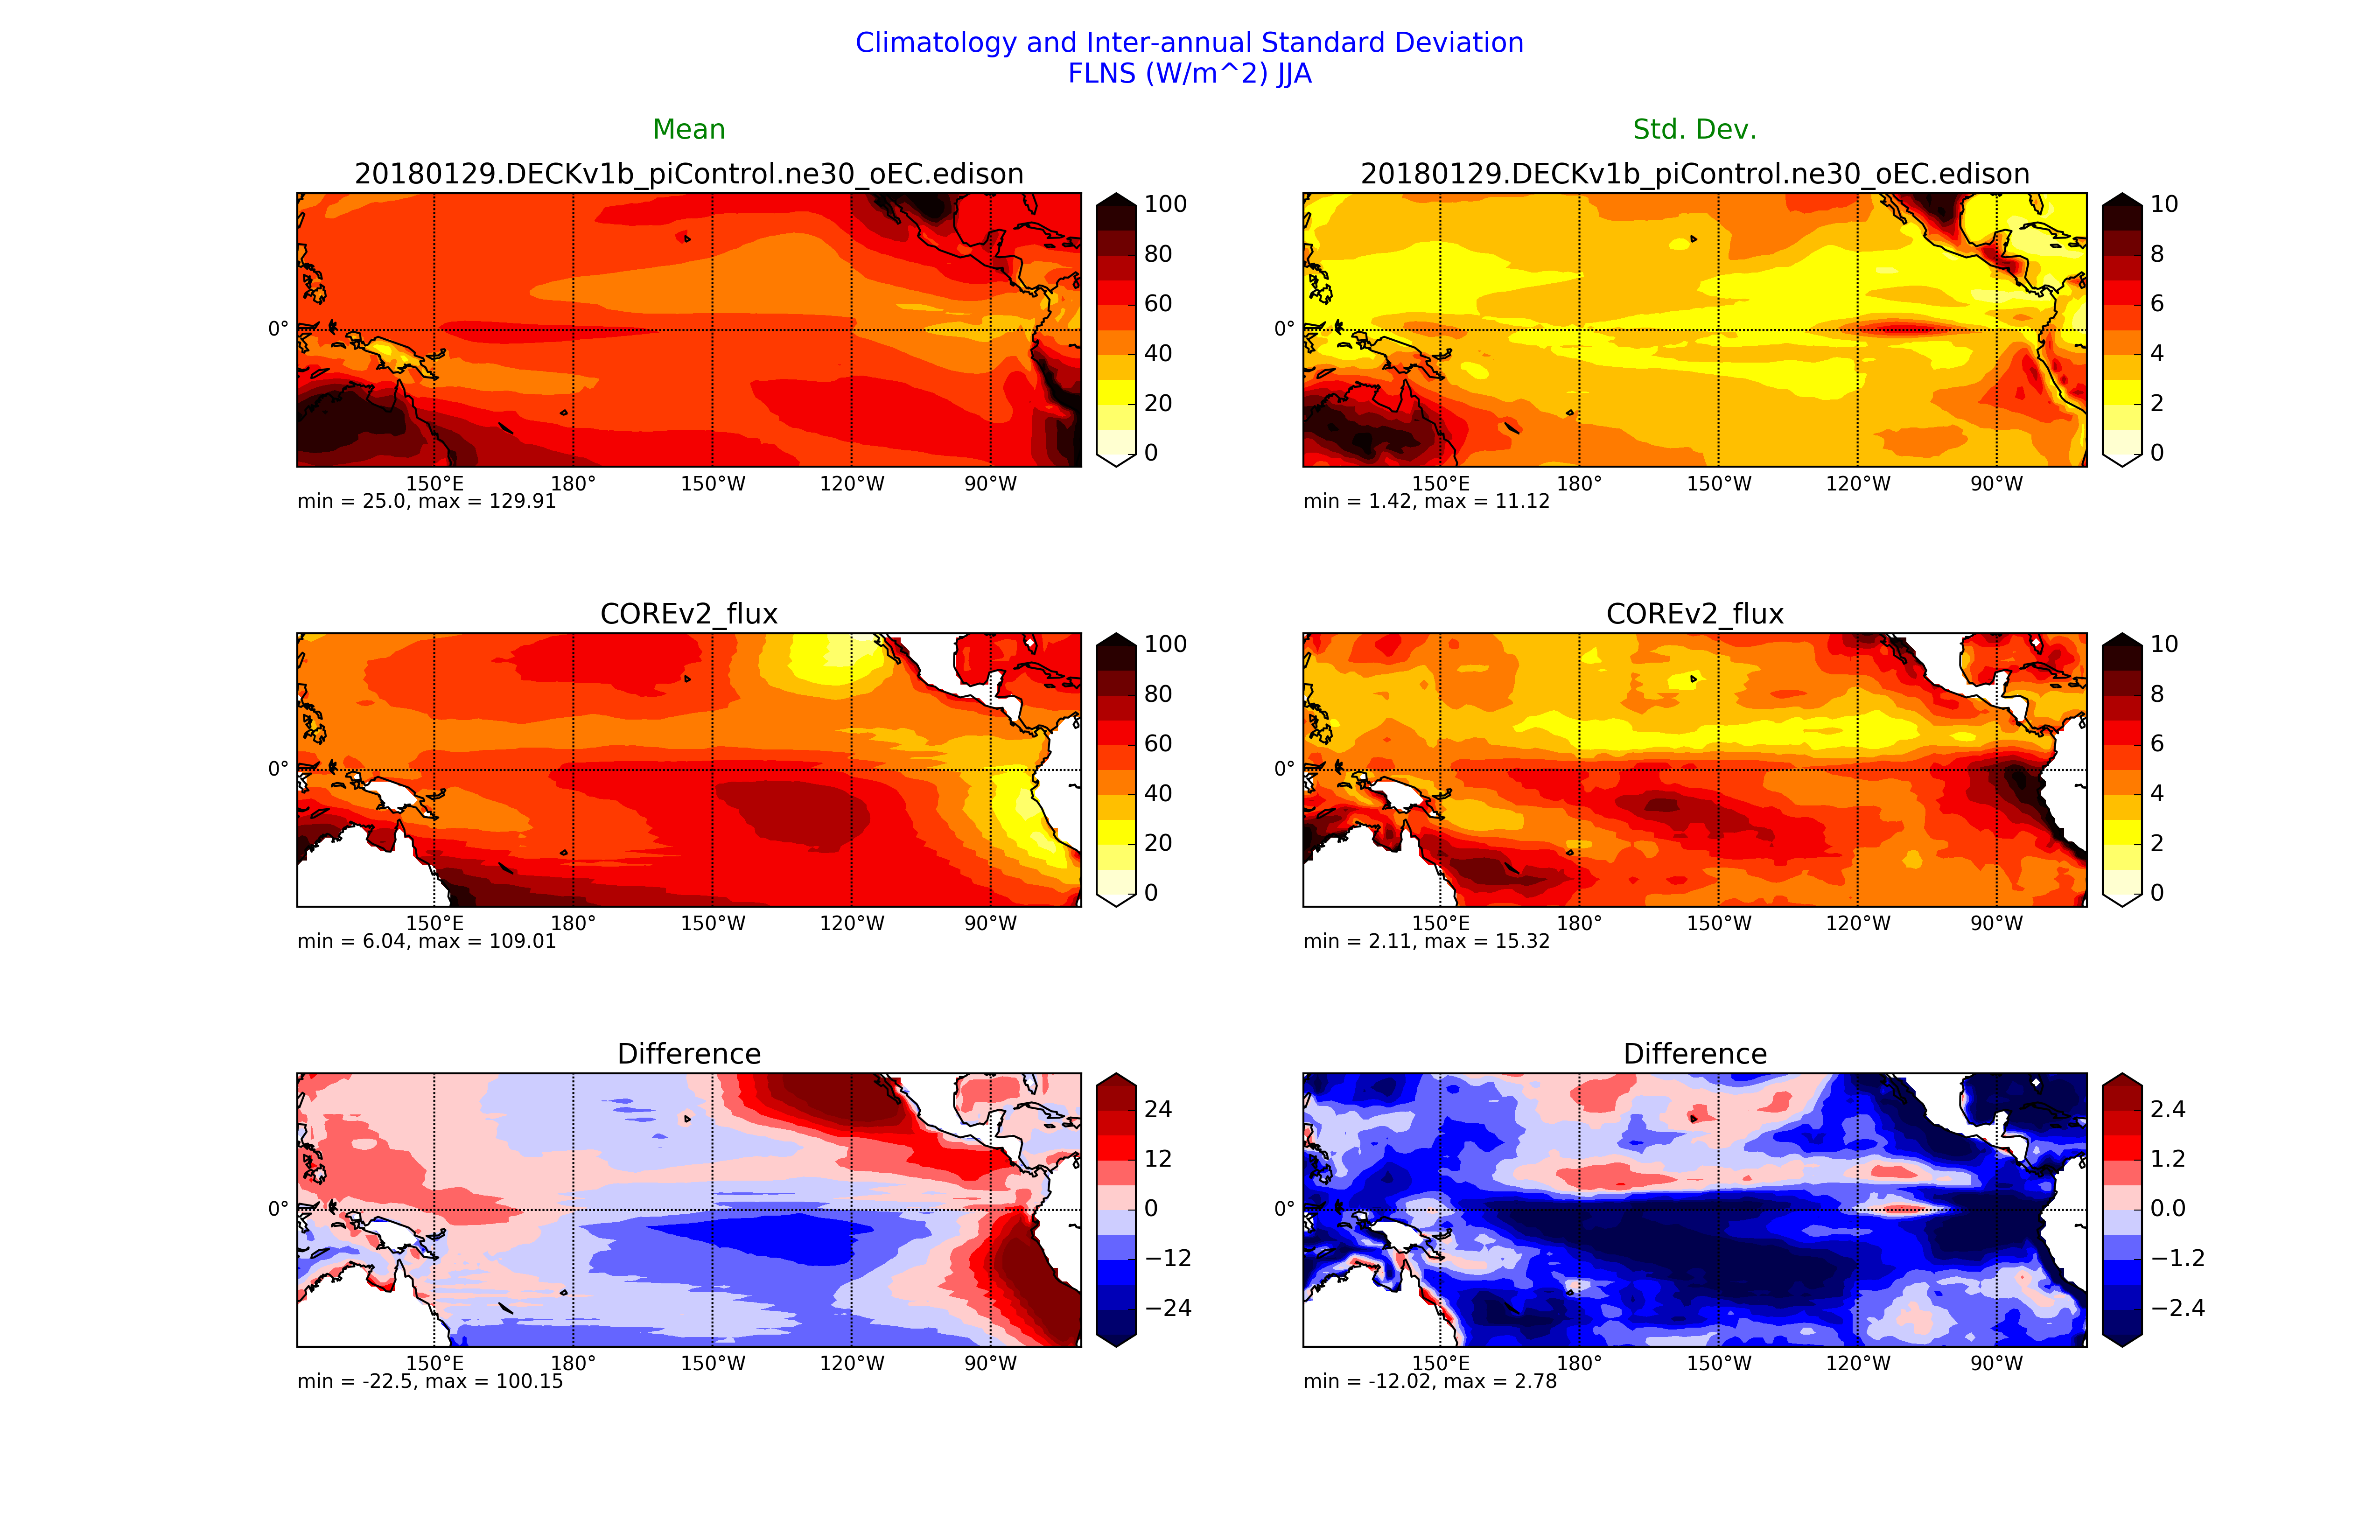
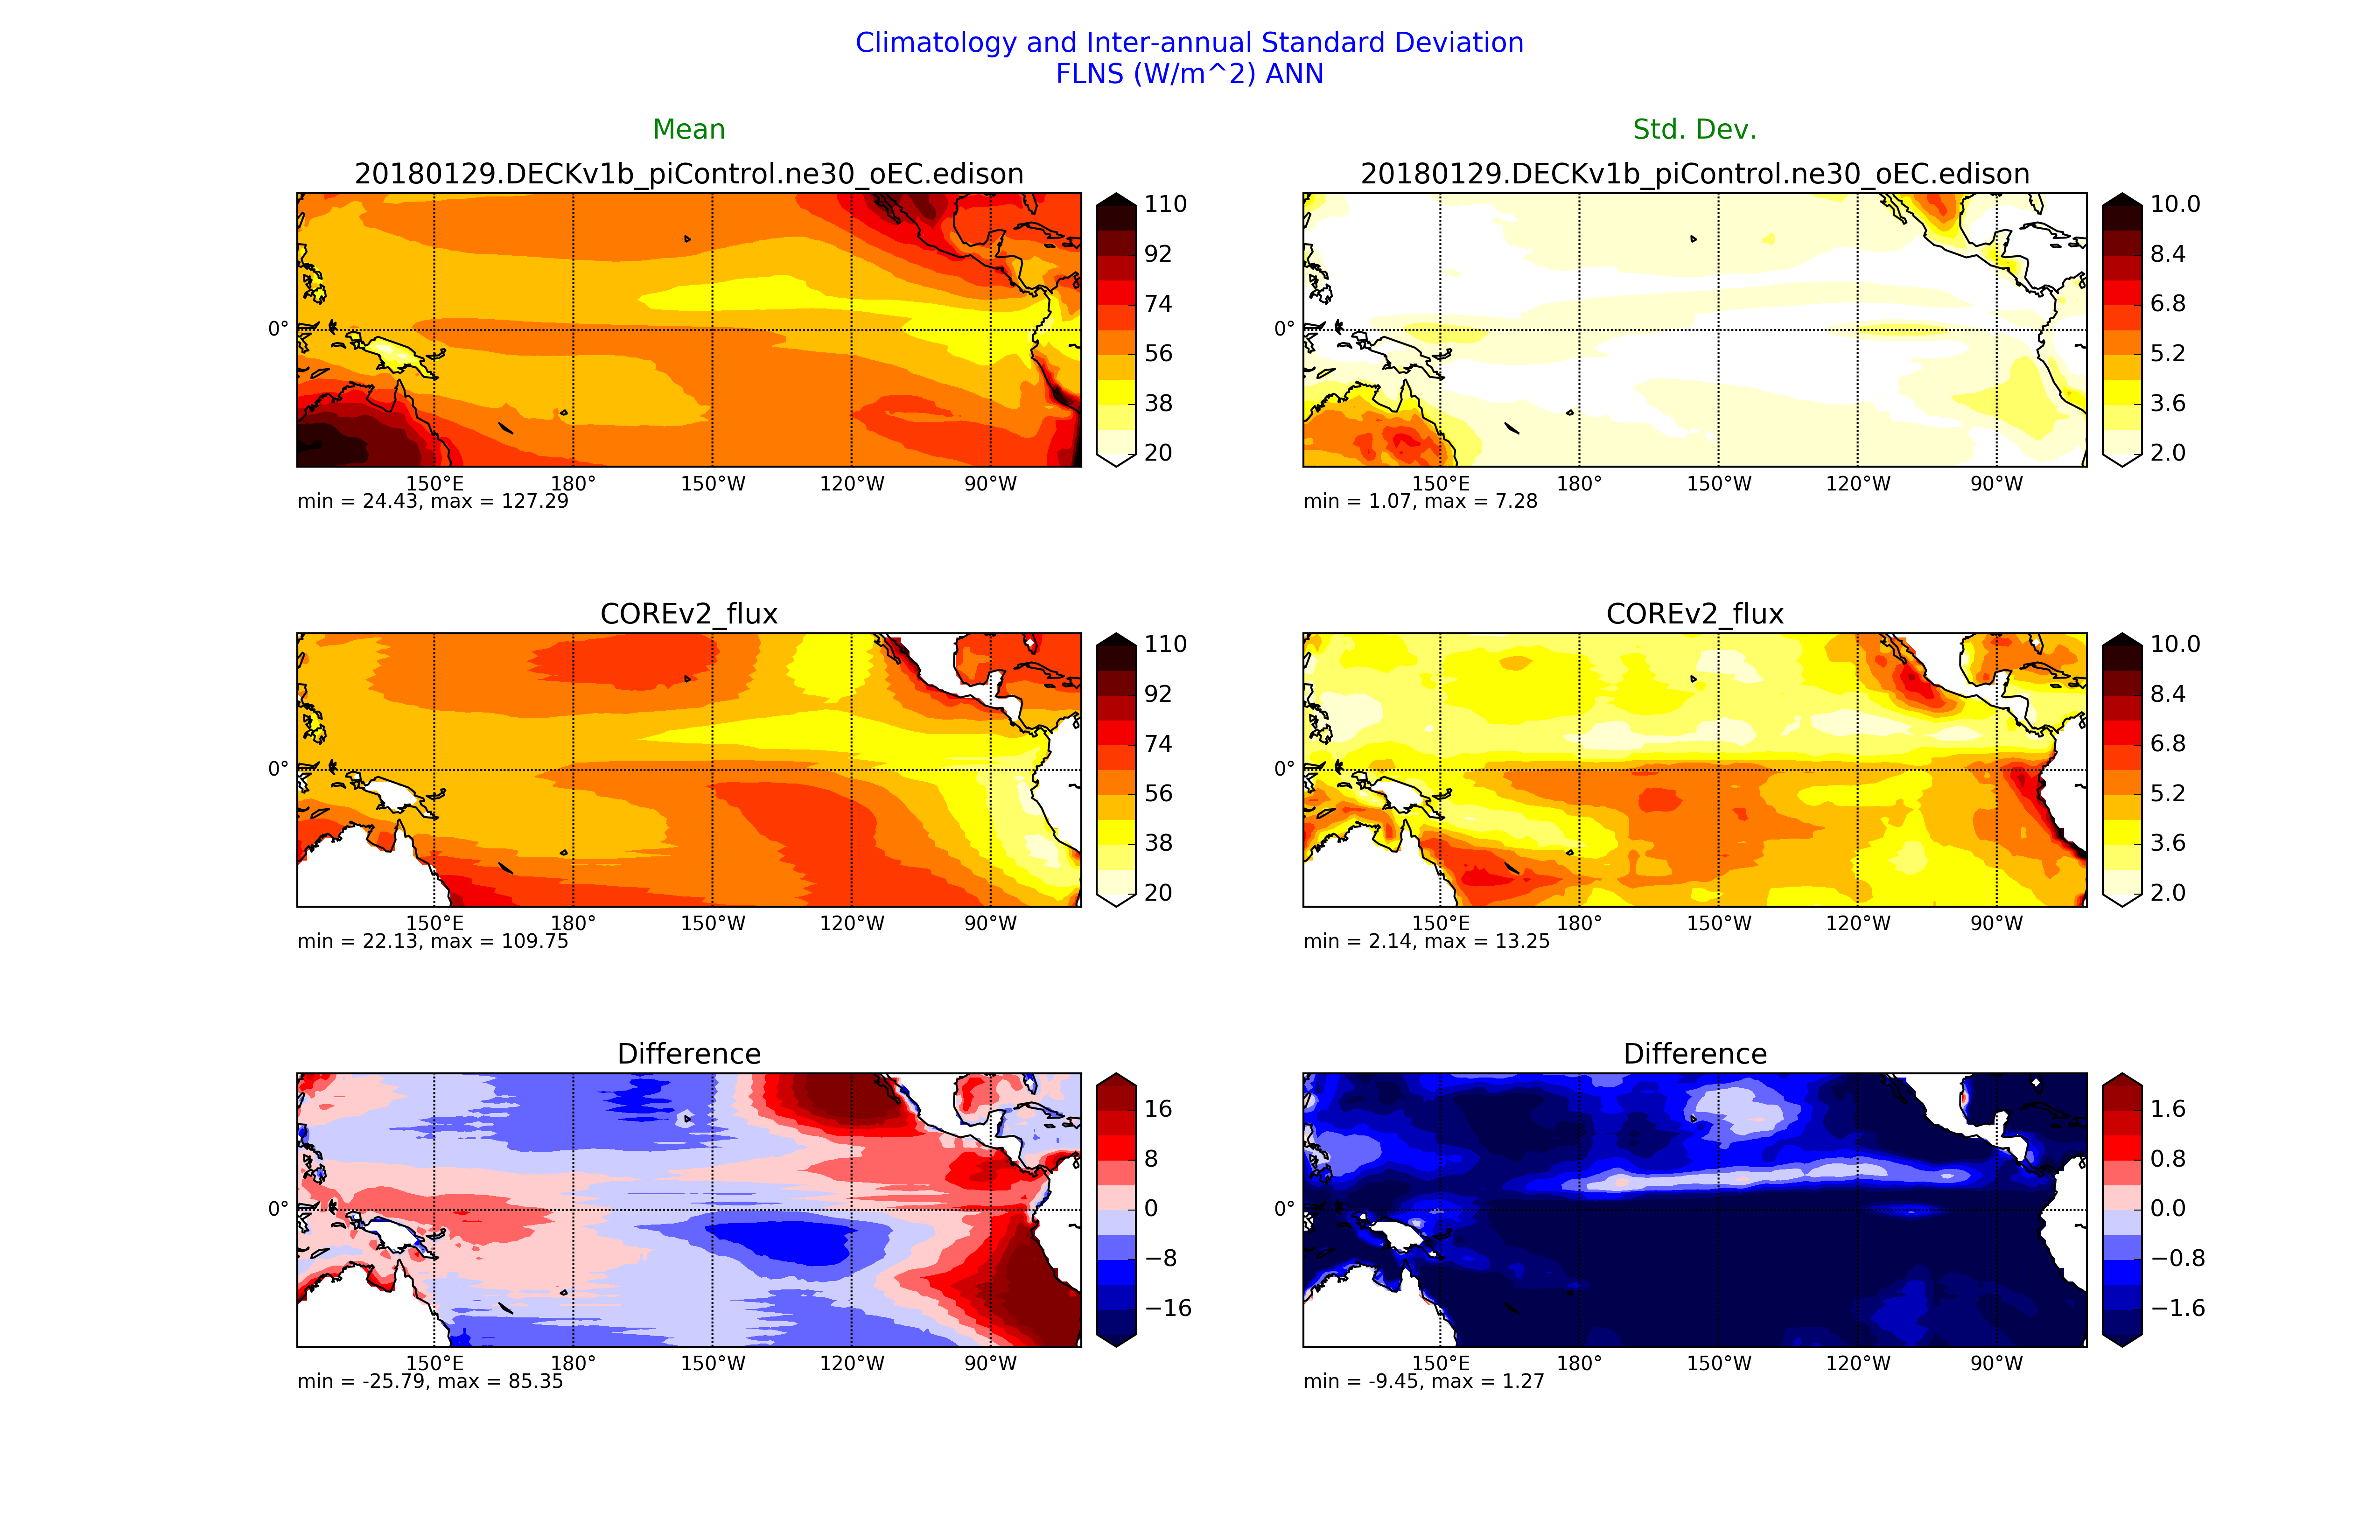
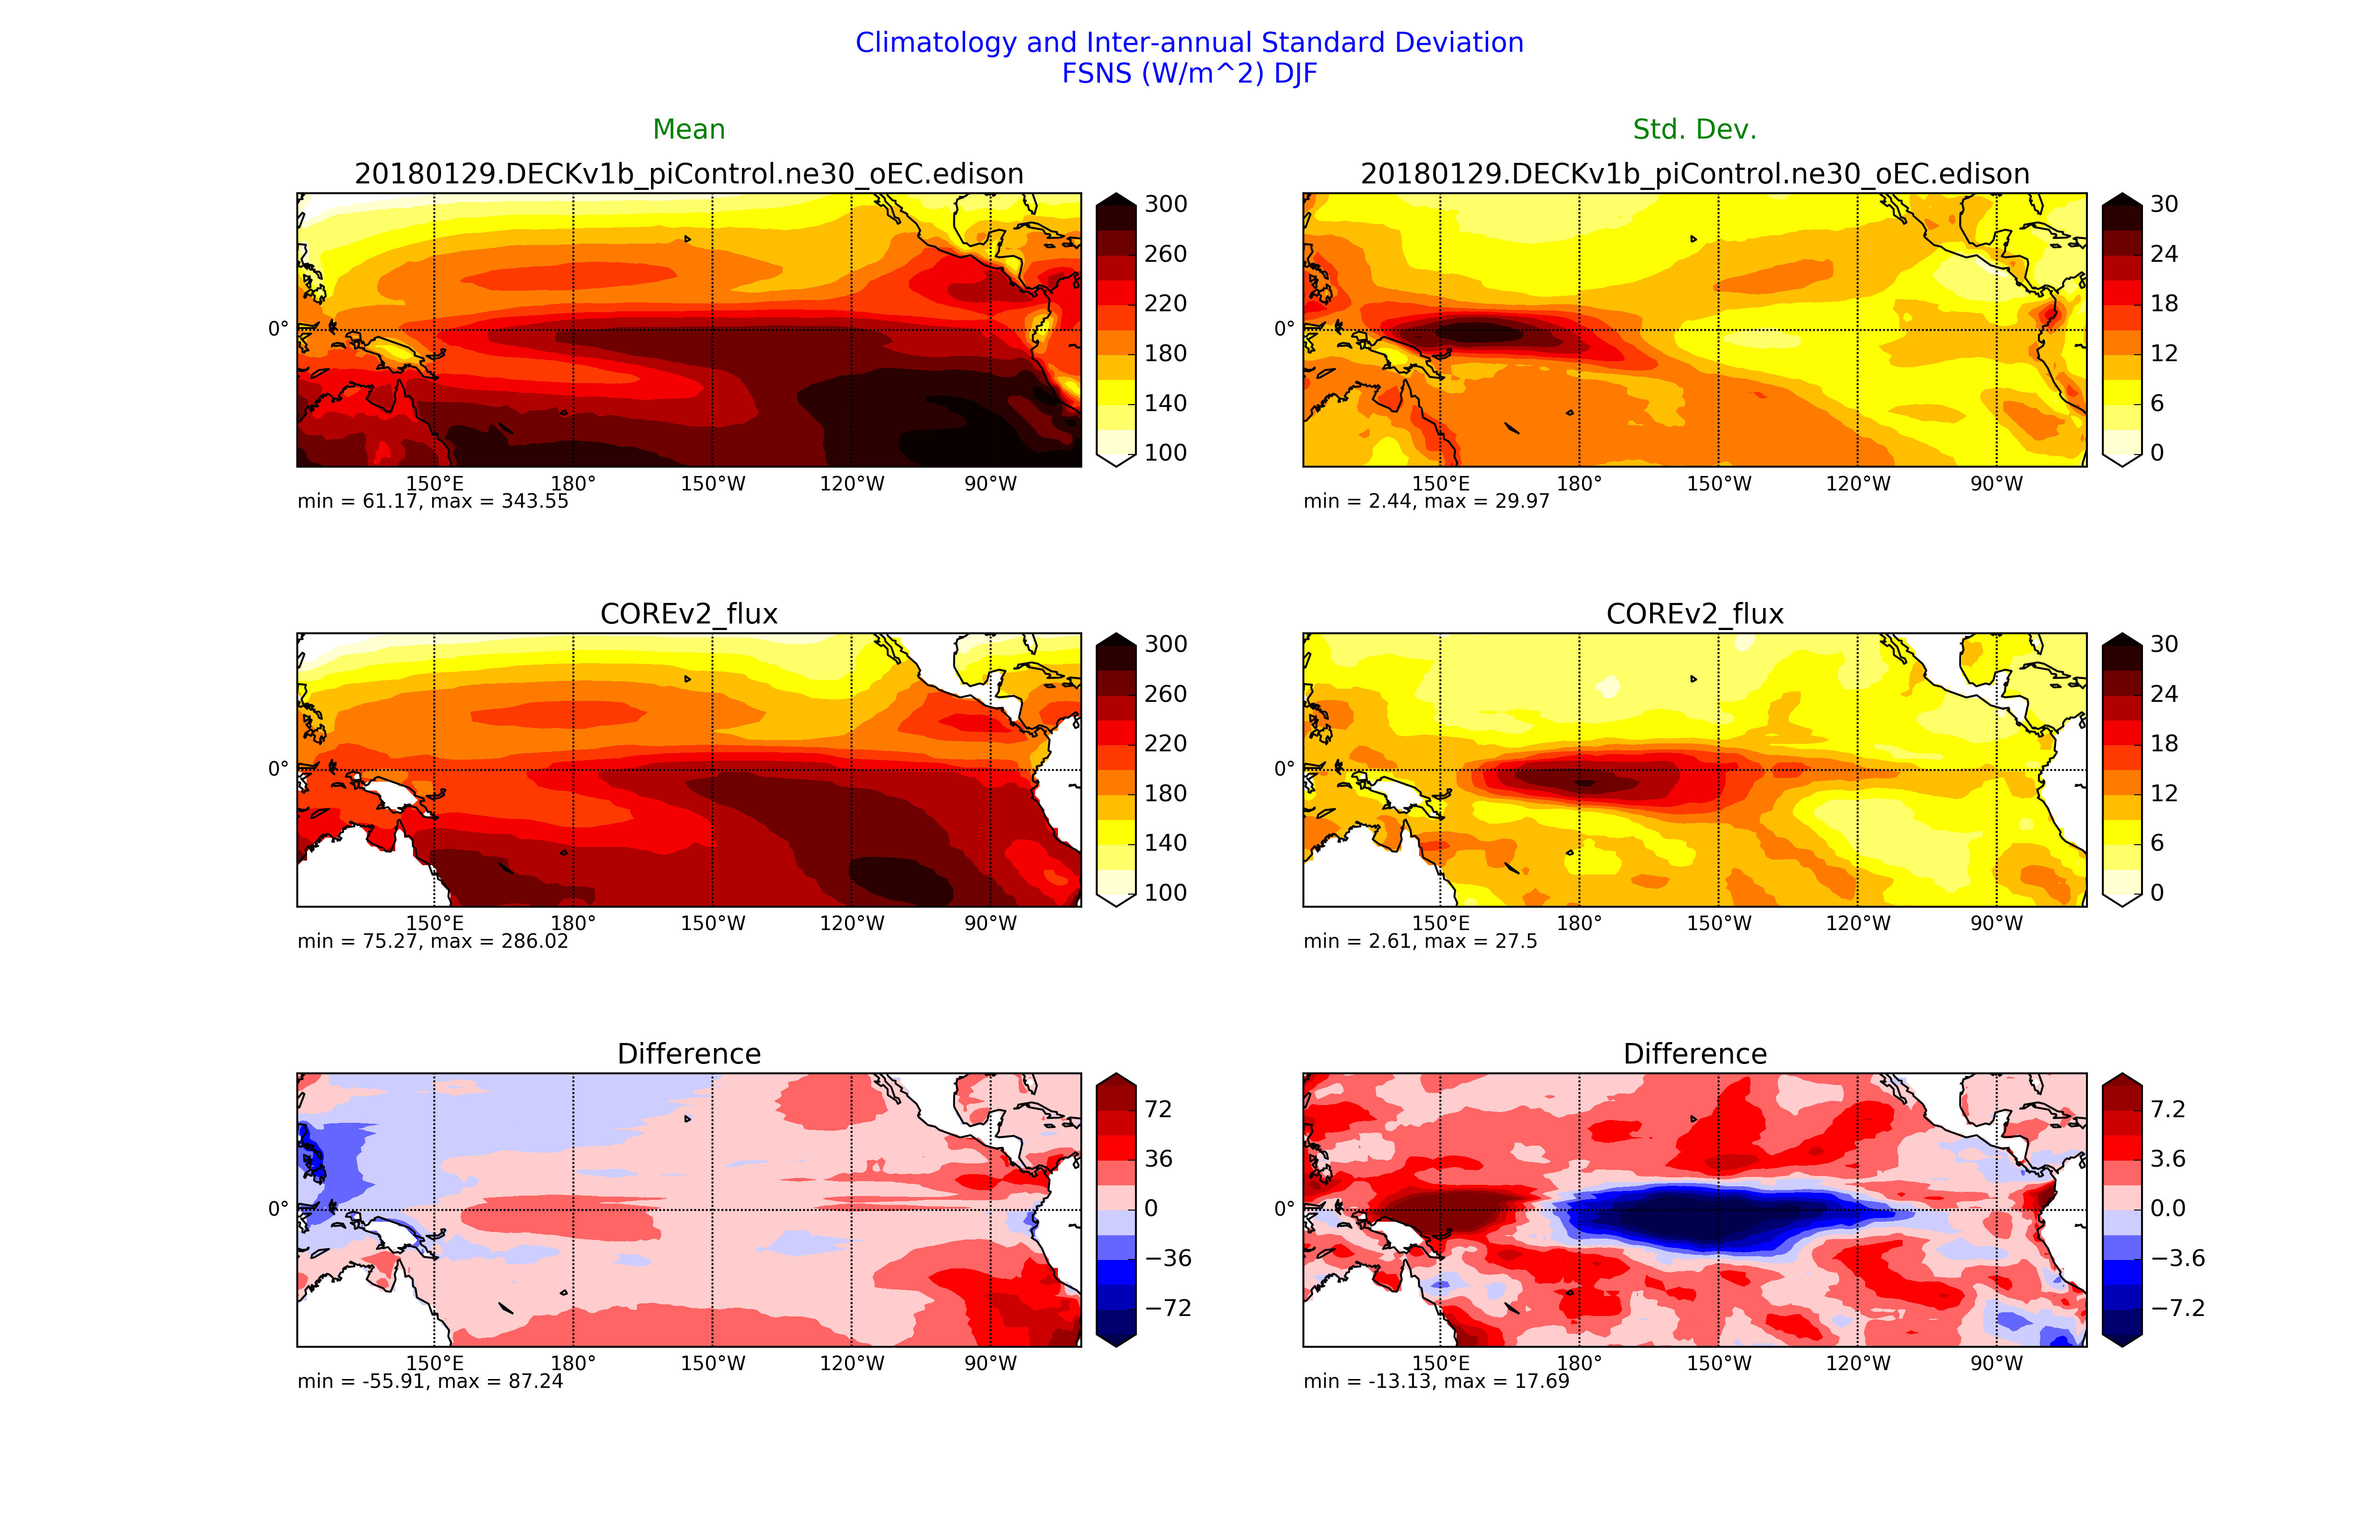
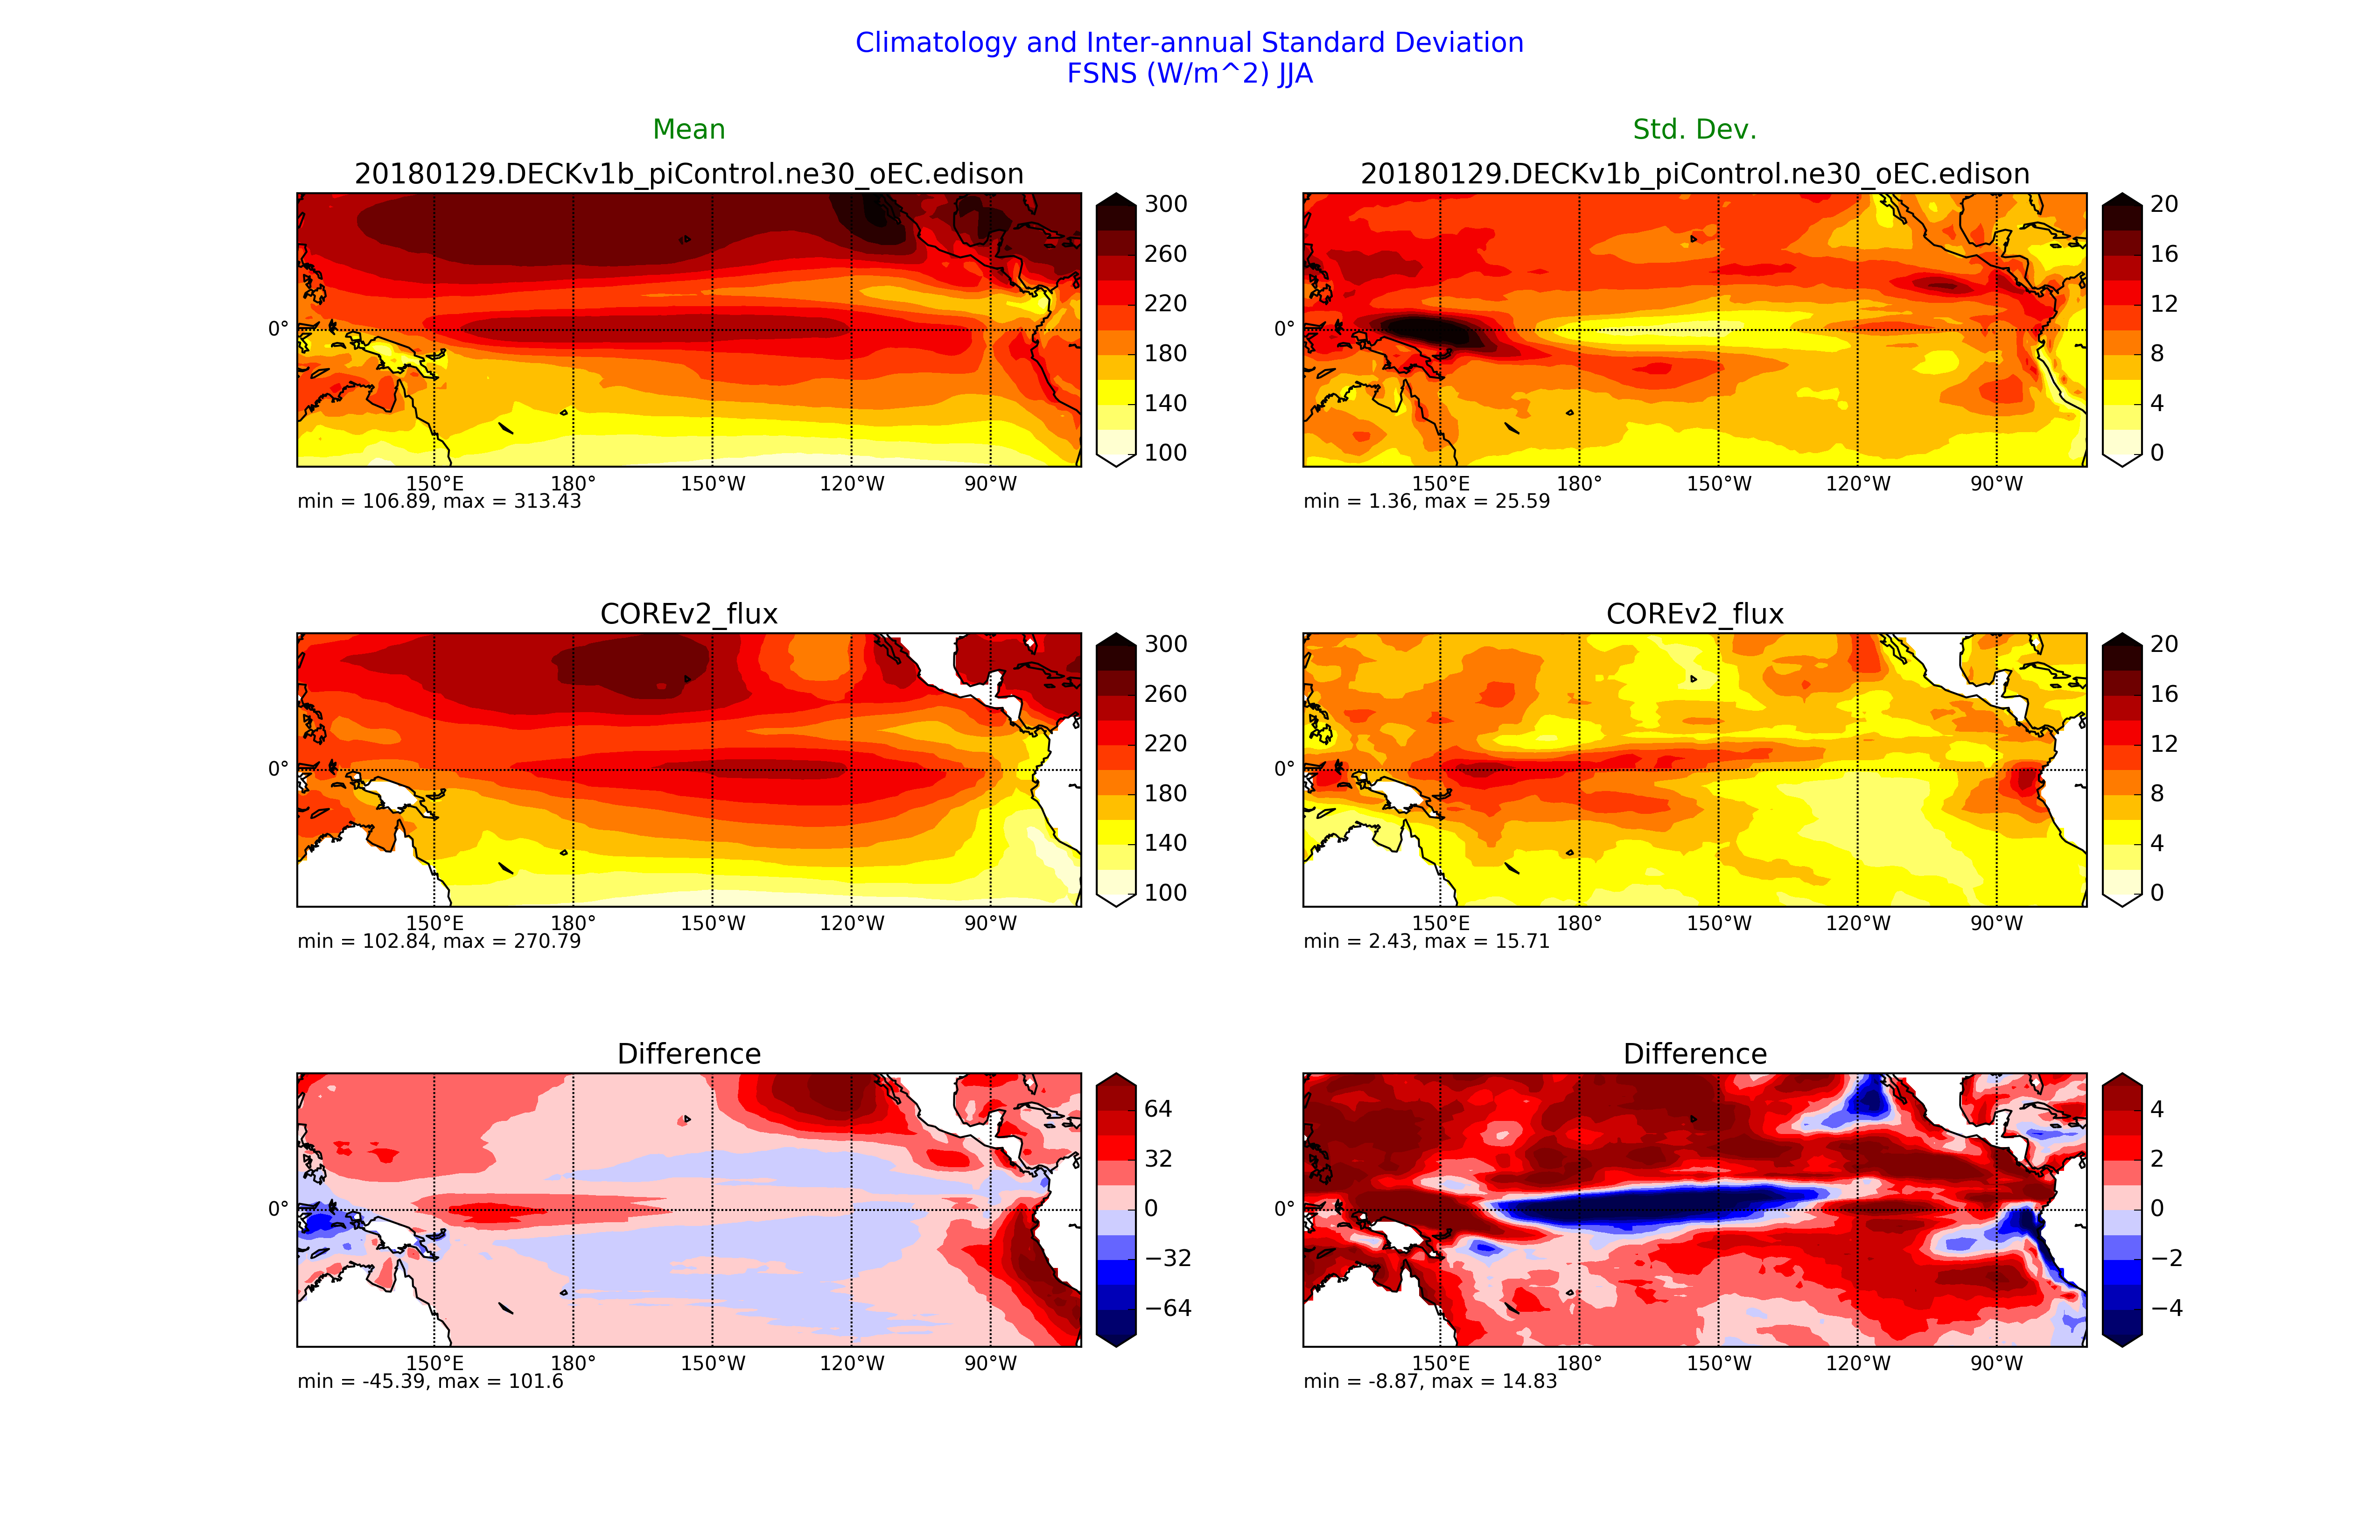
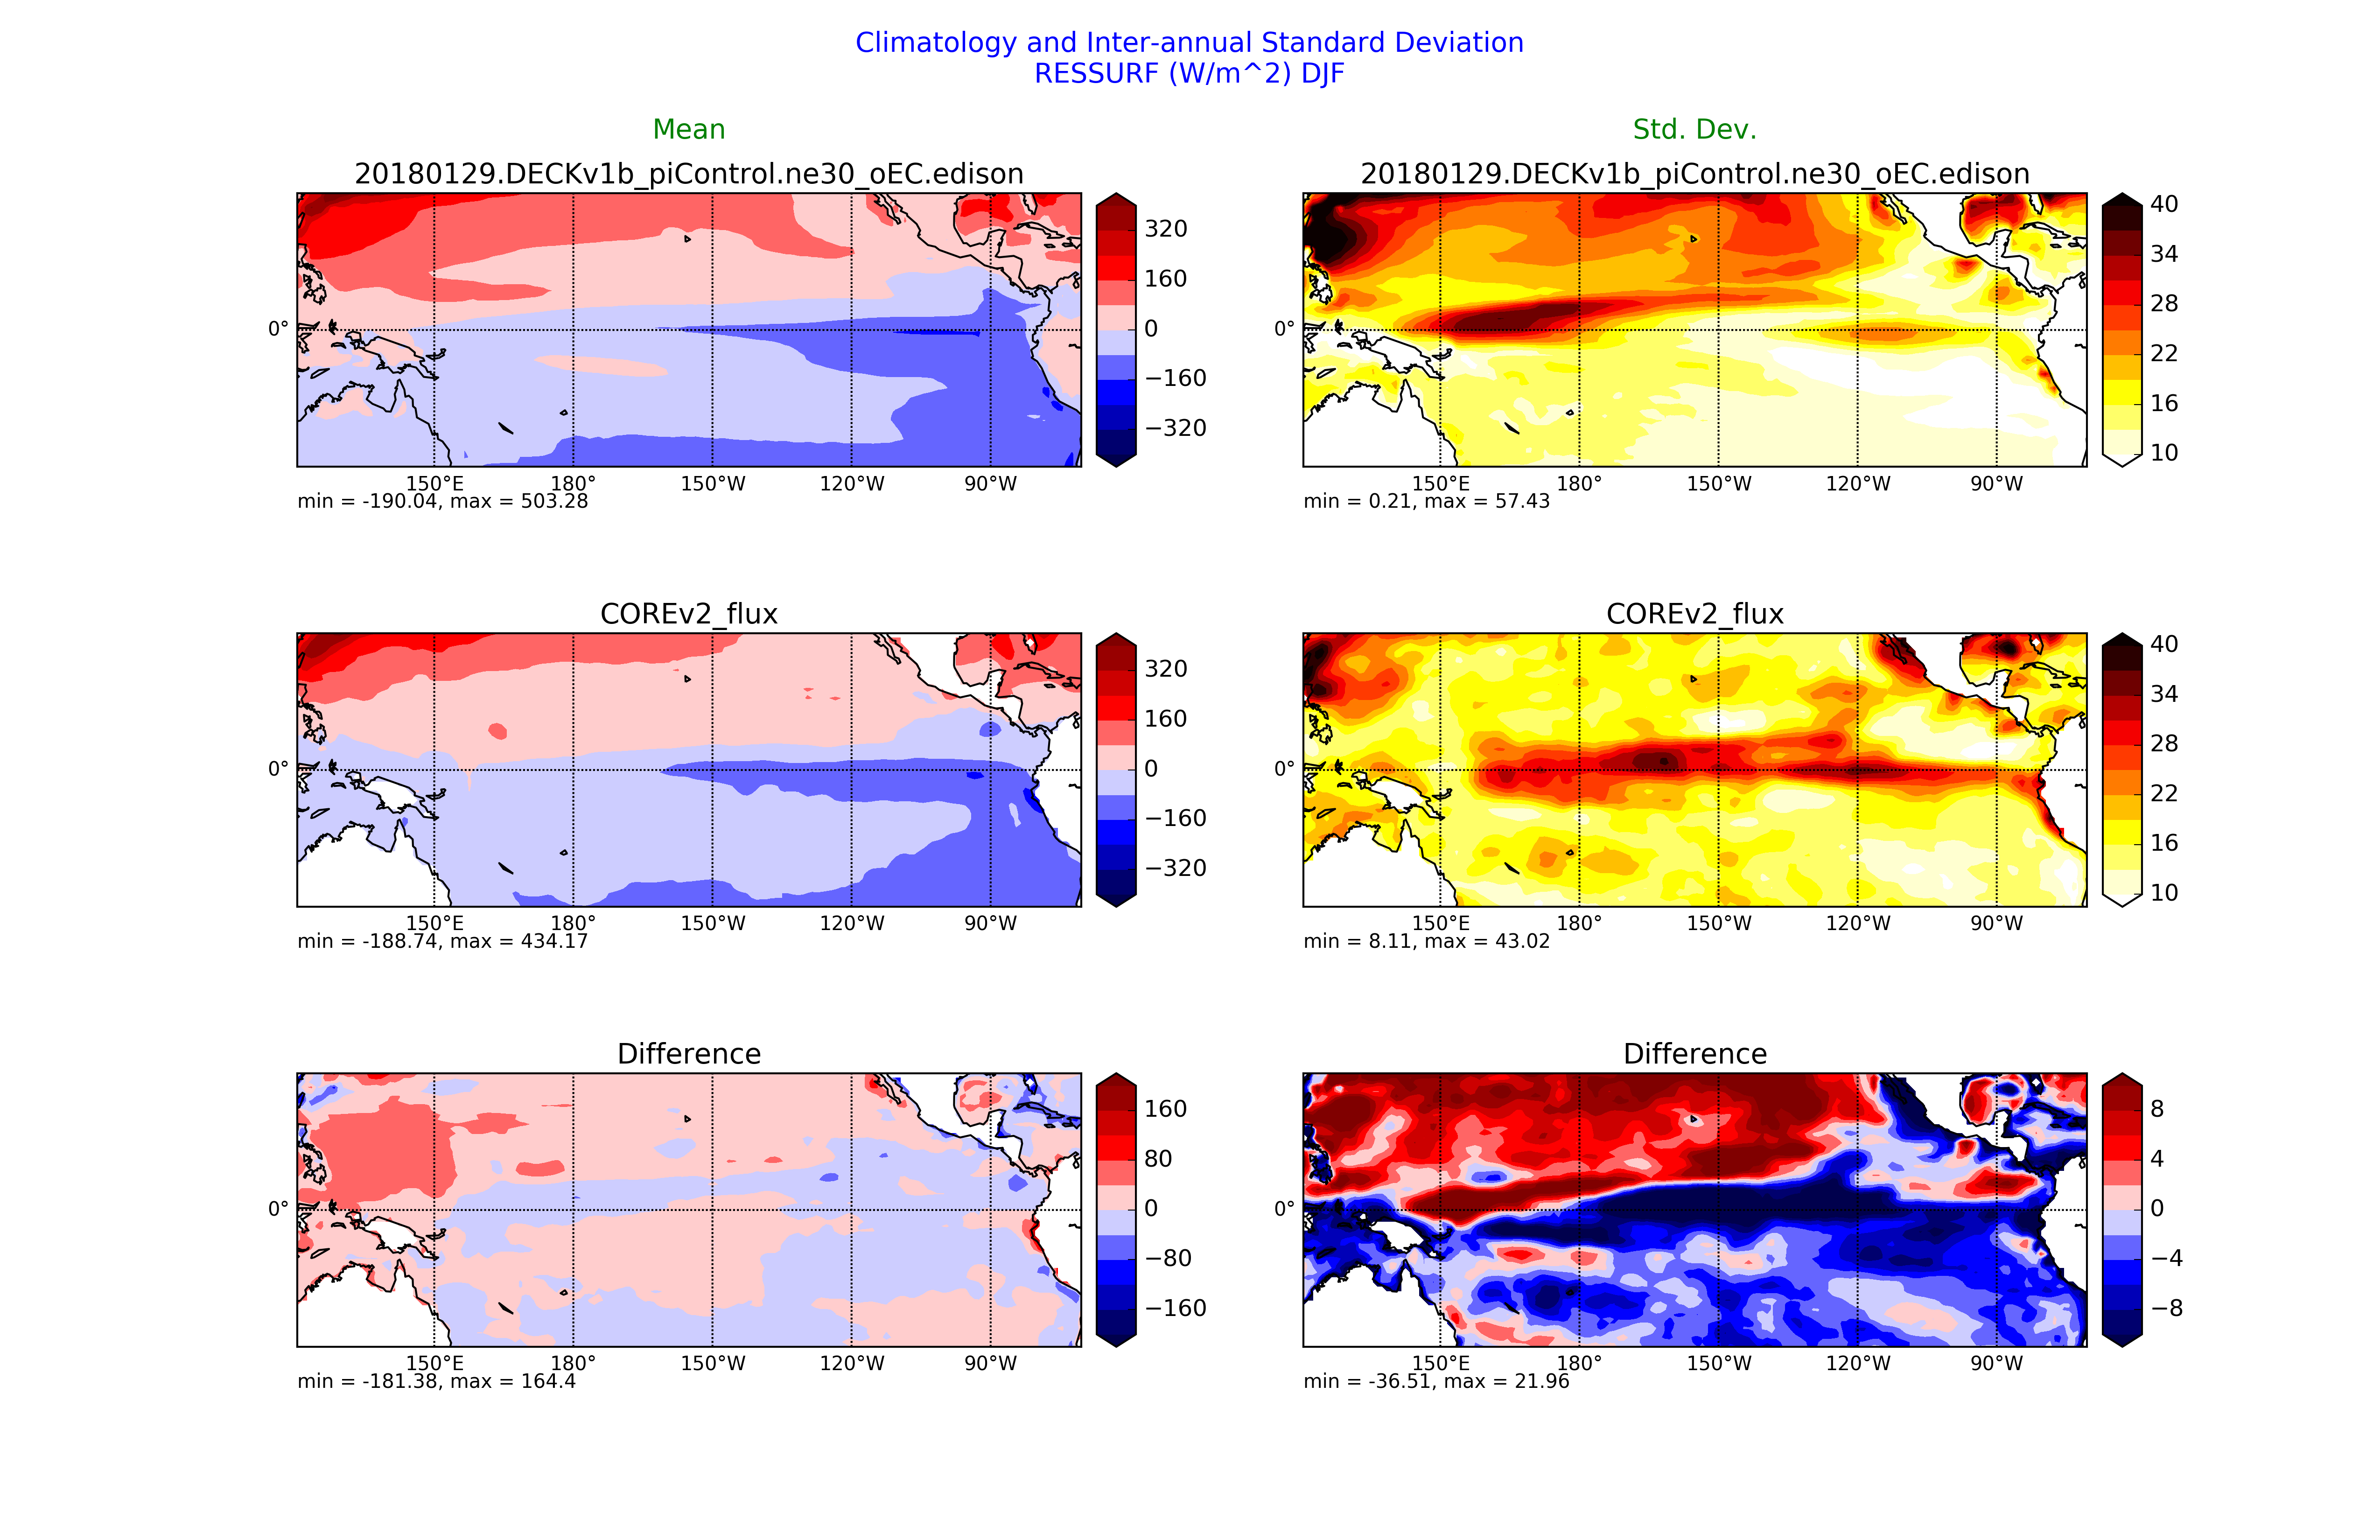
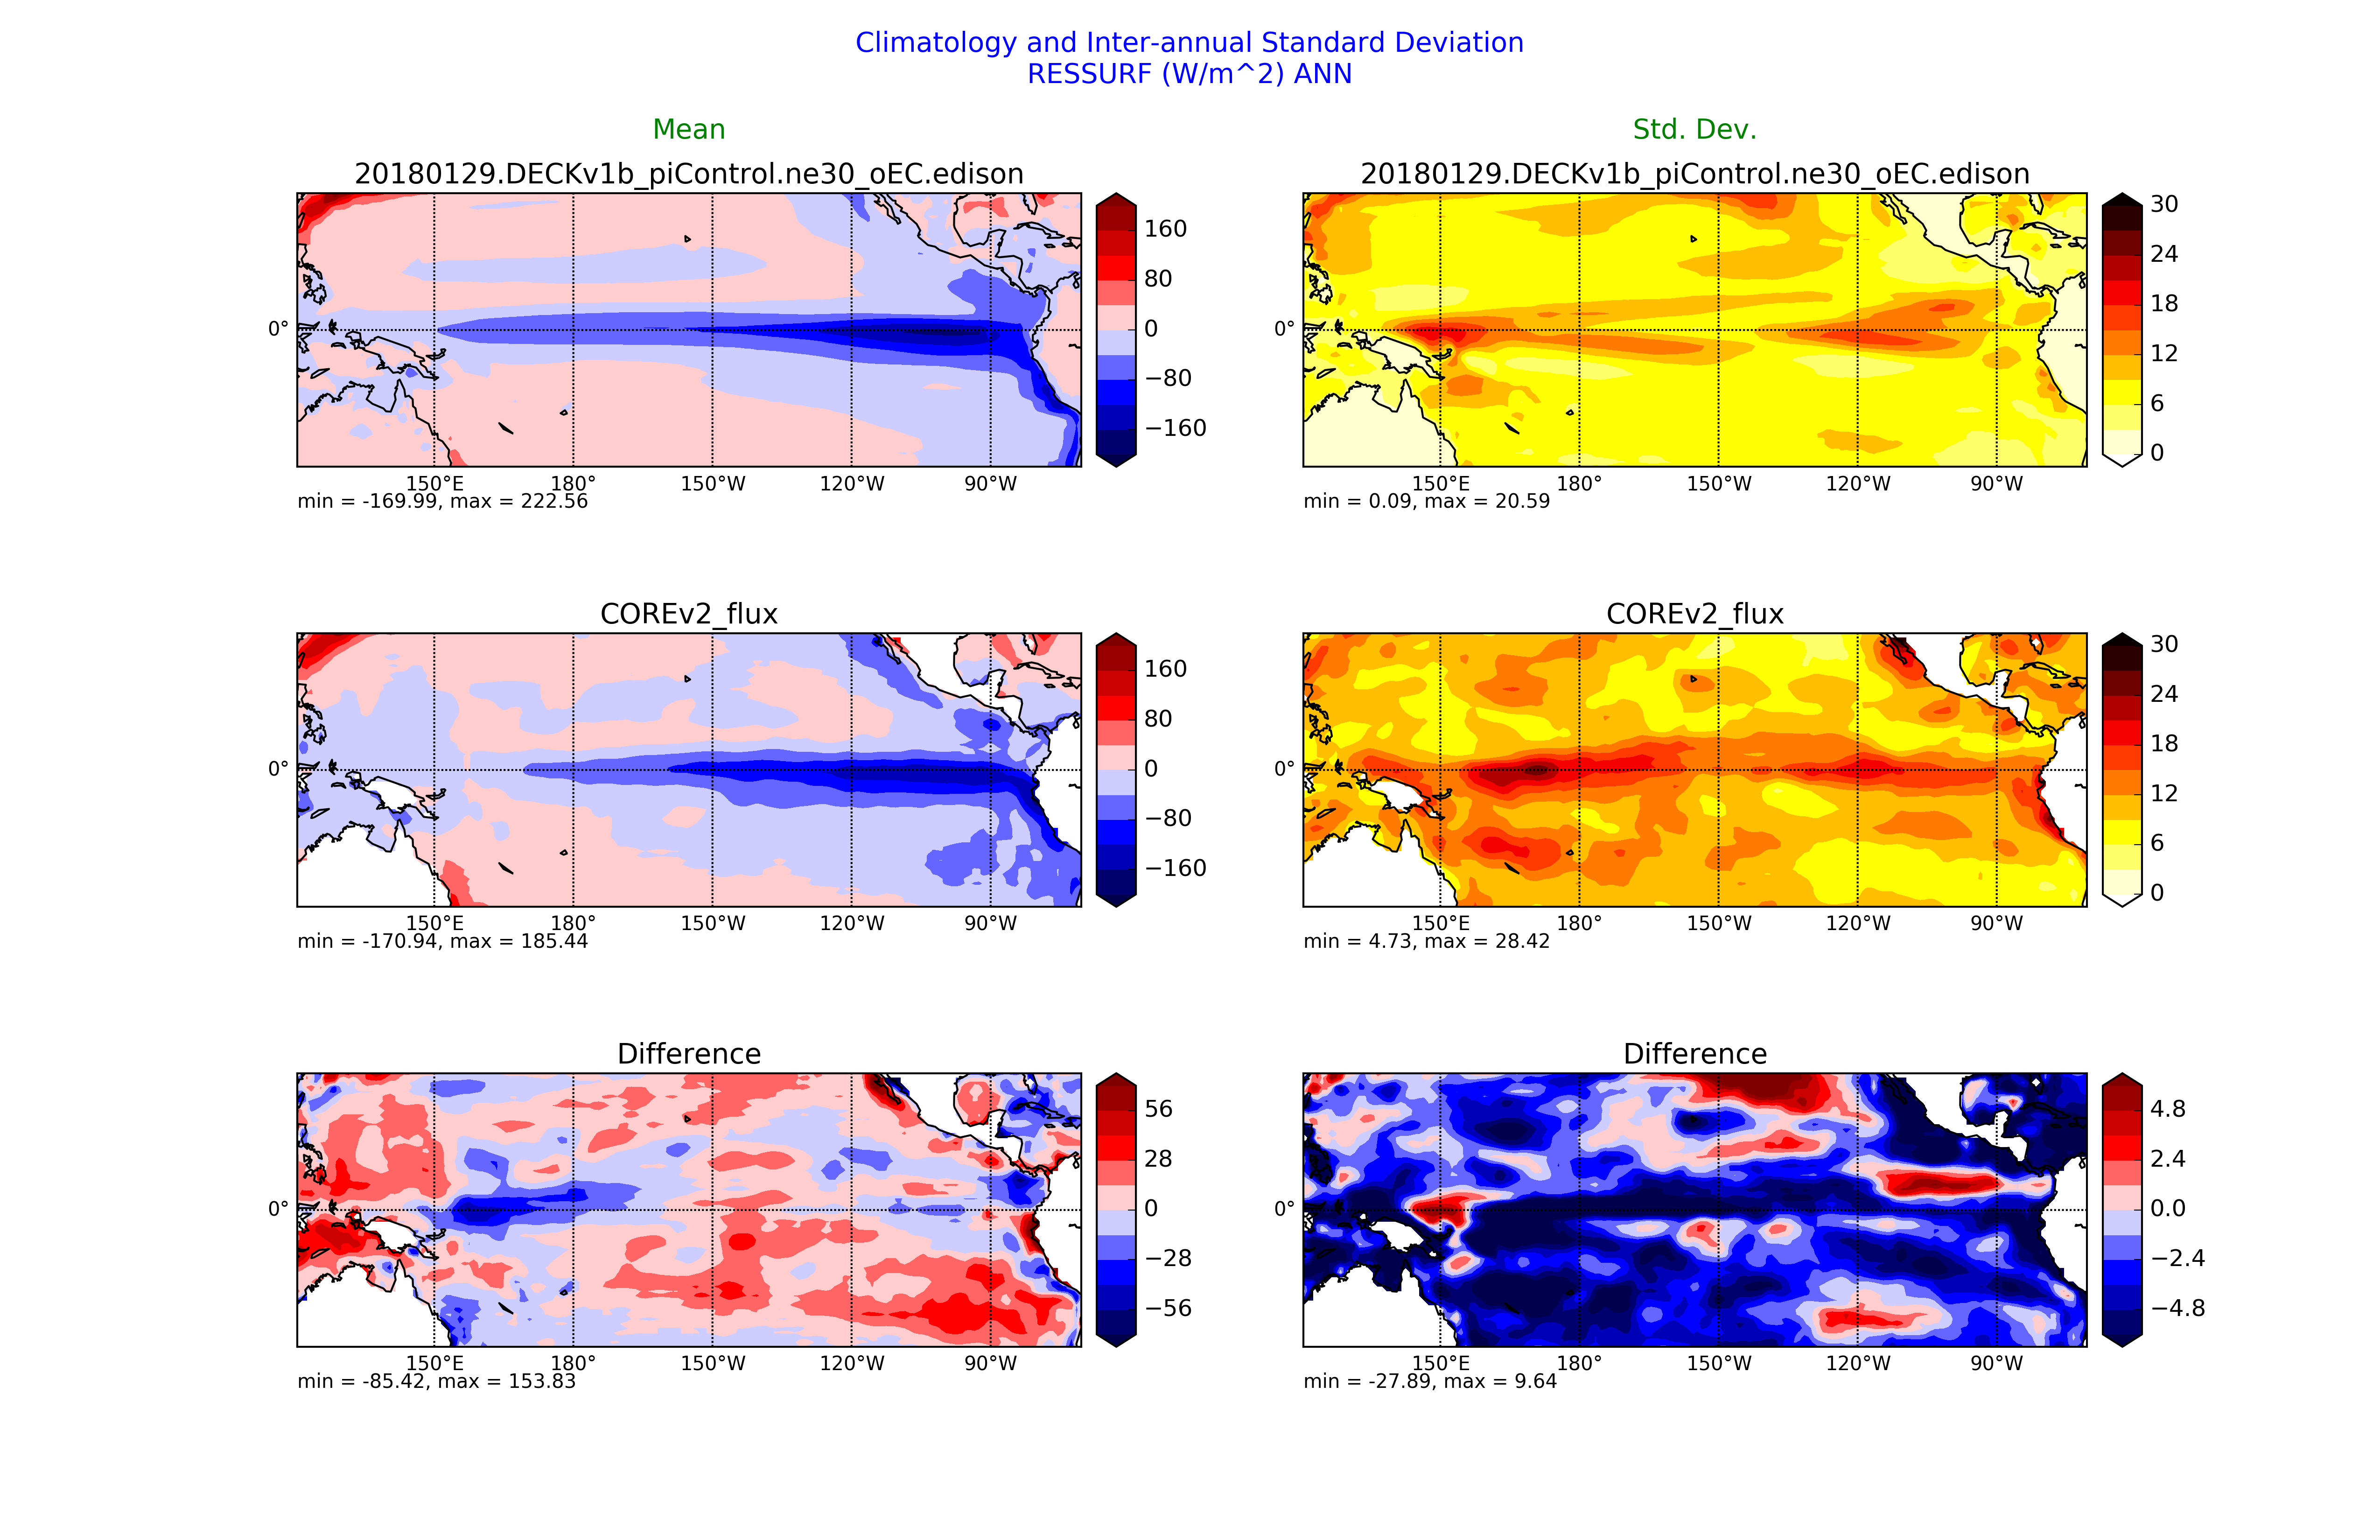
Tropical Pacific: Inter-annual Std. Dev.
| Precipitation (COREv2)
| DJF
| JJA
| ANN
|
| PRECT
| Precipitation Rate
| plot
| plot
| plot
|
|
| Temperature (NCEP2)
| DJF
| JJA
| ANN
|
| TS
| Surface Temperature
| plot
| plot
| plot
|
|
| Sea Level Pressure (NCEP2_surface)
| DJF
| JJA
| ANN
|
| PSL
| Sea Level Pressure
| plot
| plot
| plot
|
|
| Wind Stress (COREv2_flux)
| DJF
| JJA
| ANN
|
| TAUX
| Ocean Zonal Wind Stress
| plot
| plot
| plot
|
|
| Surface Heat Flux (COREv2_flux)
| DJF
| JJA
| ANN
|
| LHFLX
| Latent Heat Flux
| plot
| plot
| plot
|
| SHFLX
| Sensible Heat Flux
| plot
| plot
| plot
|
| FLNS
| Longwave Heat Flux
| plot
| plot
| plot
|
| FSNS
| Shortwave Heat Flux
| plot
| plot
| plot
|
| RESSURF
| Surface Net Heat Flux
| plot
| plot
| plot
|
|
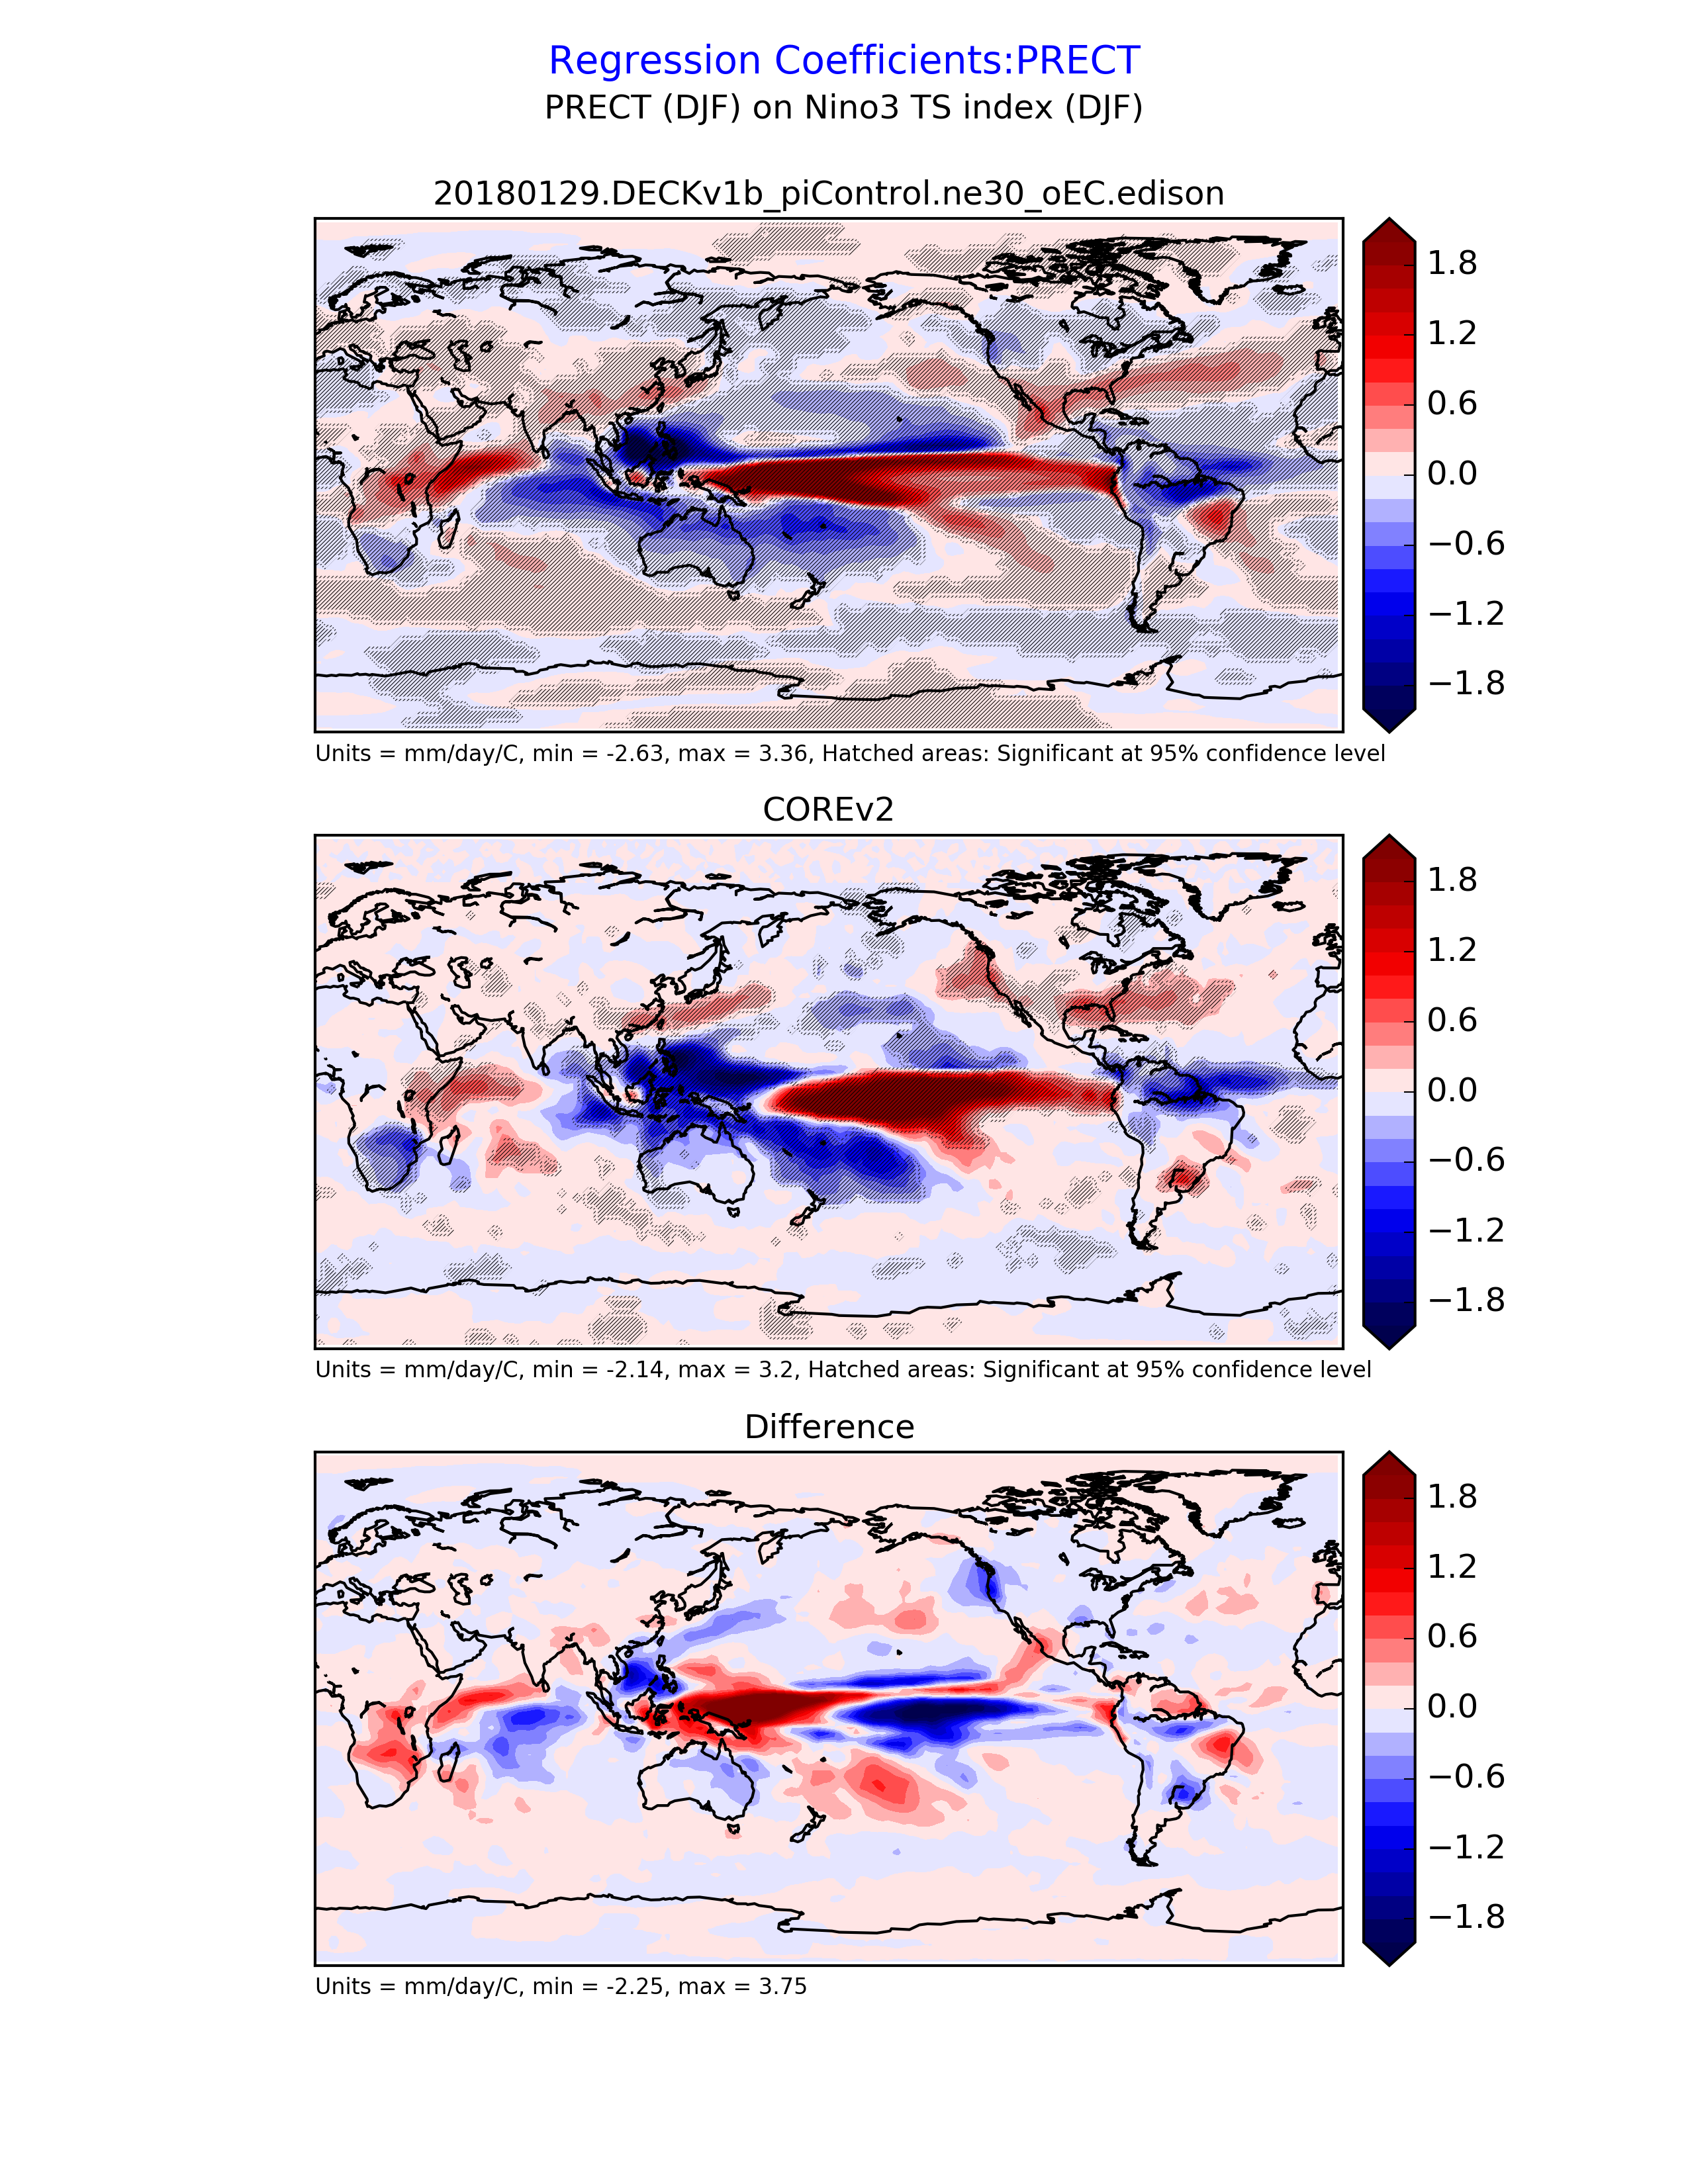
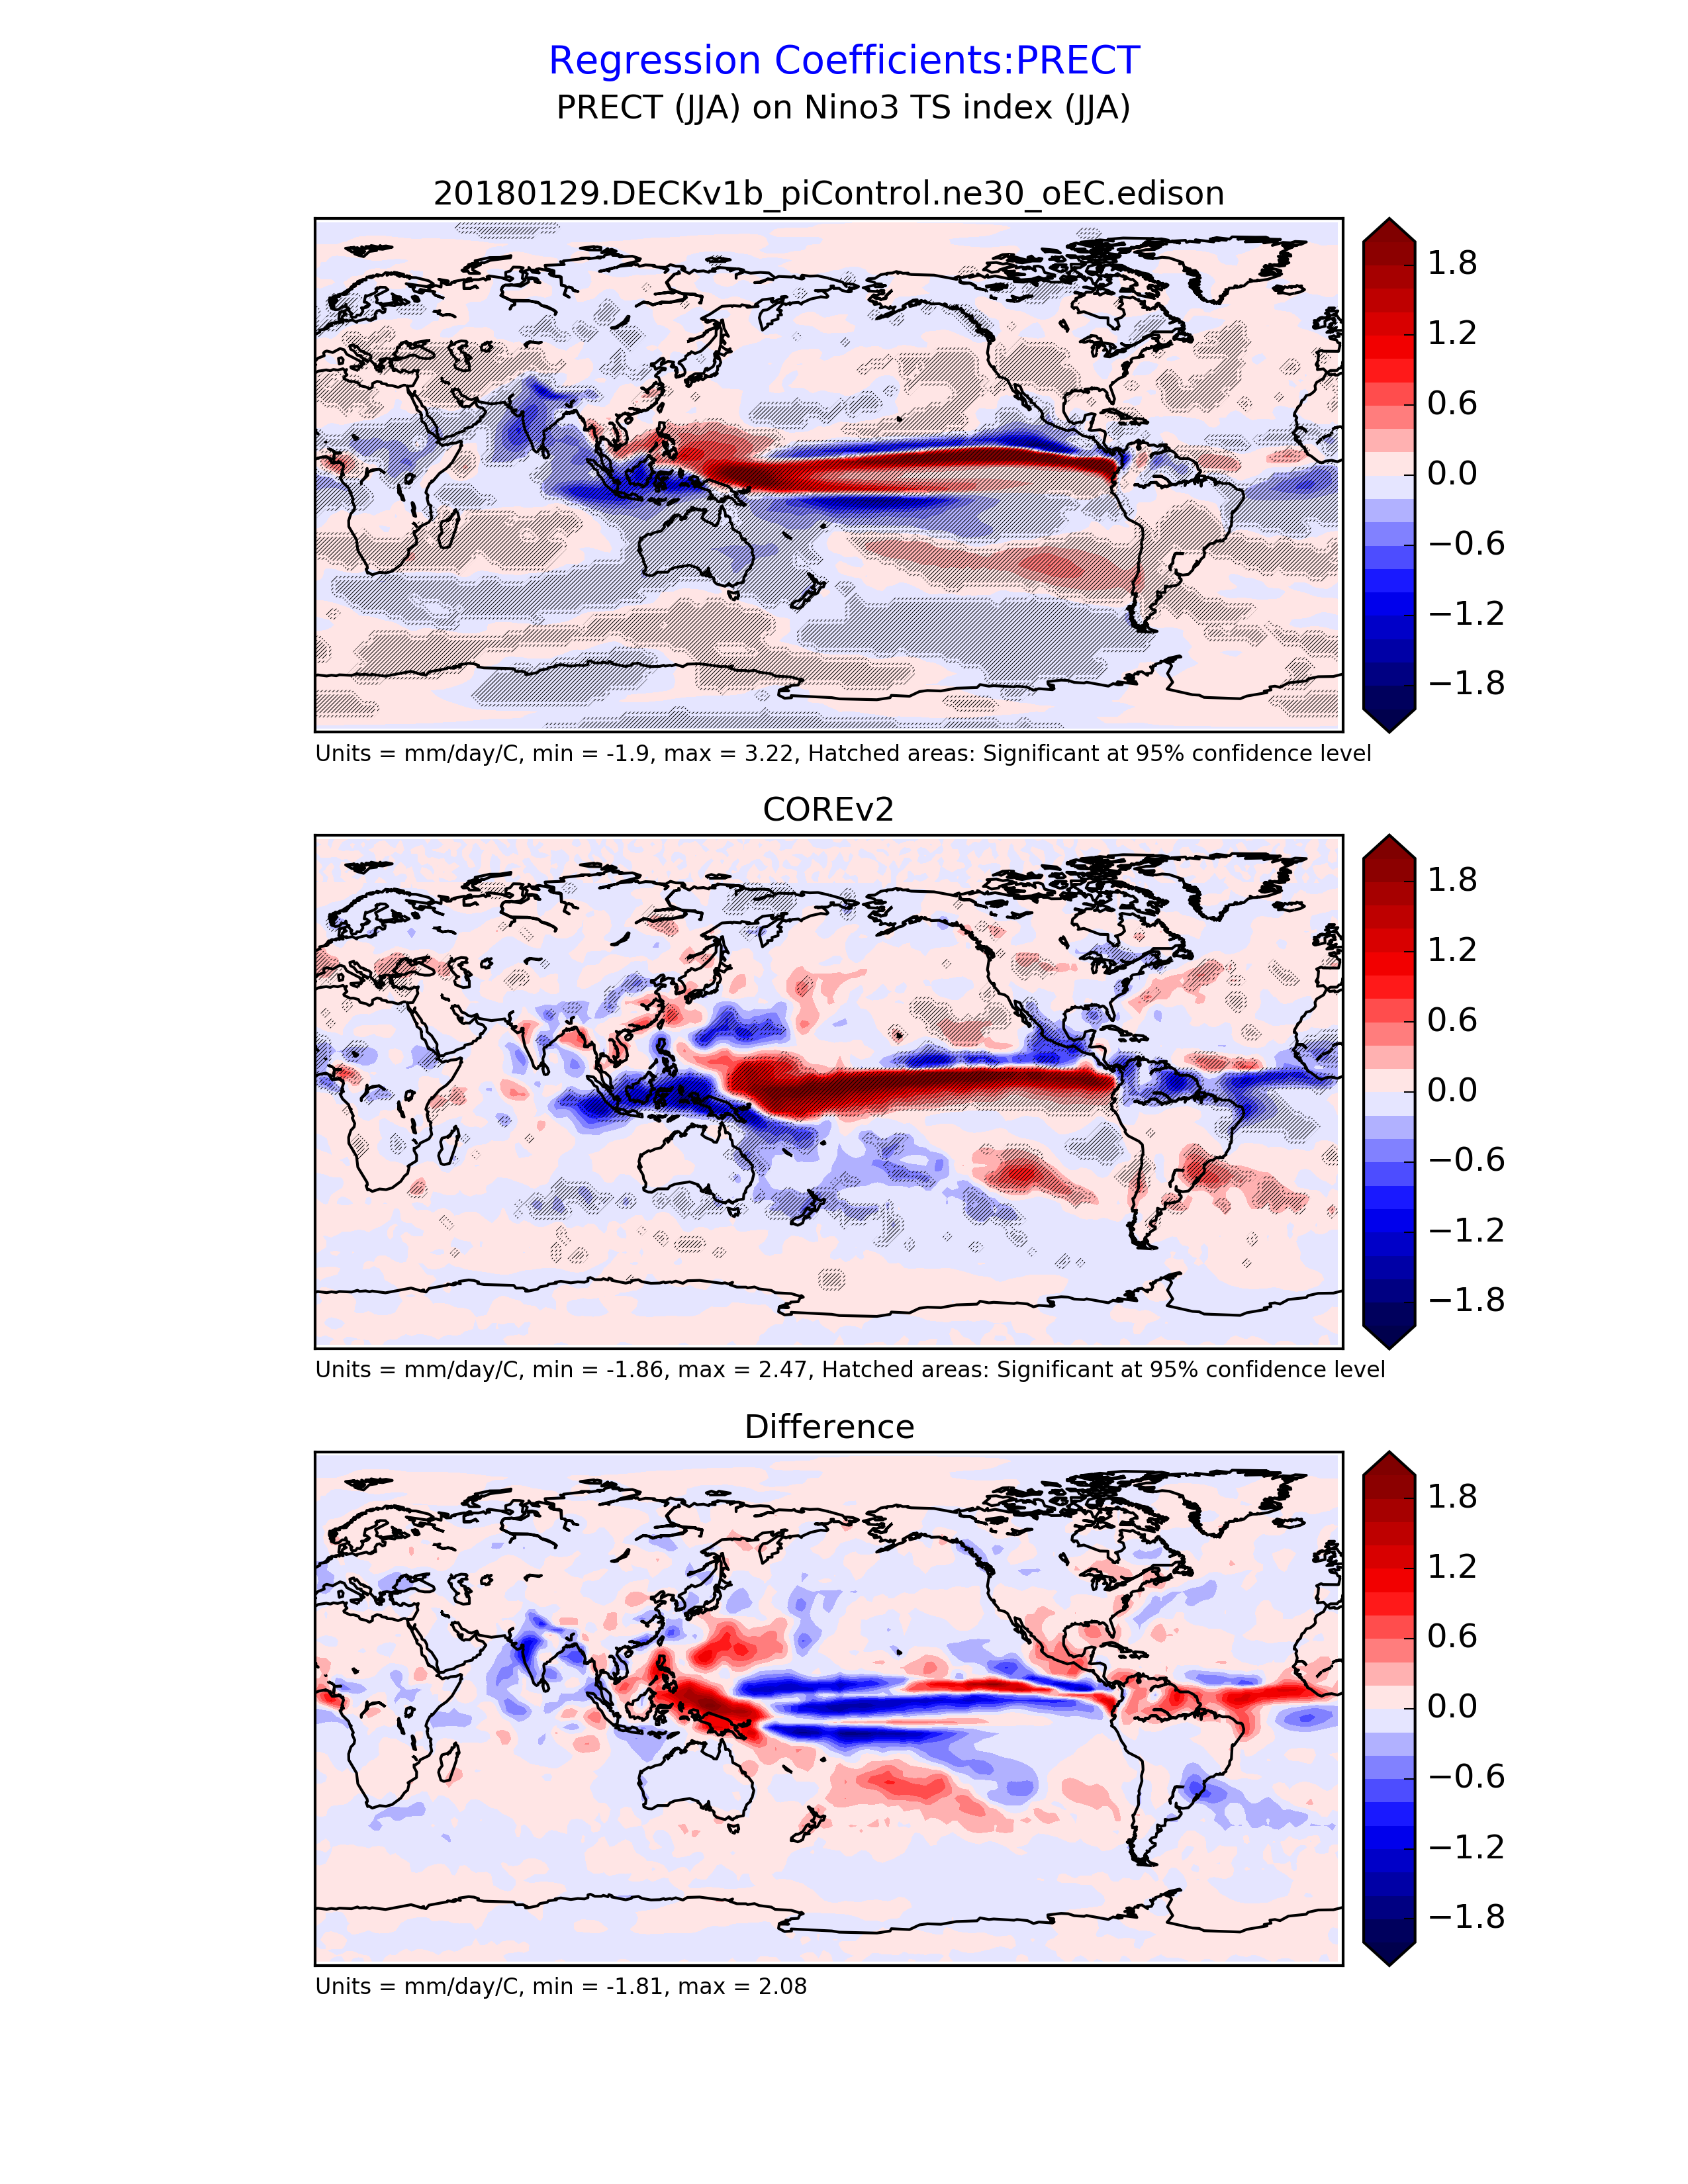
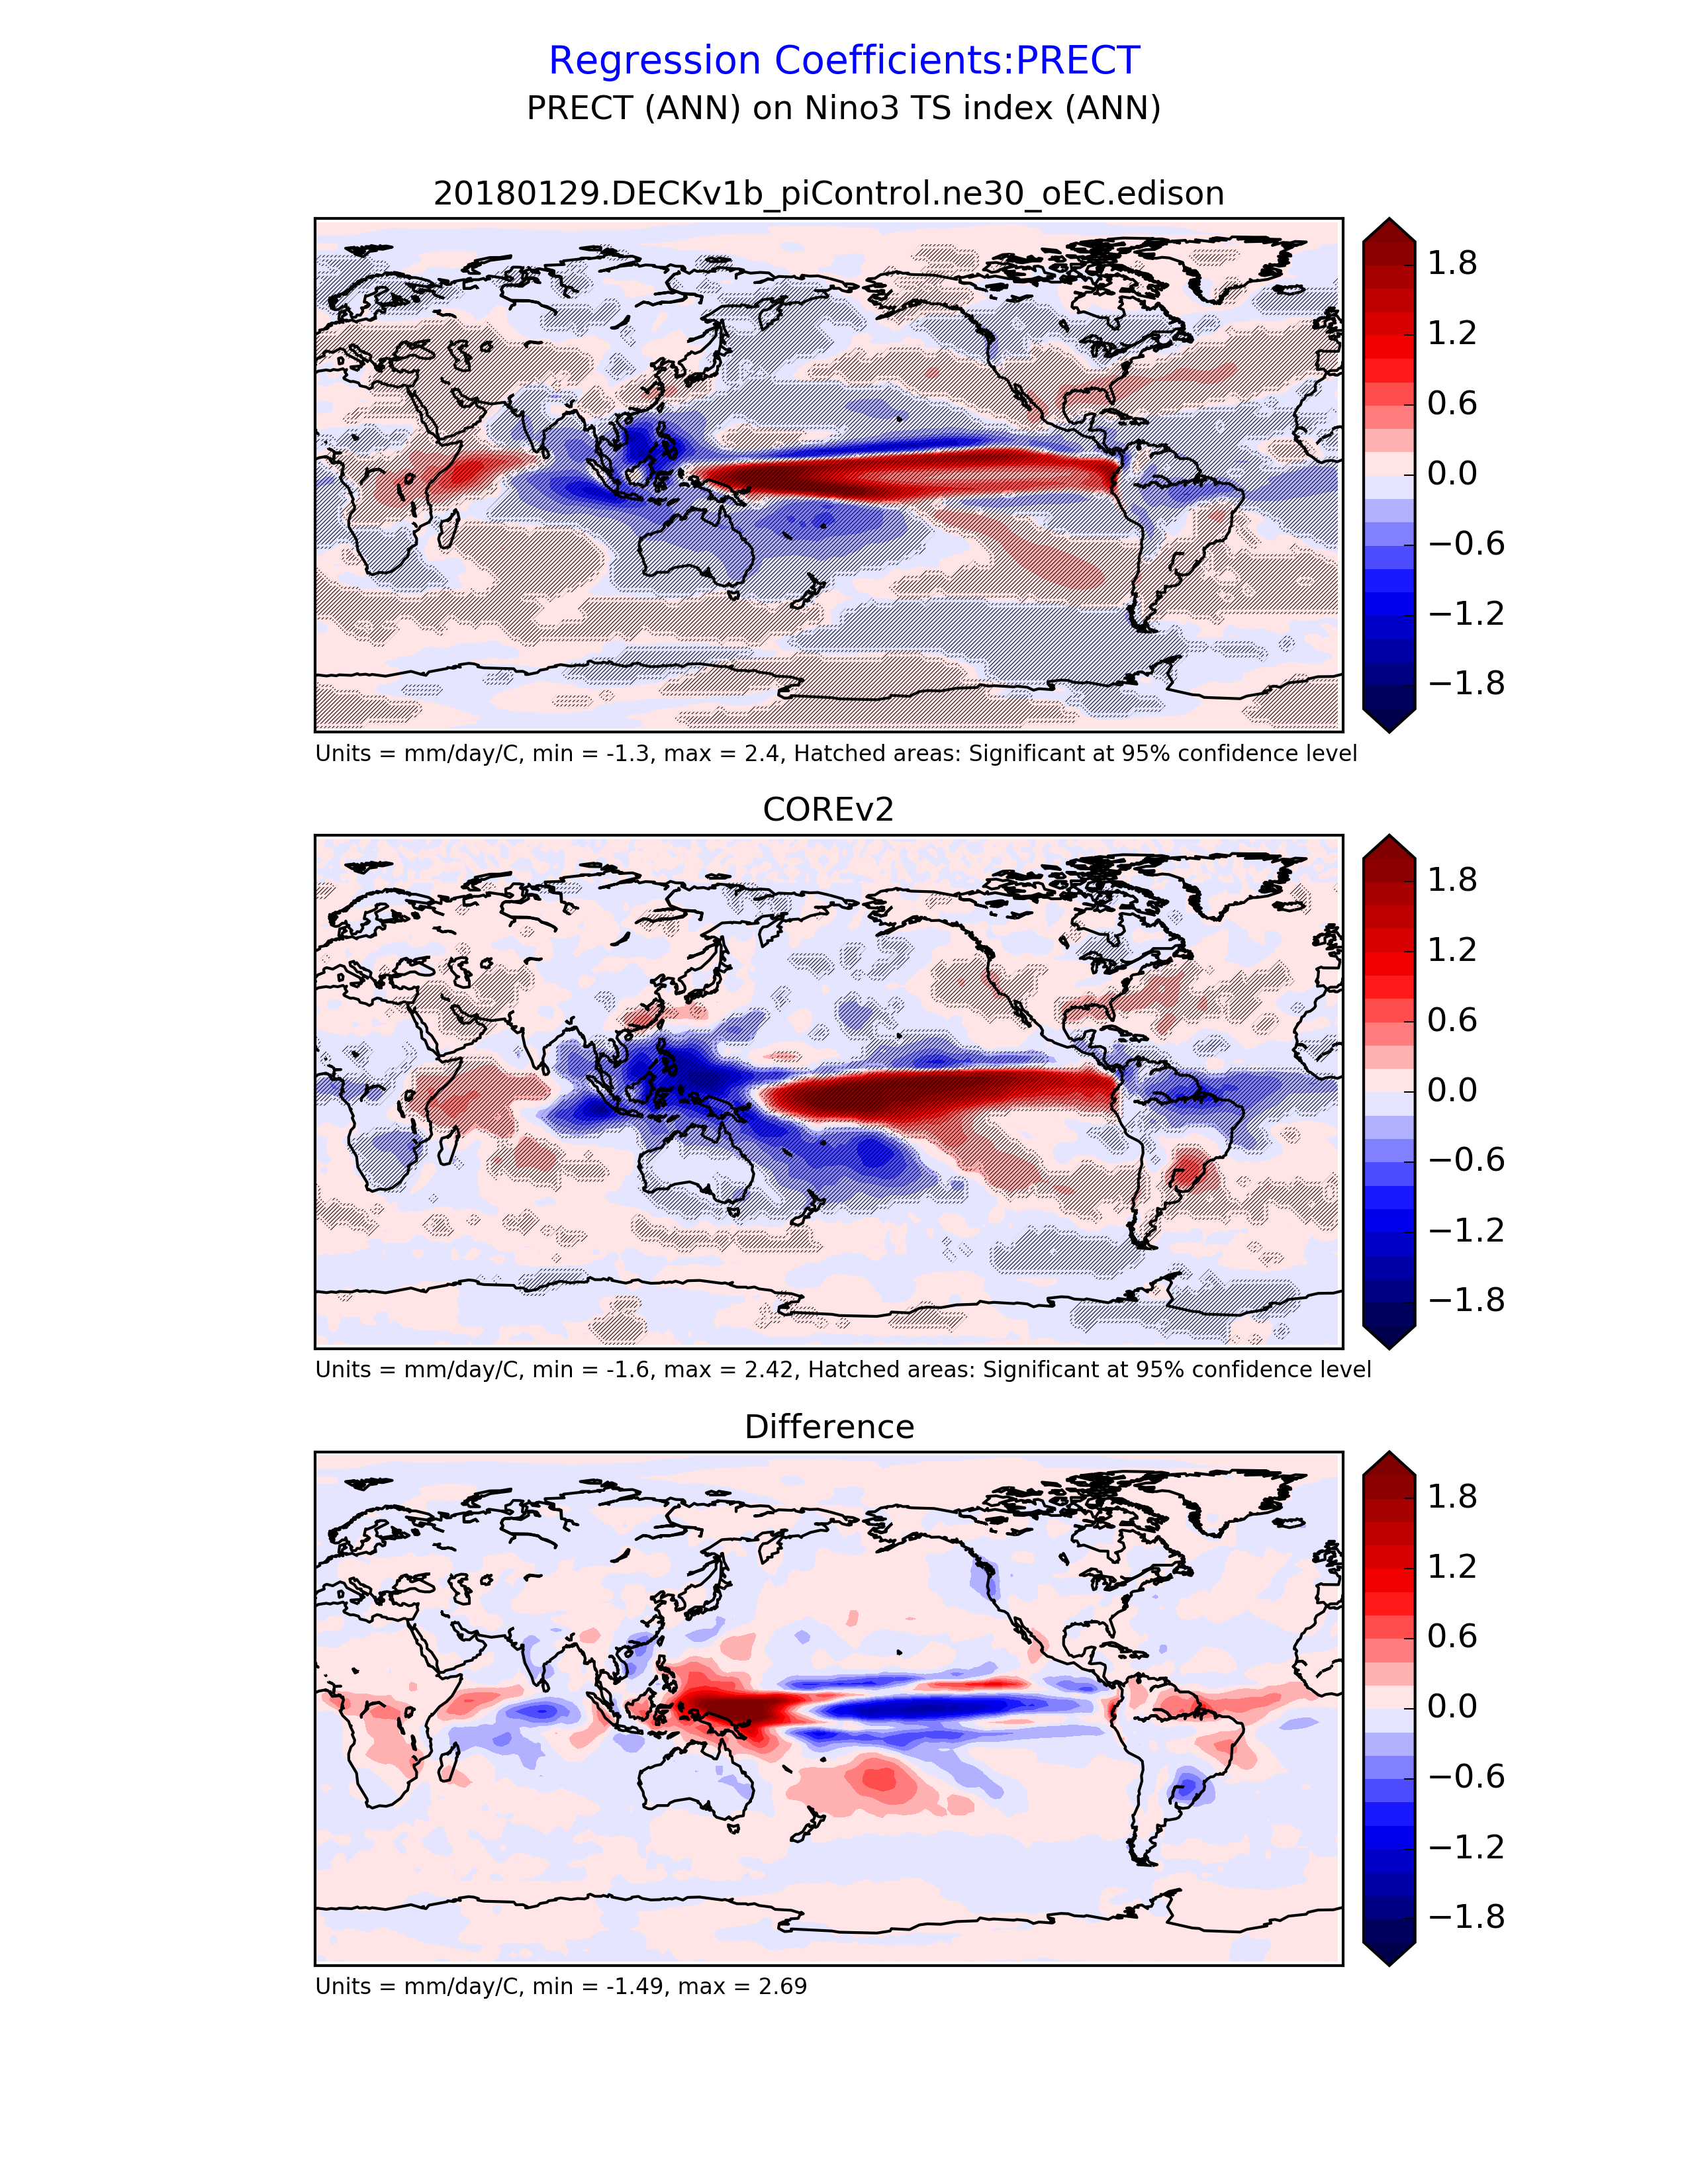
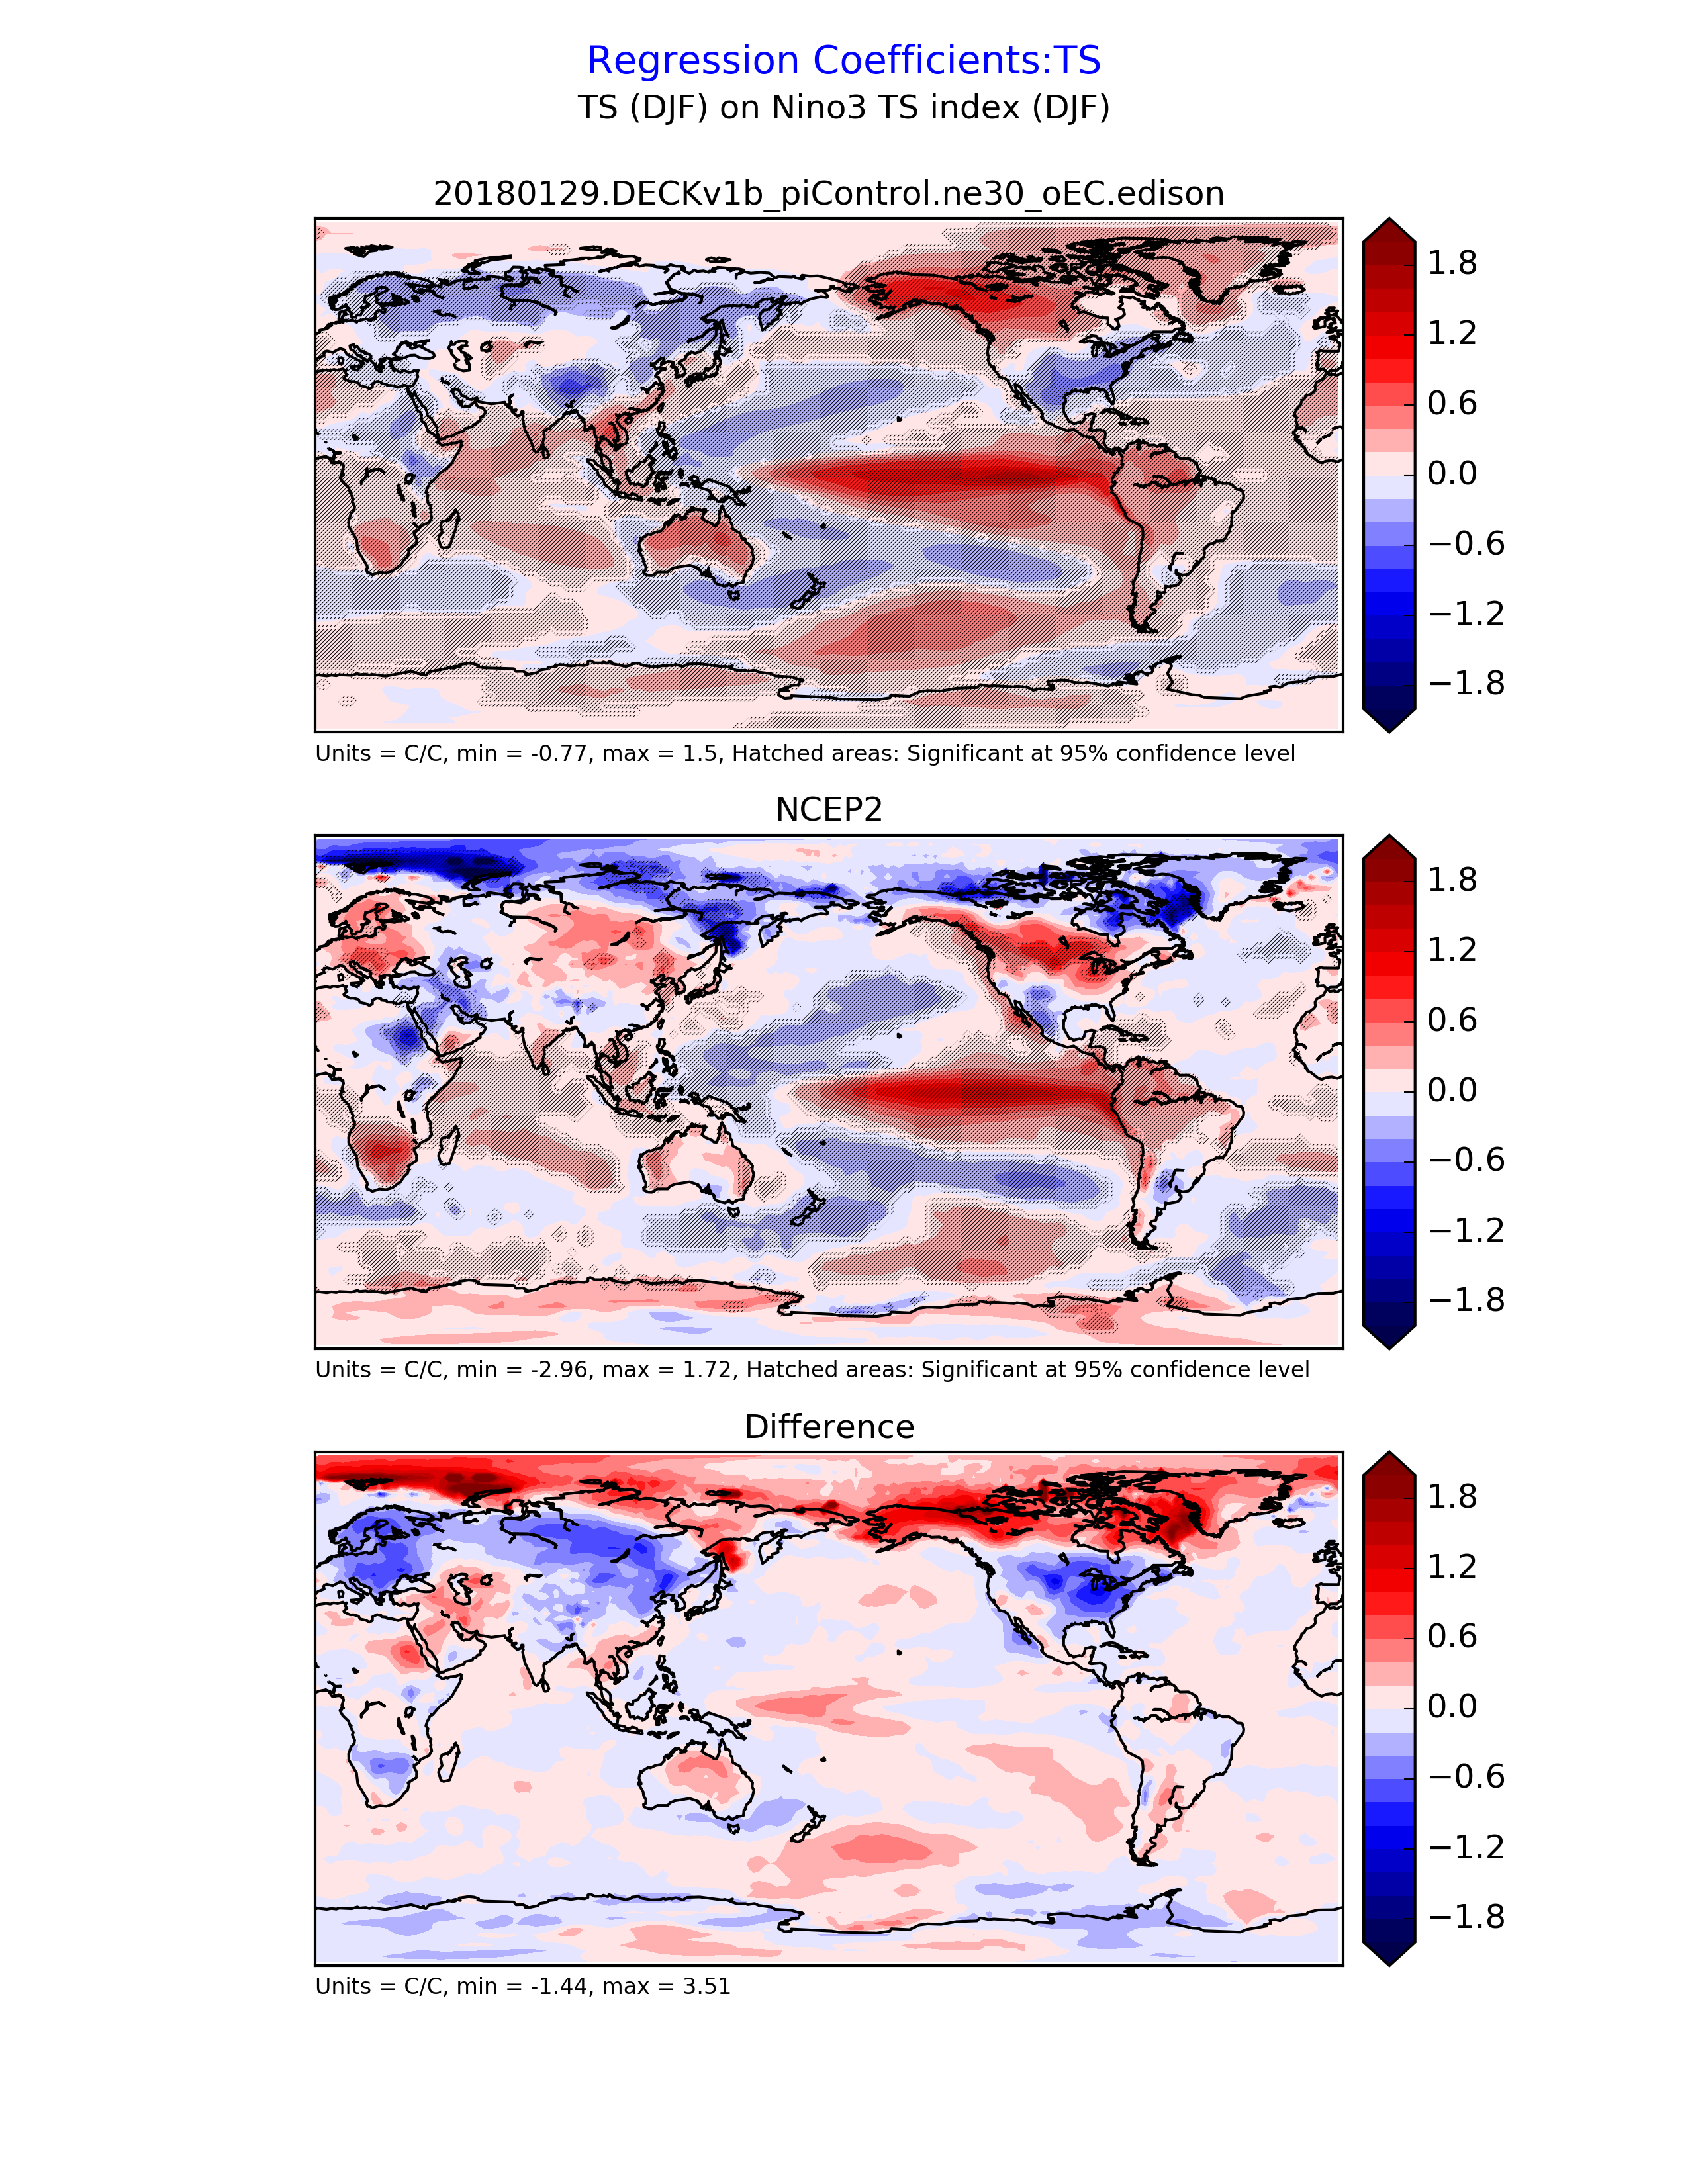
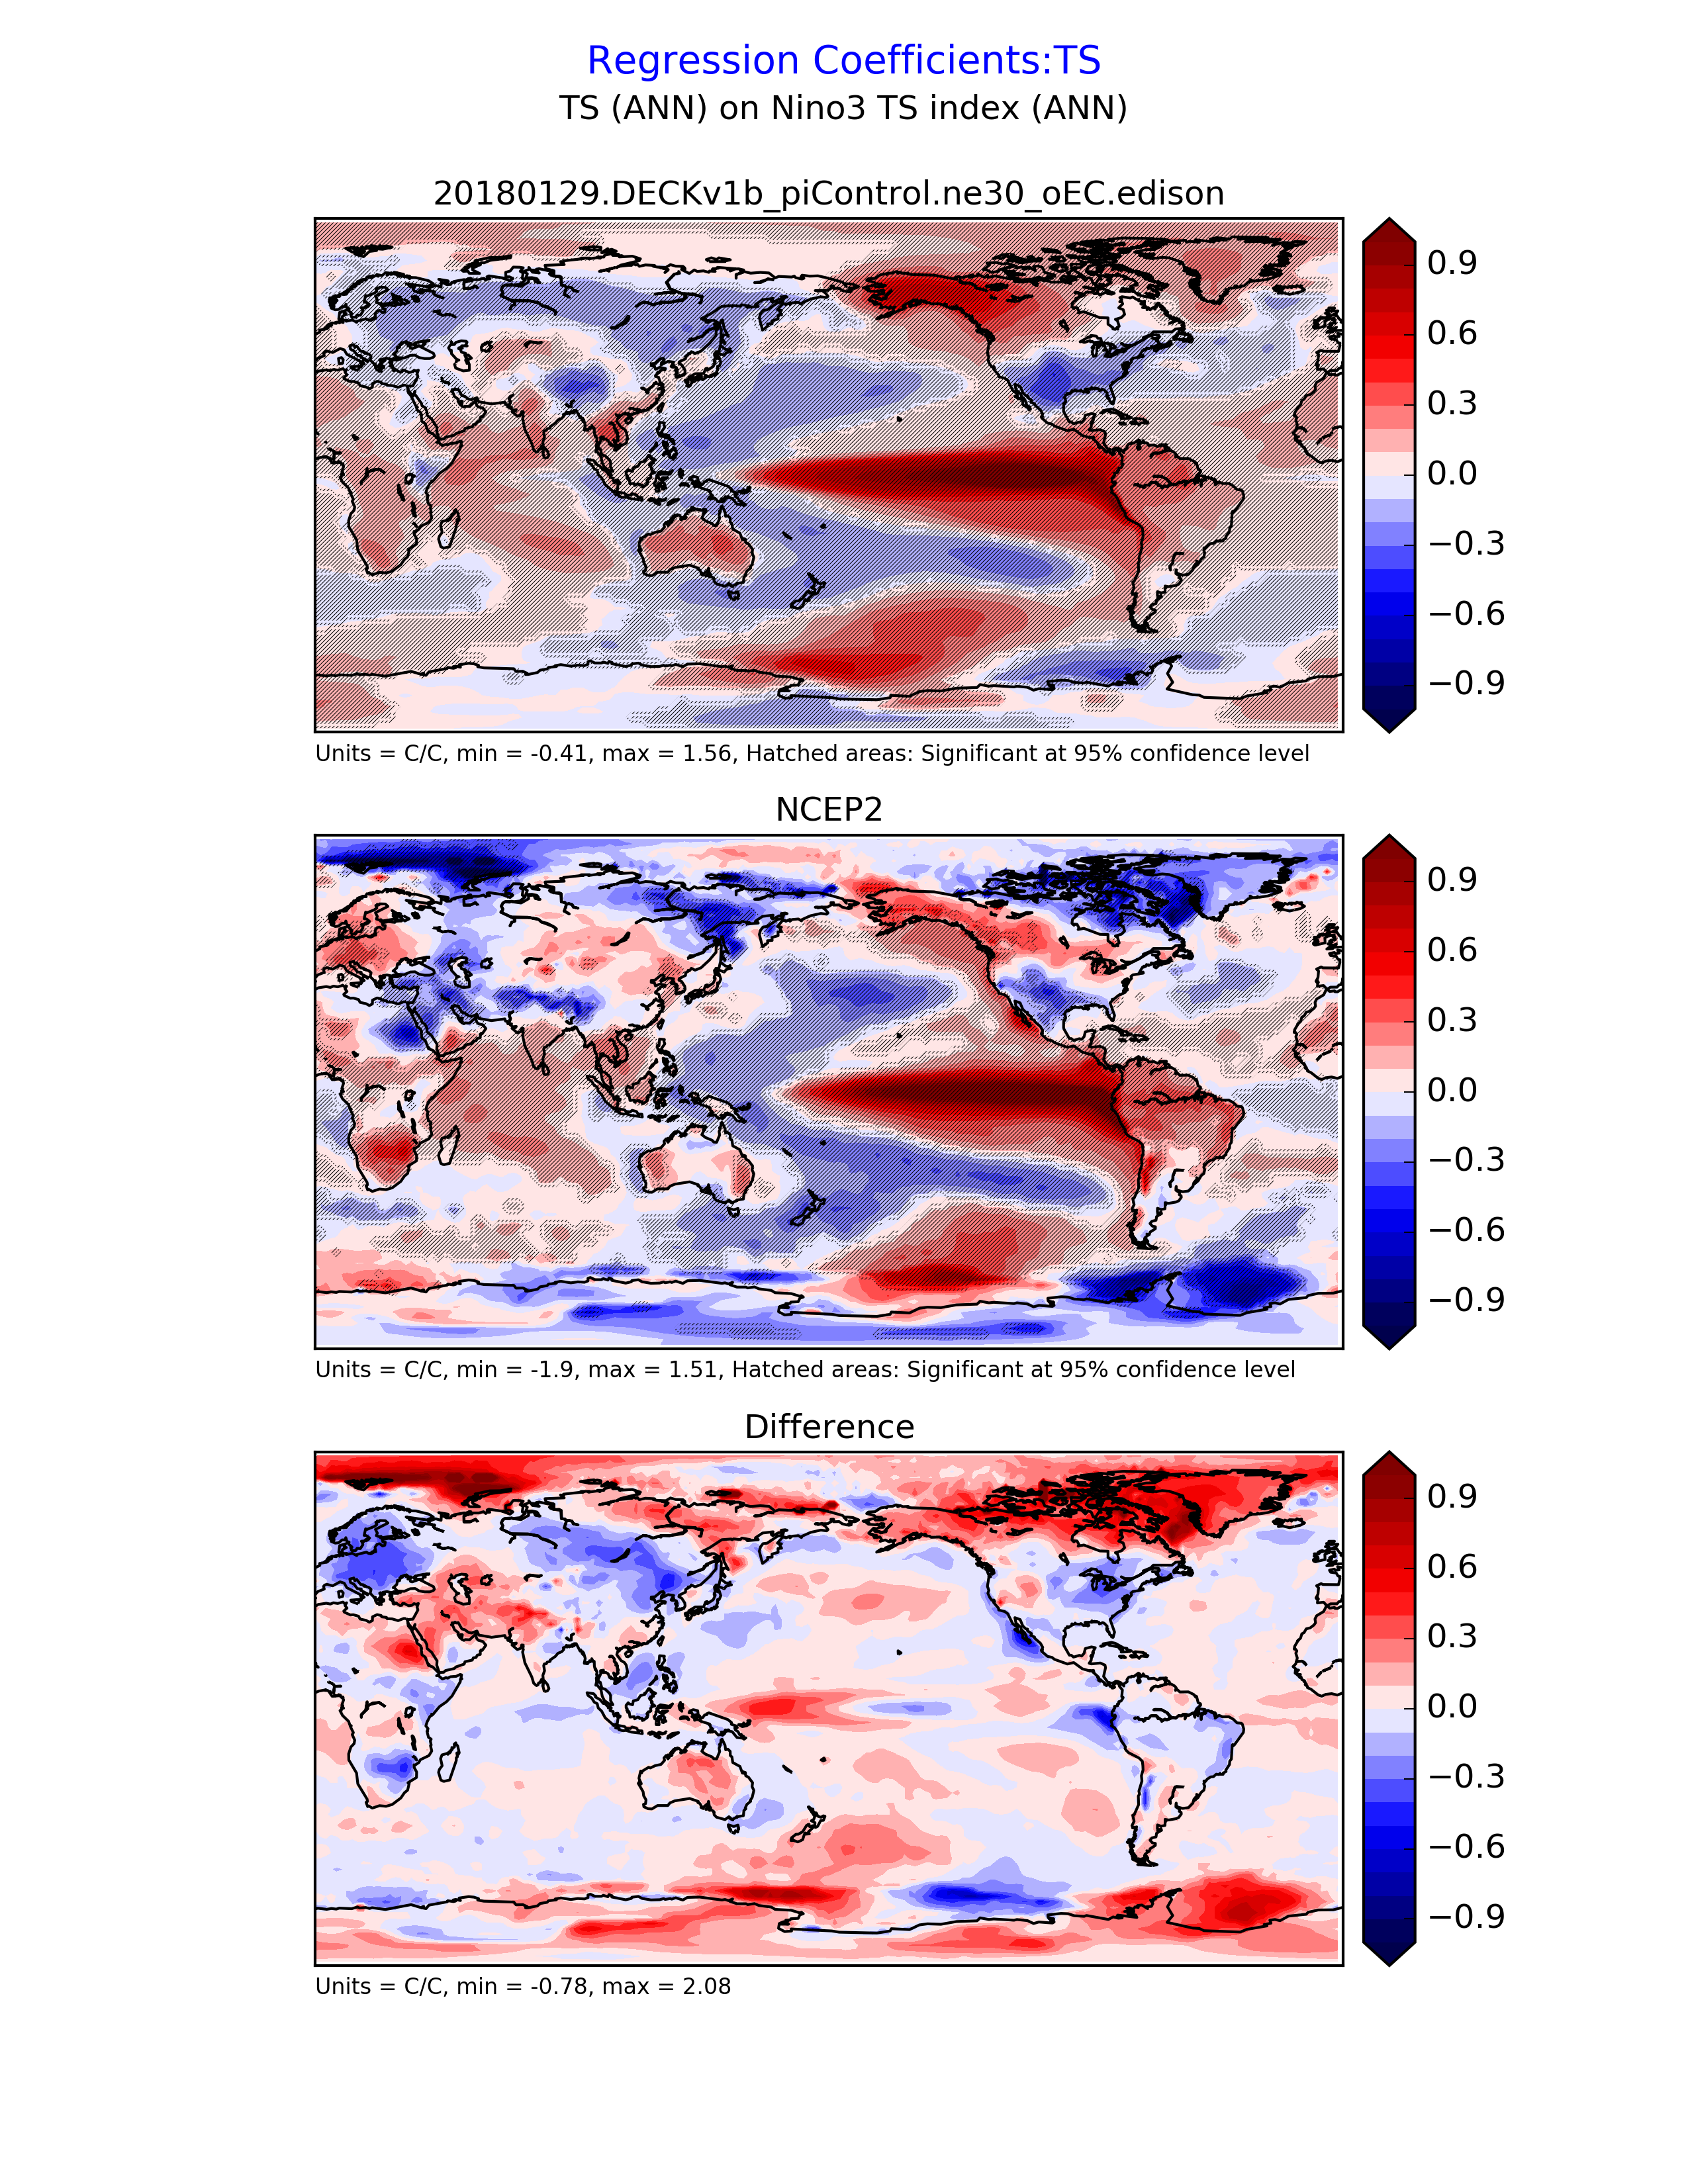
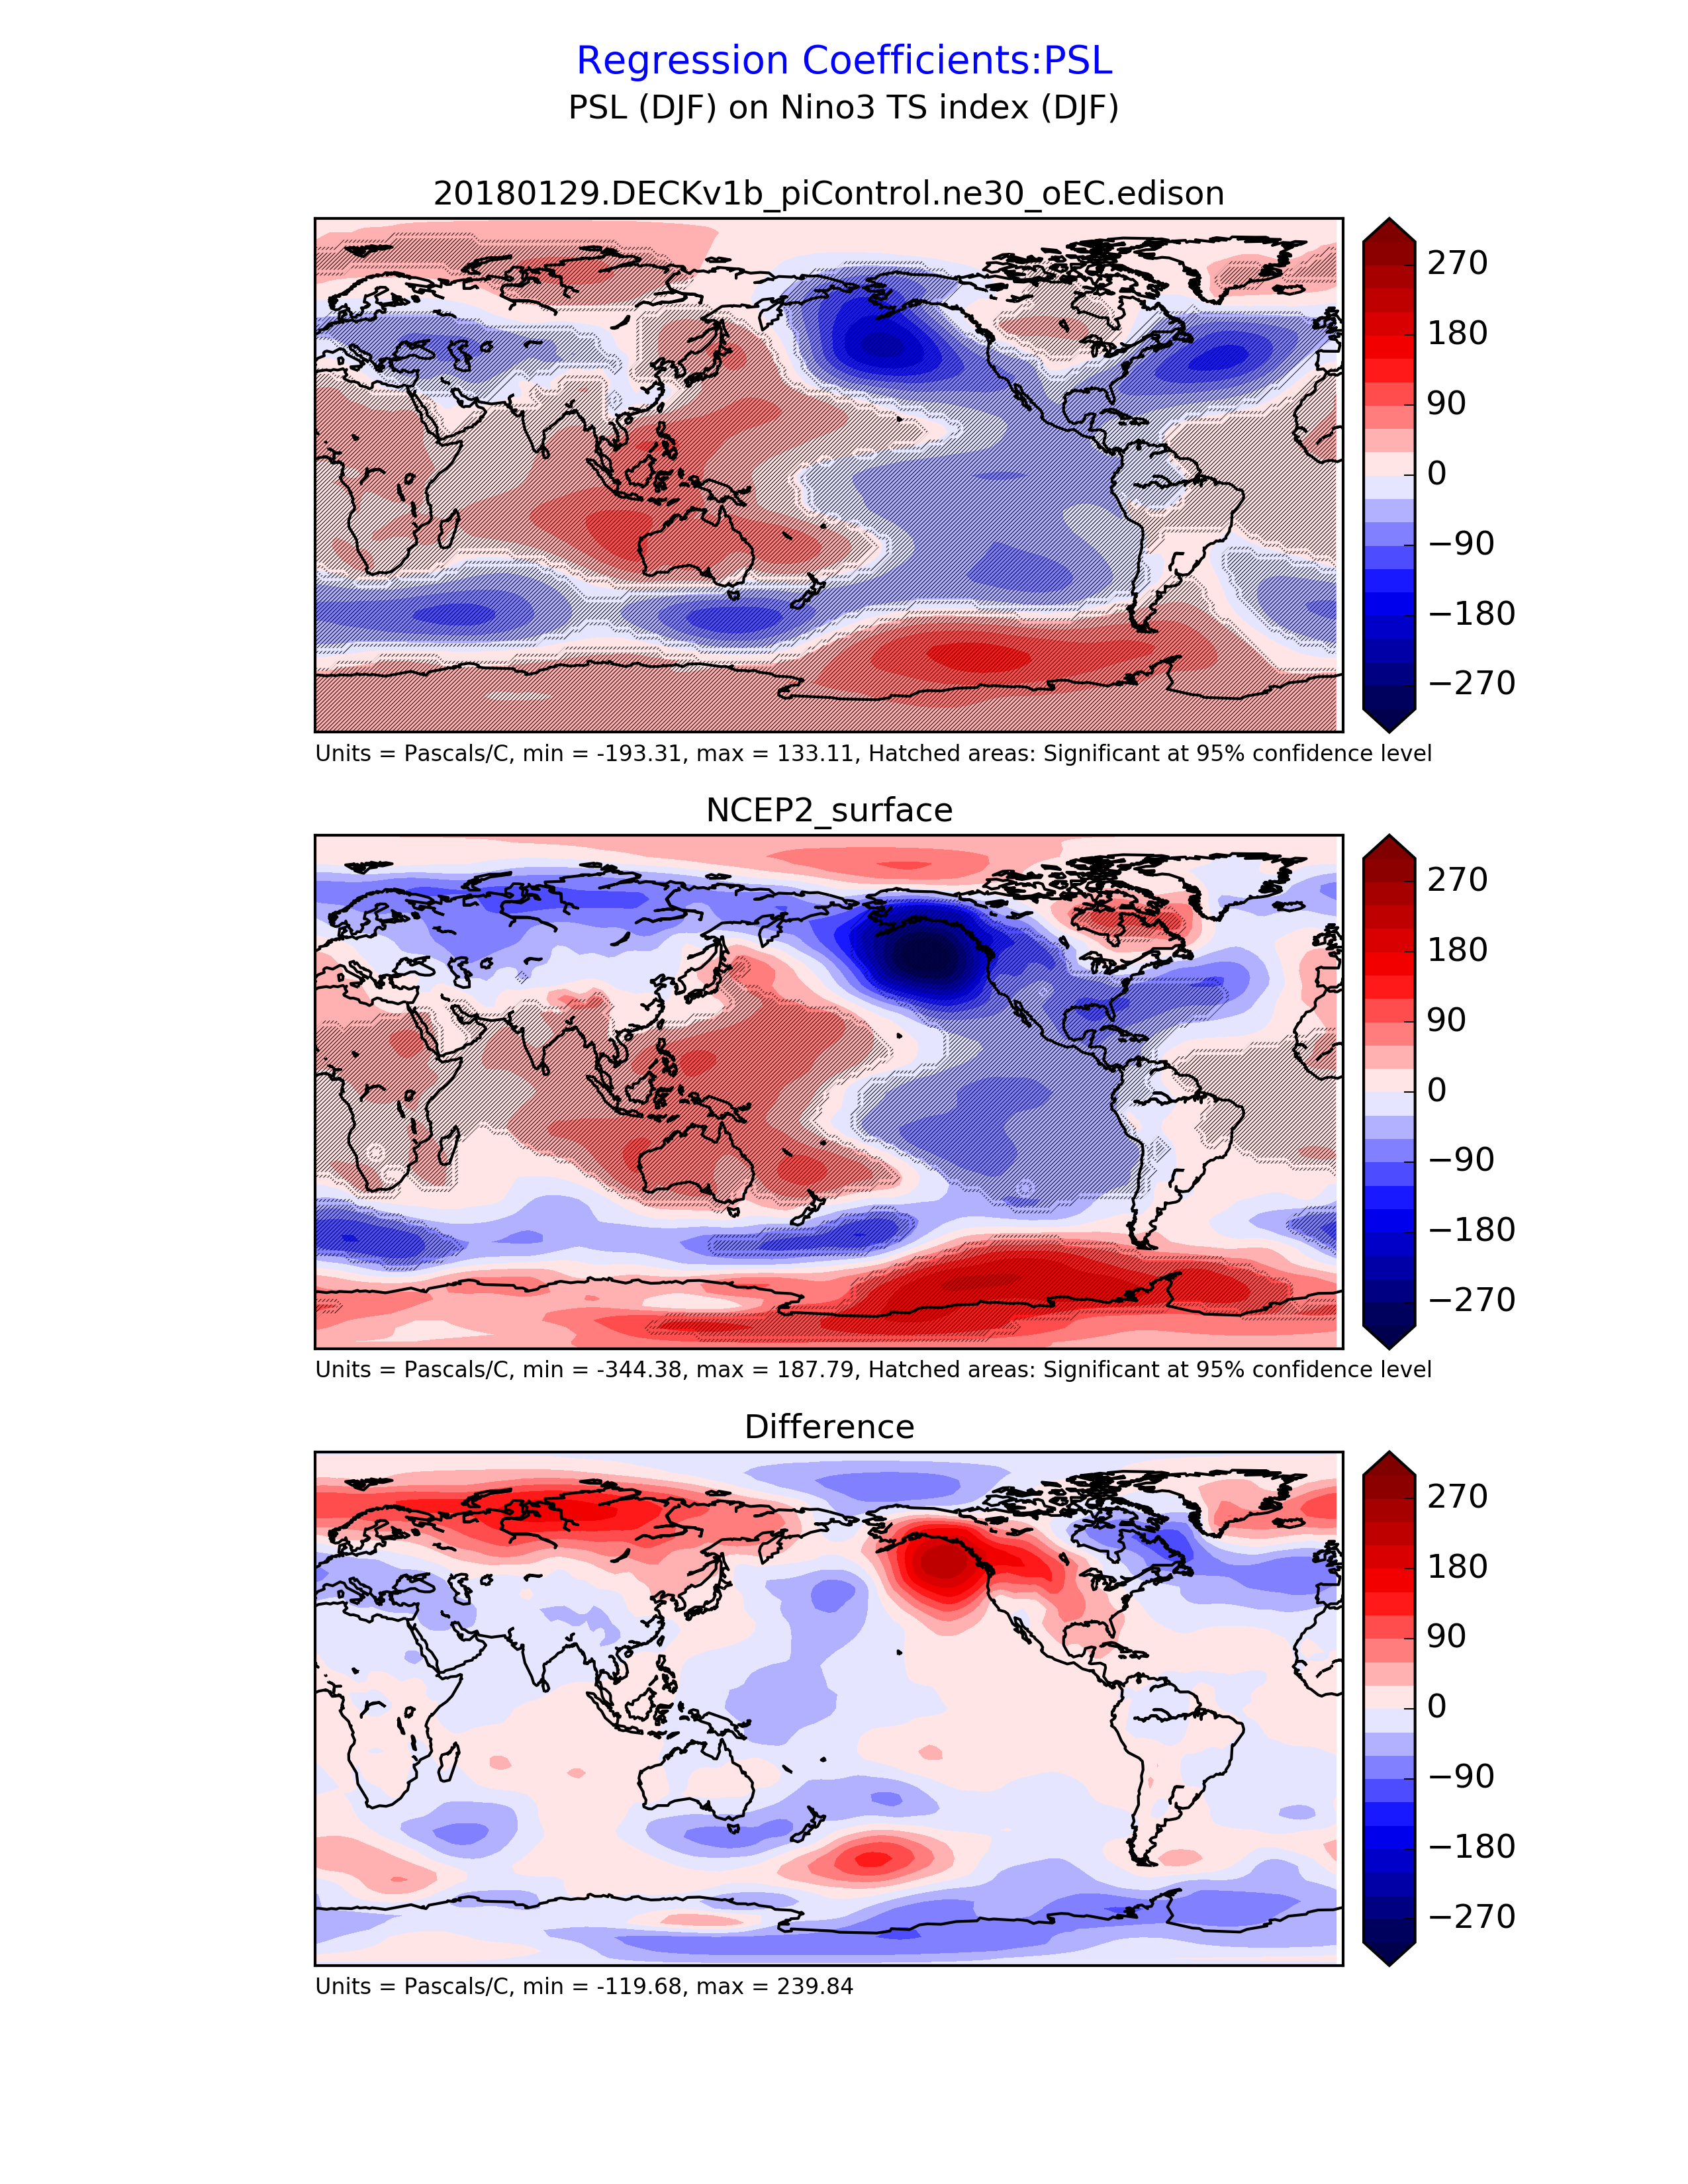
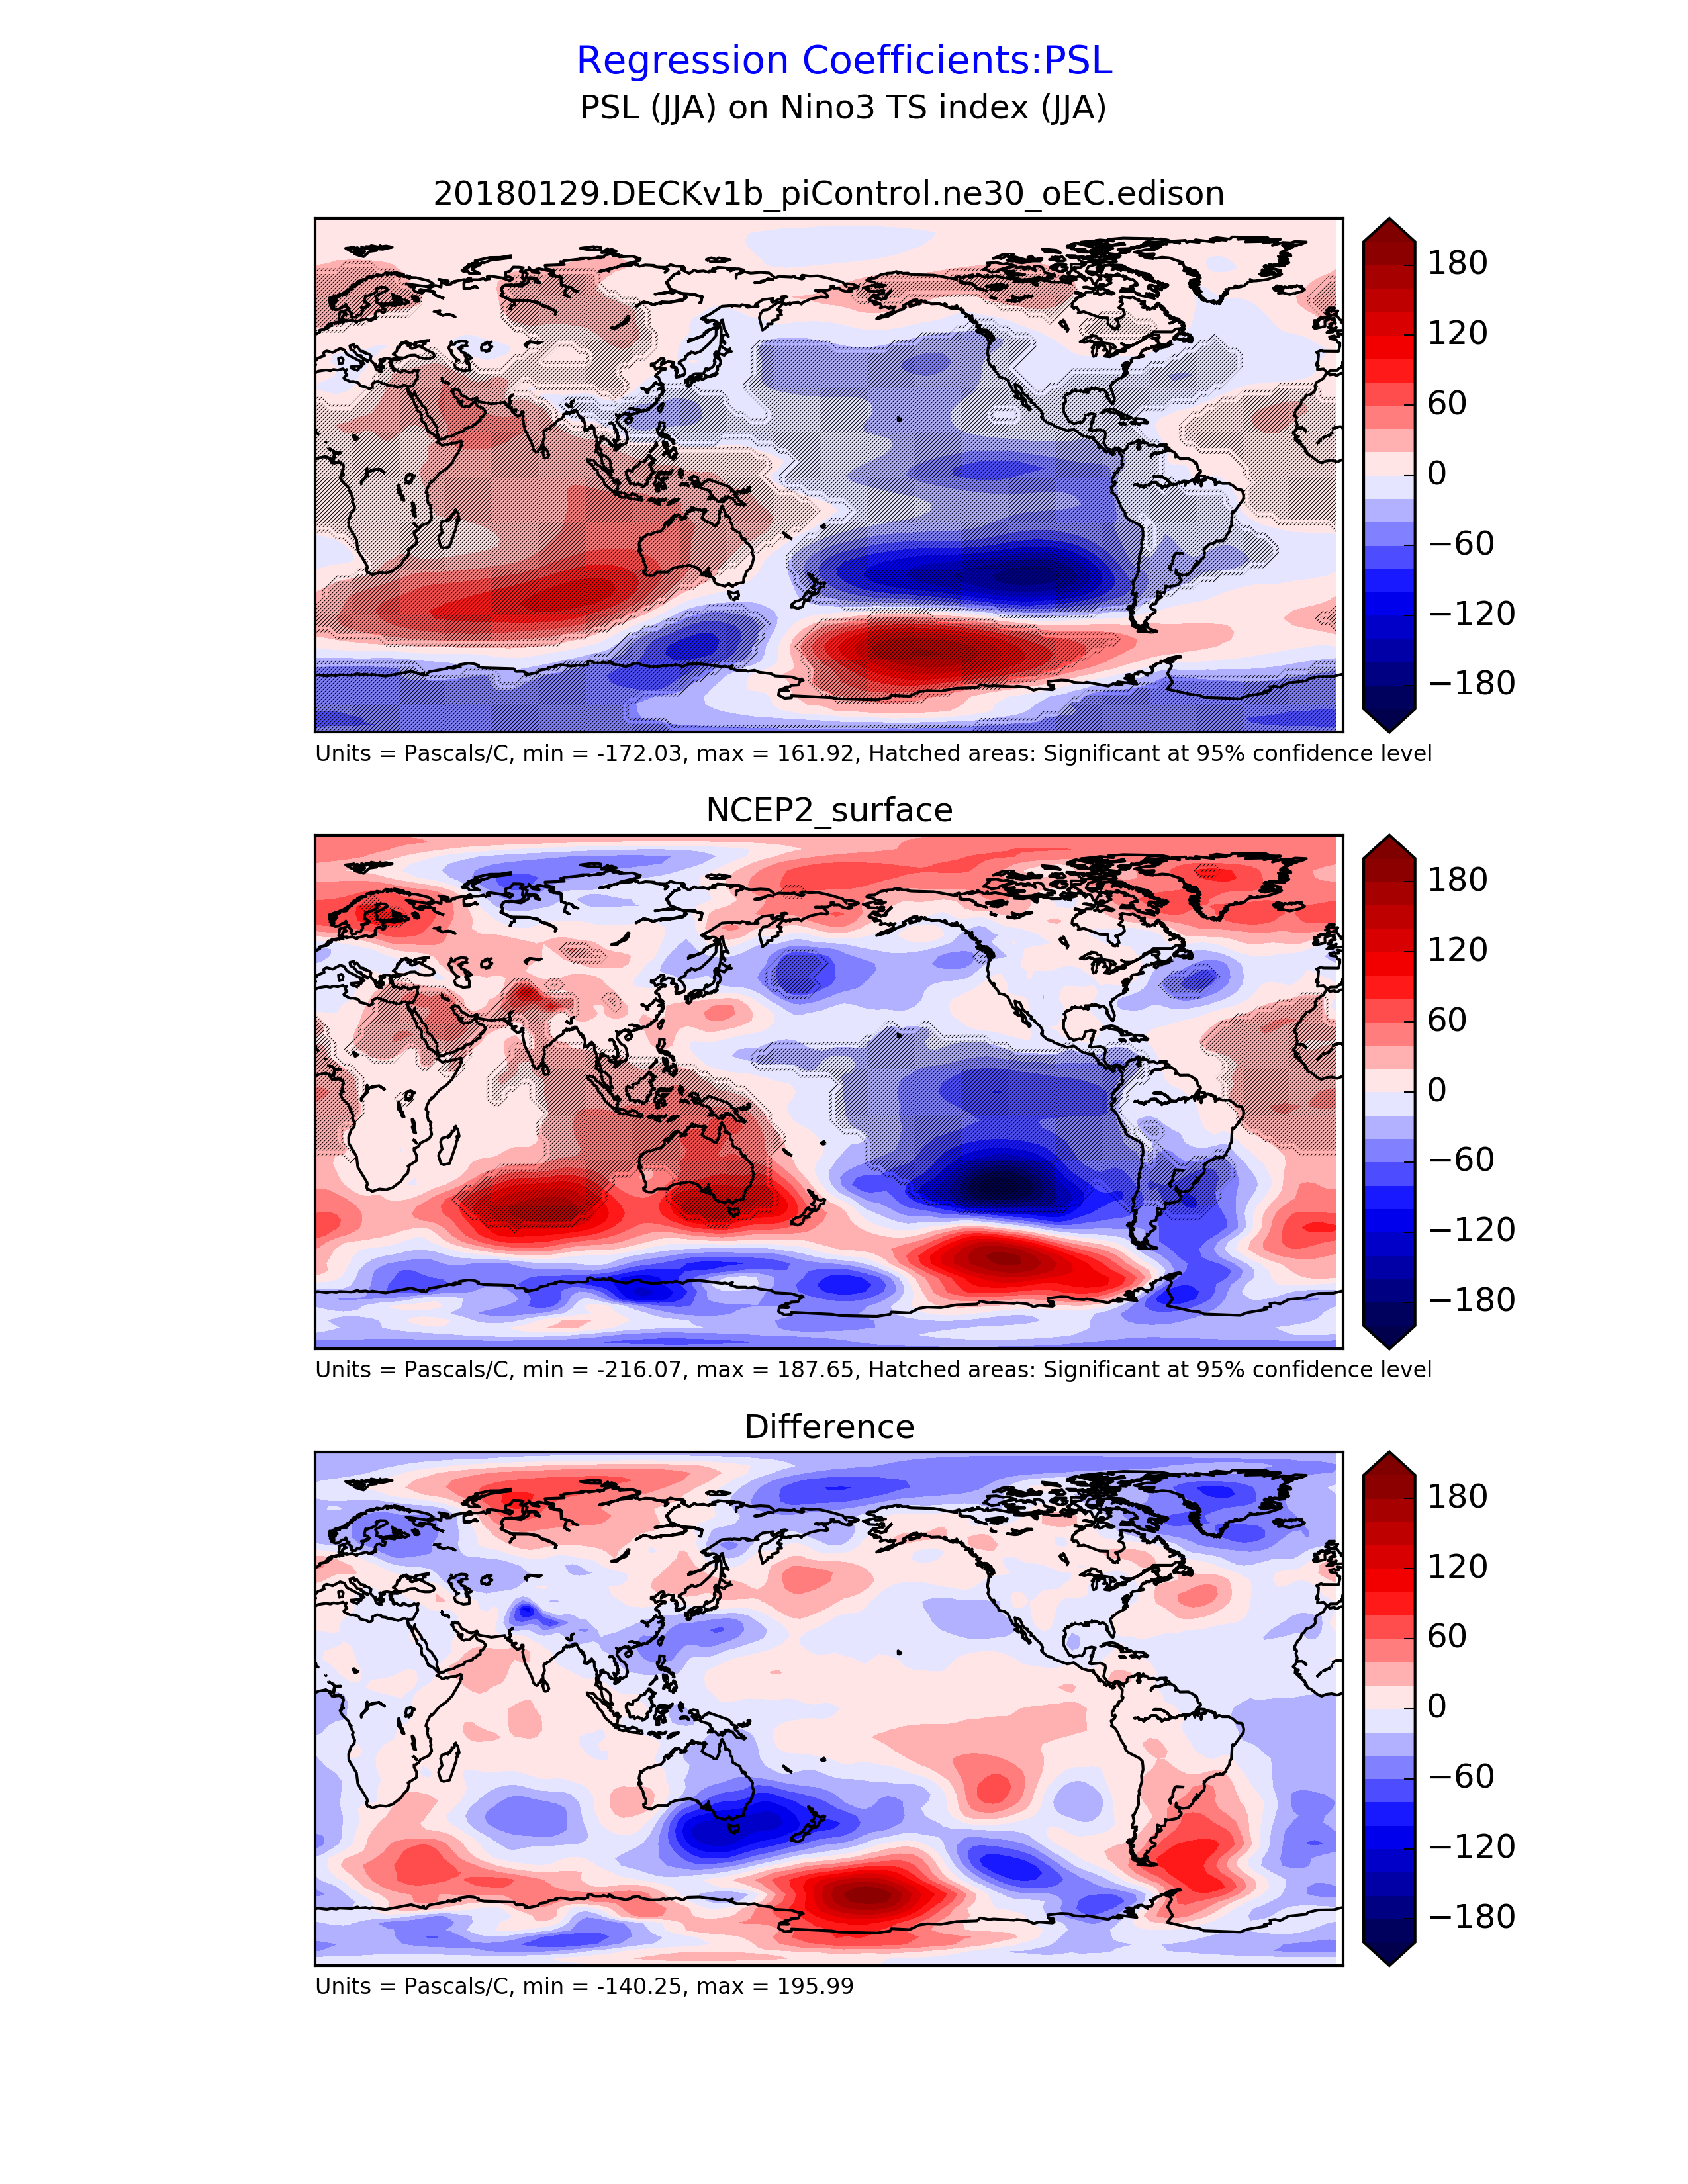
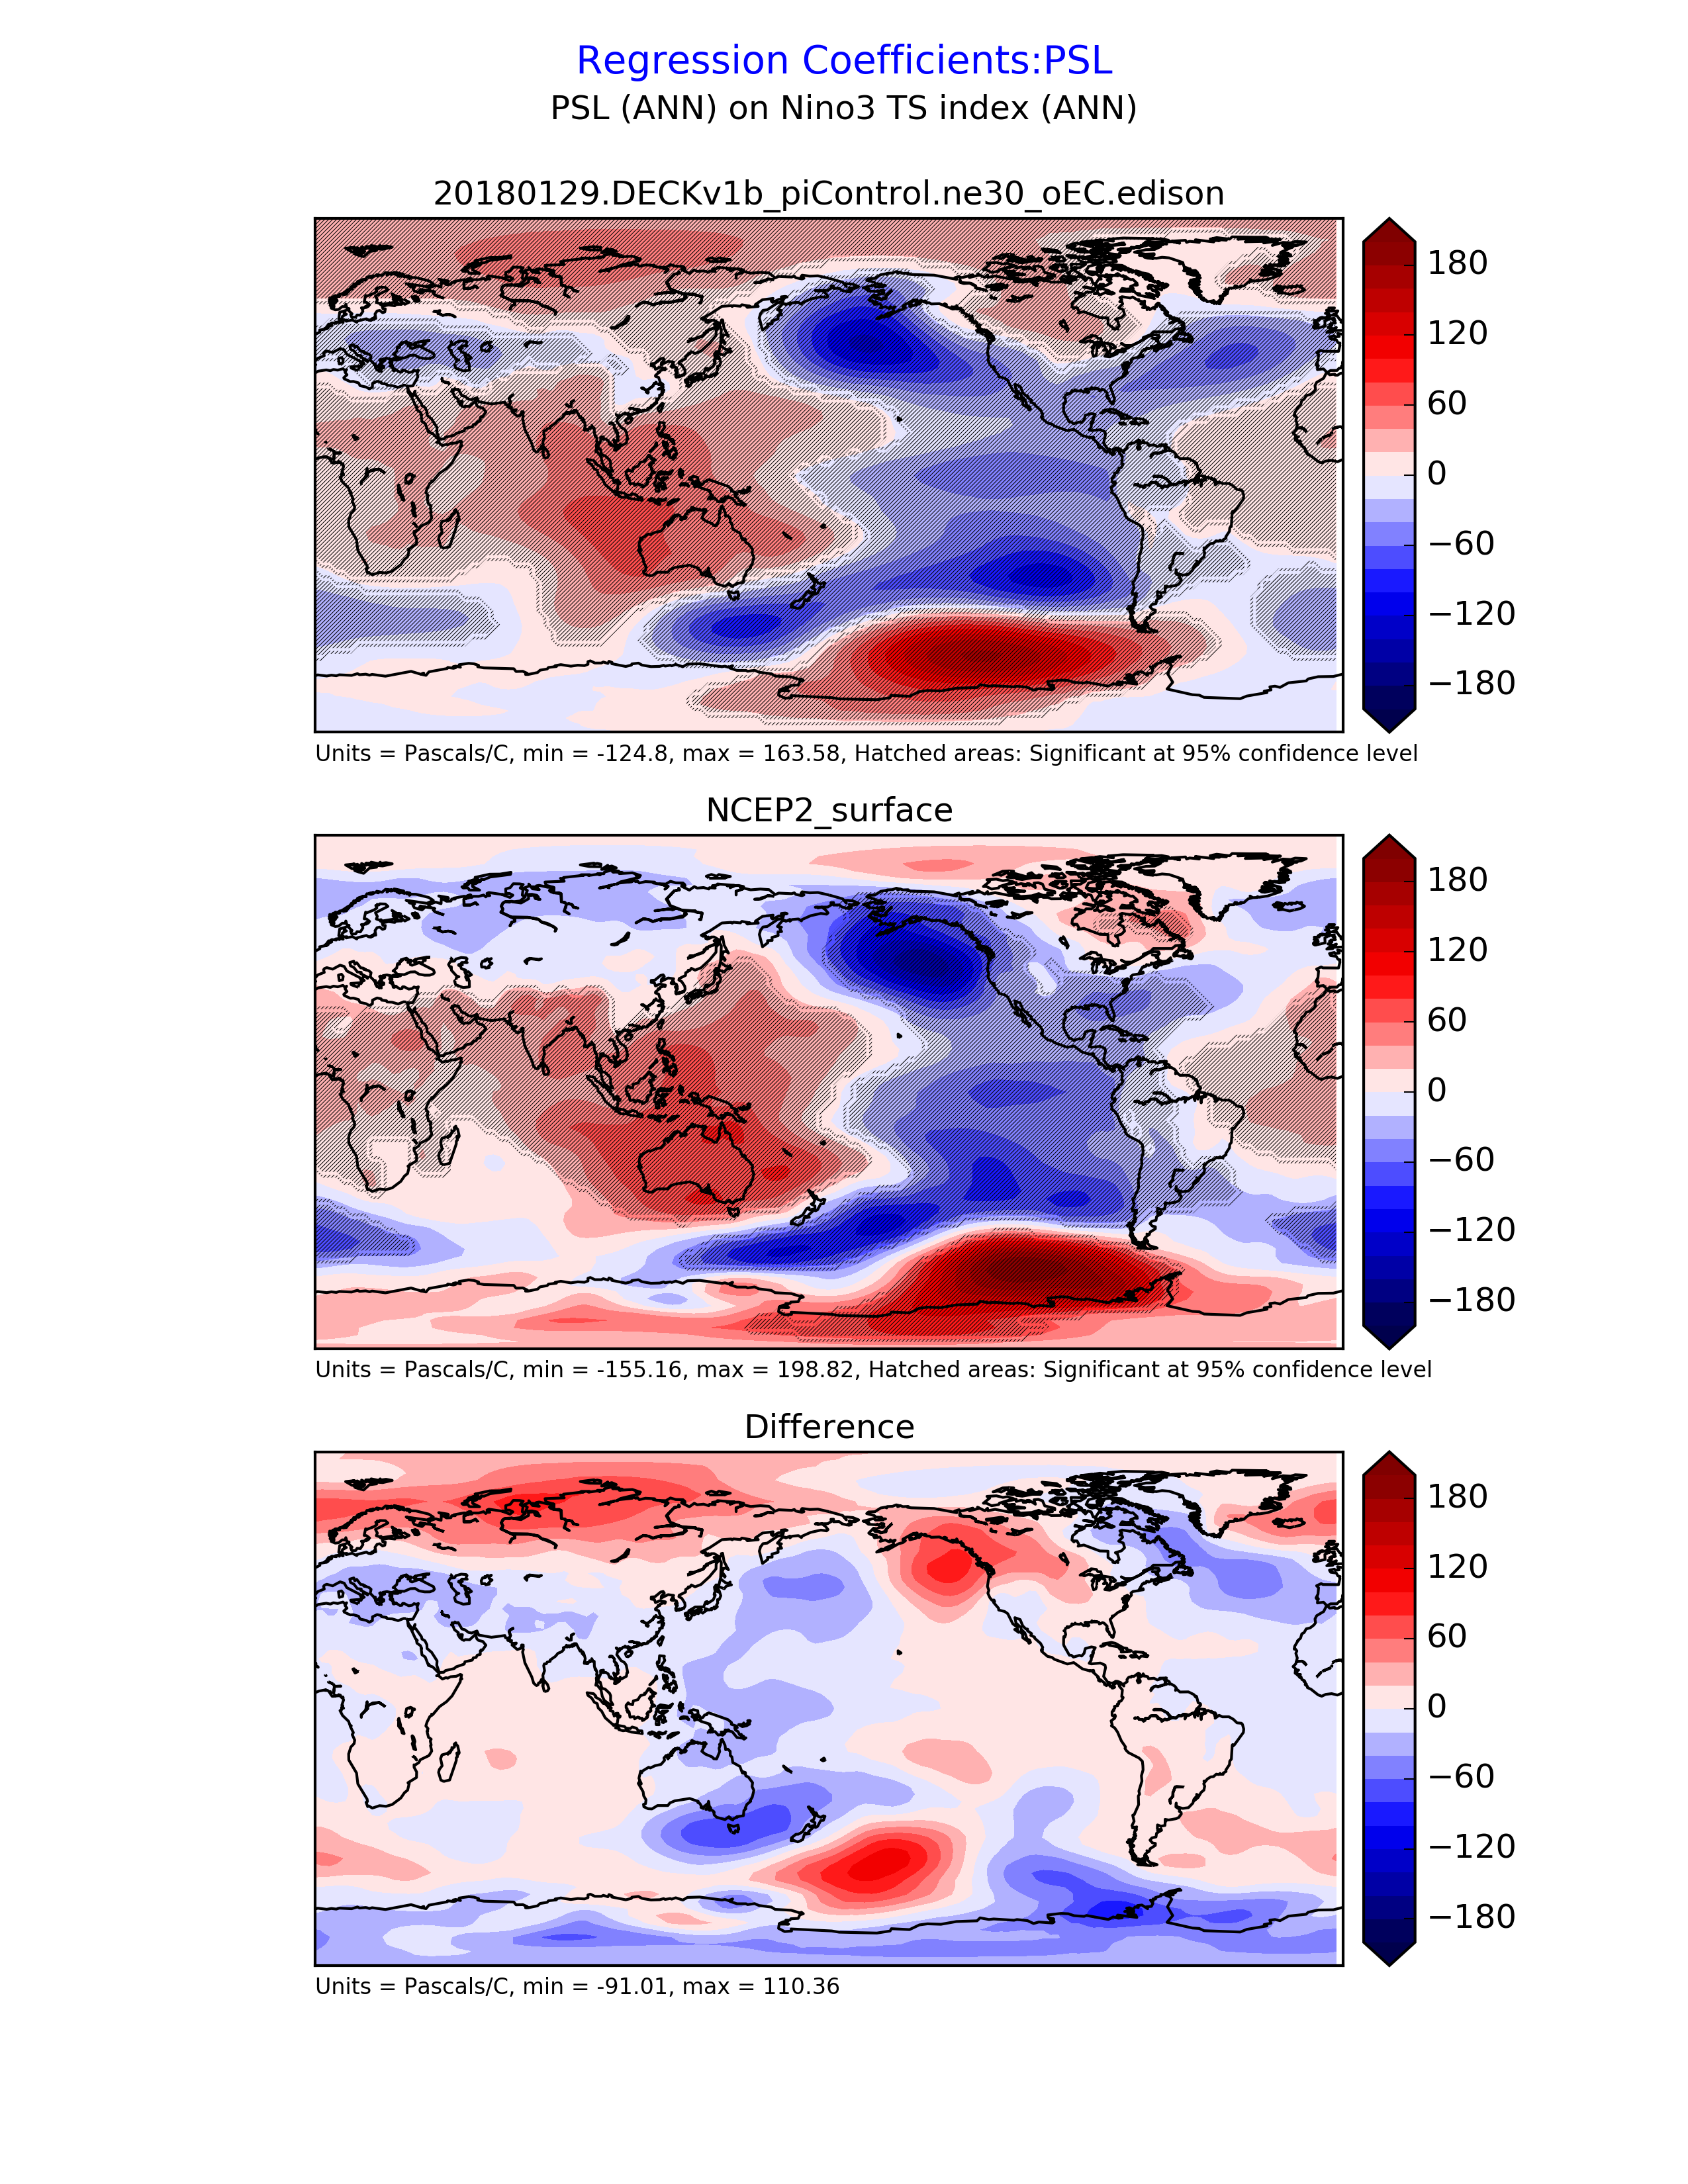
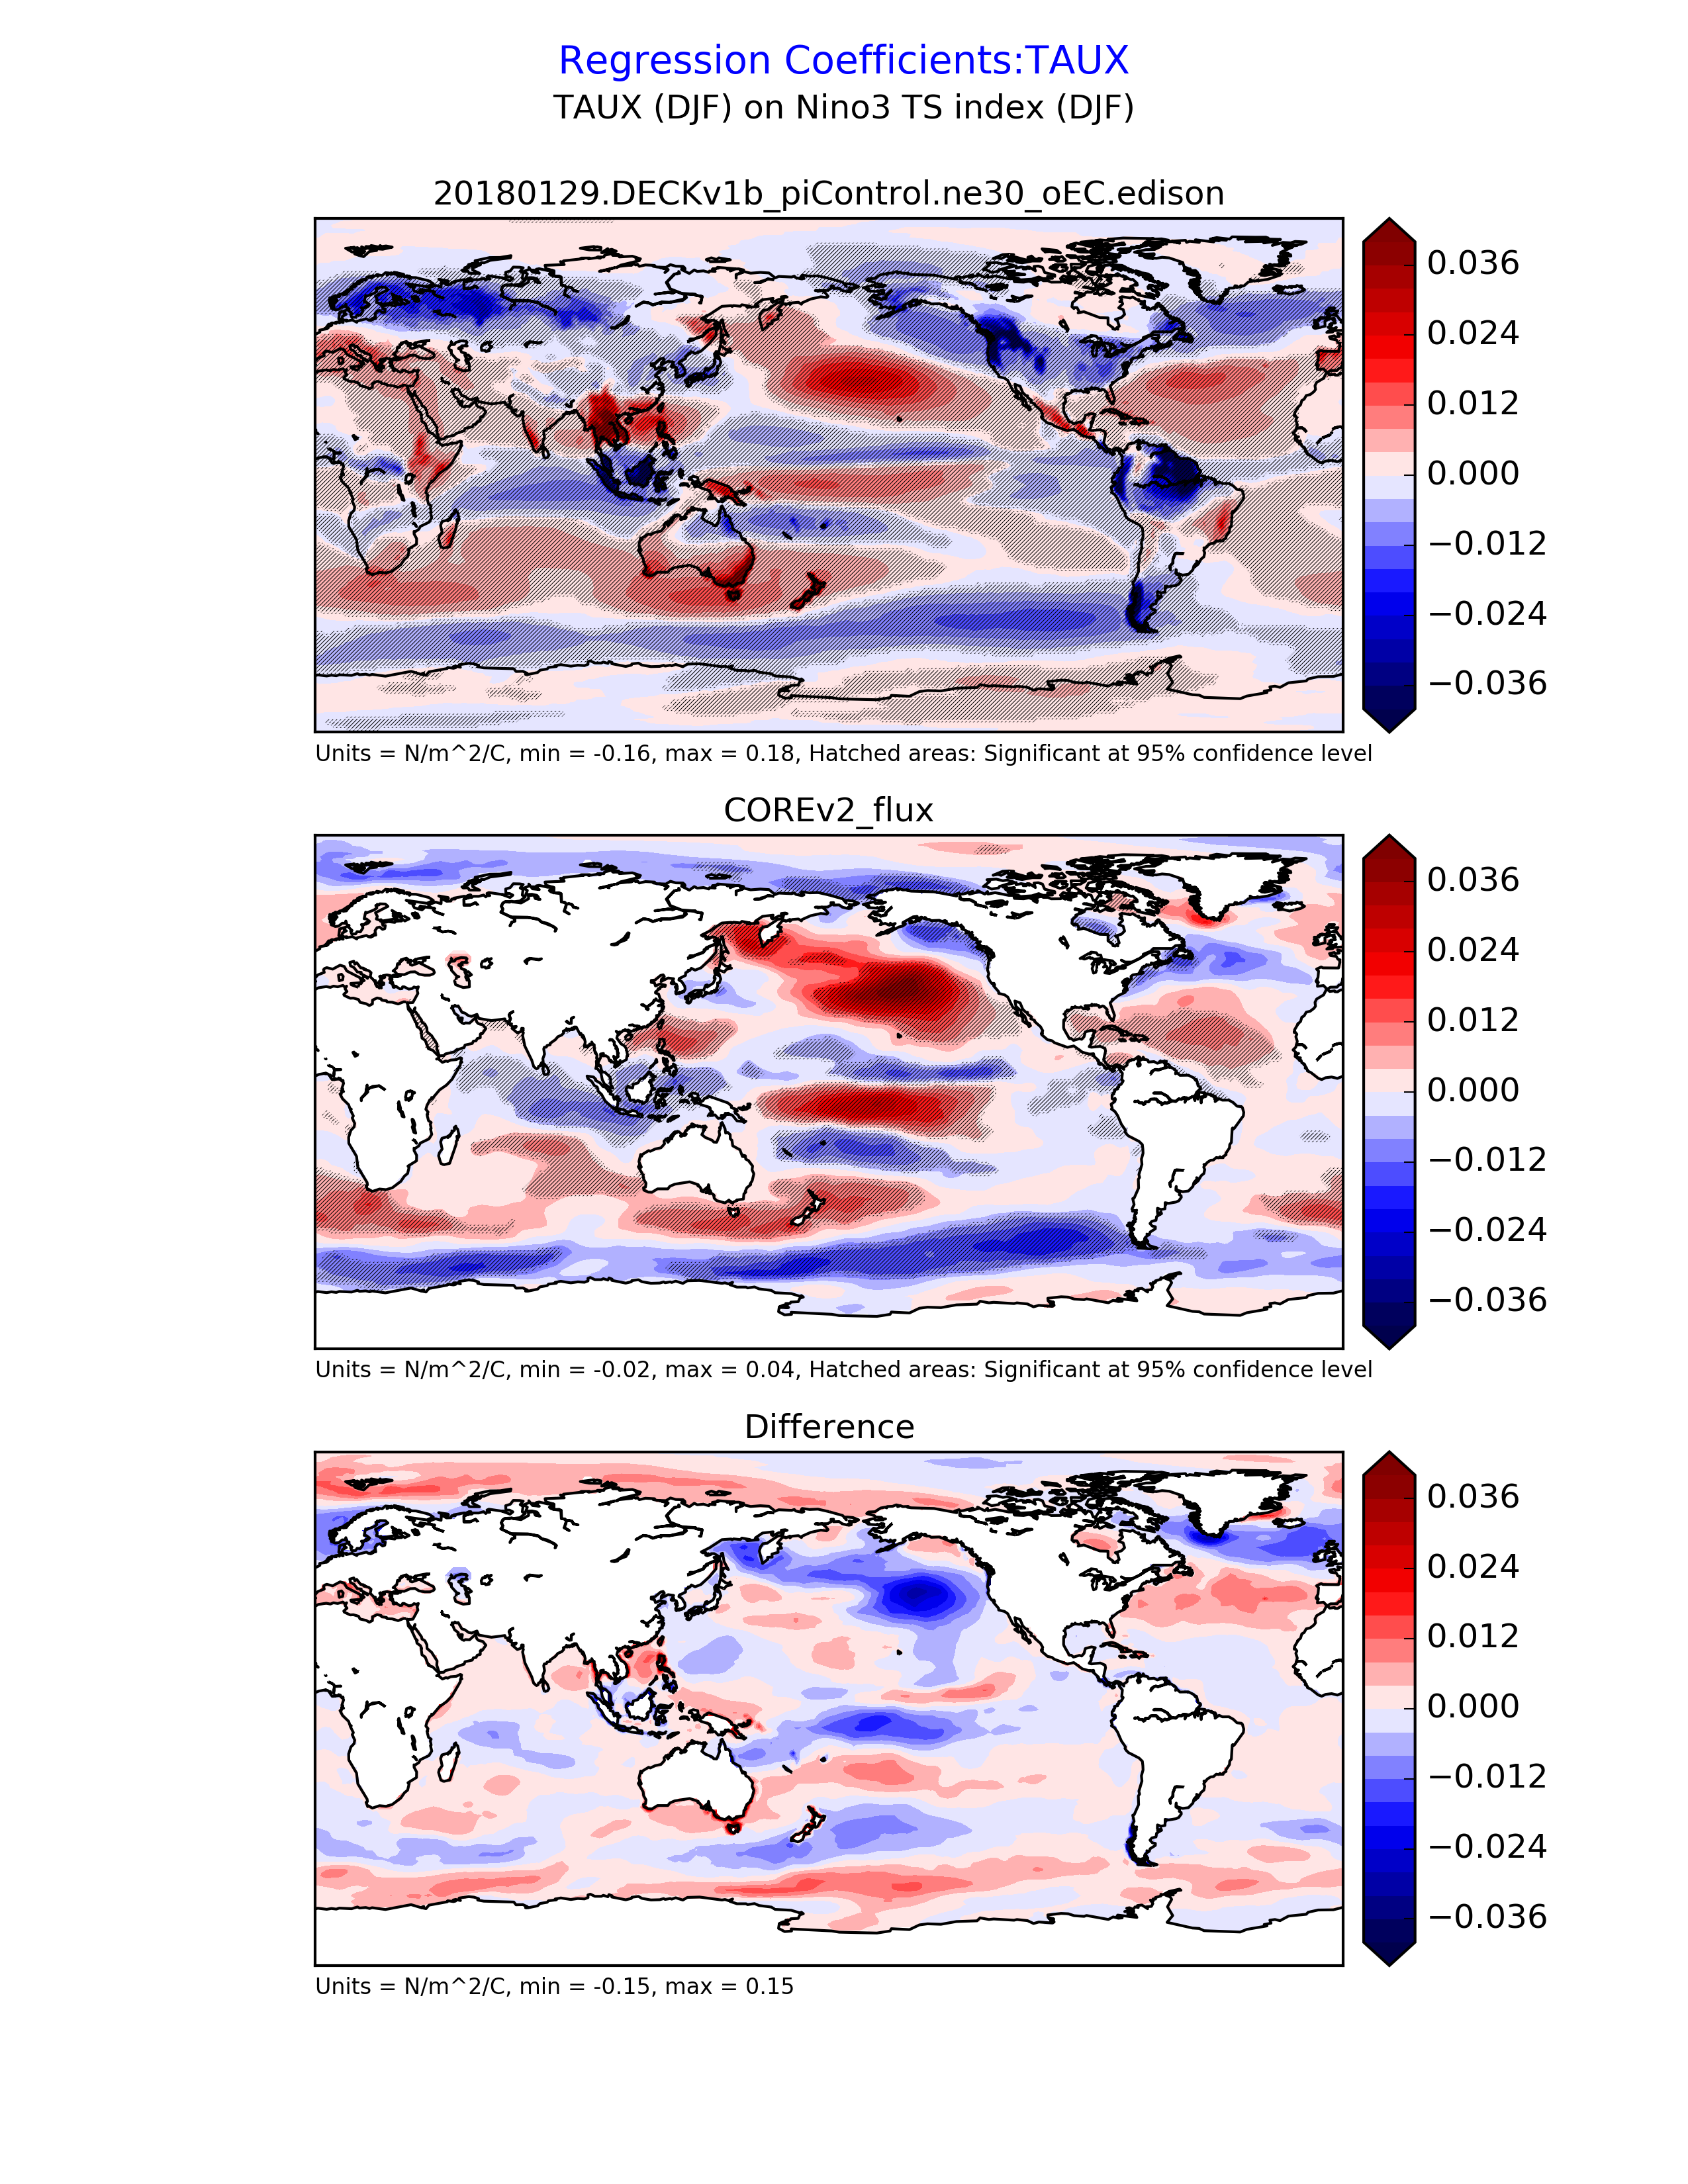
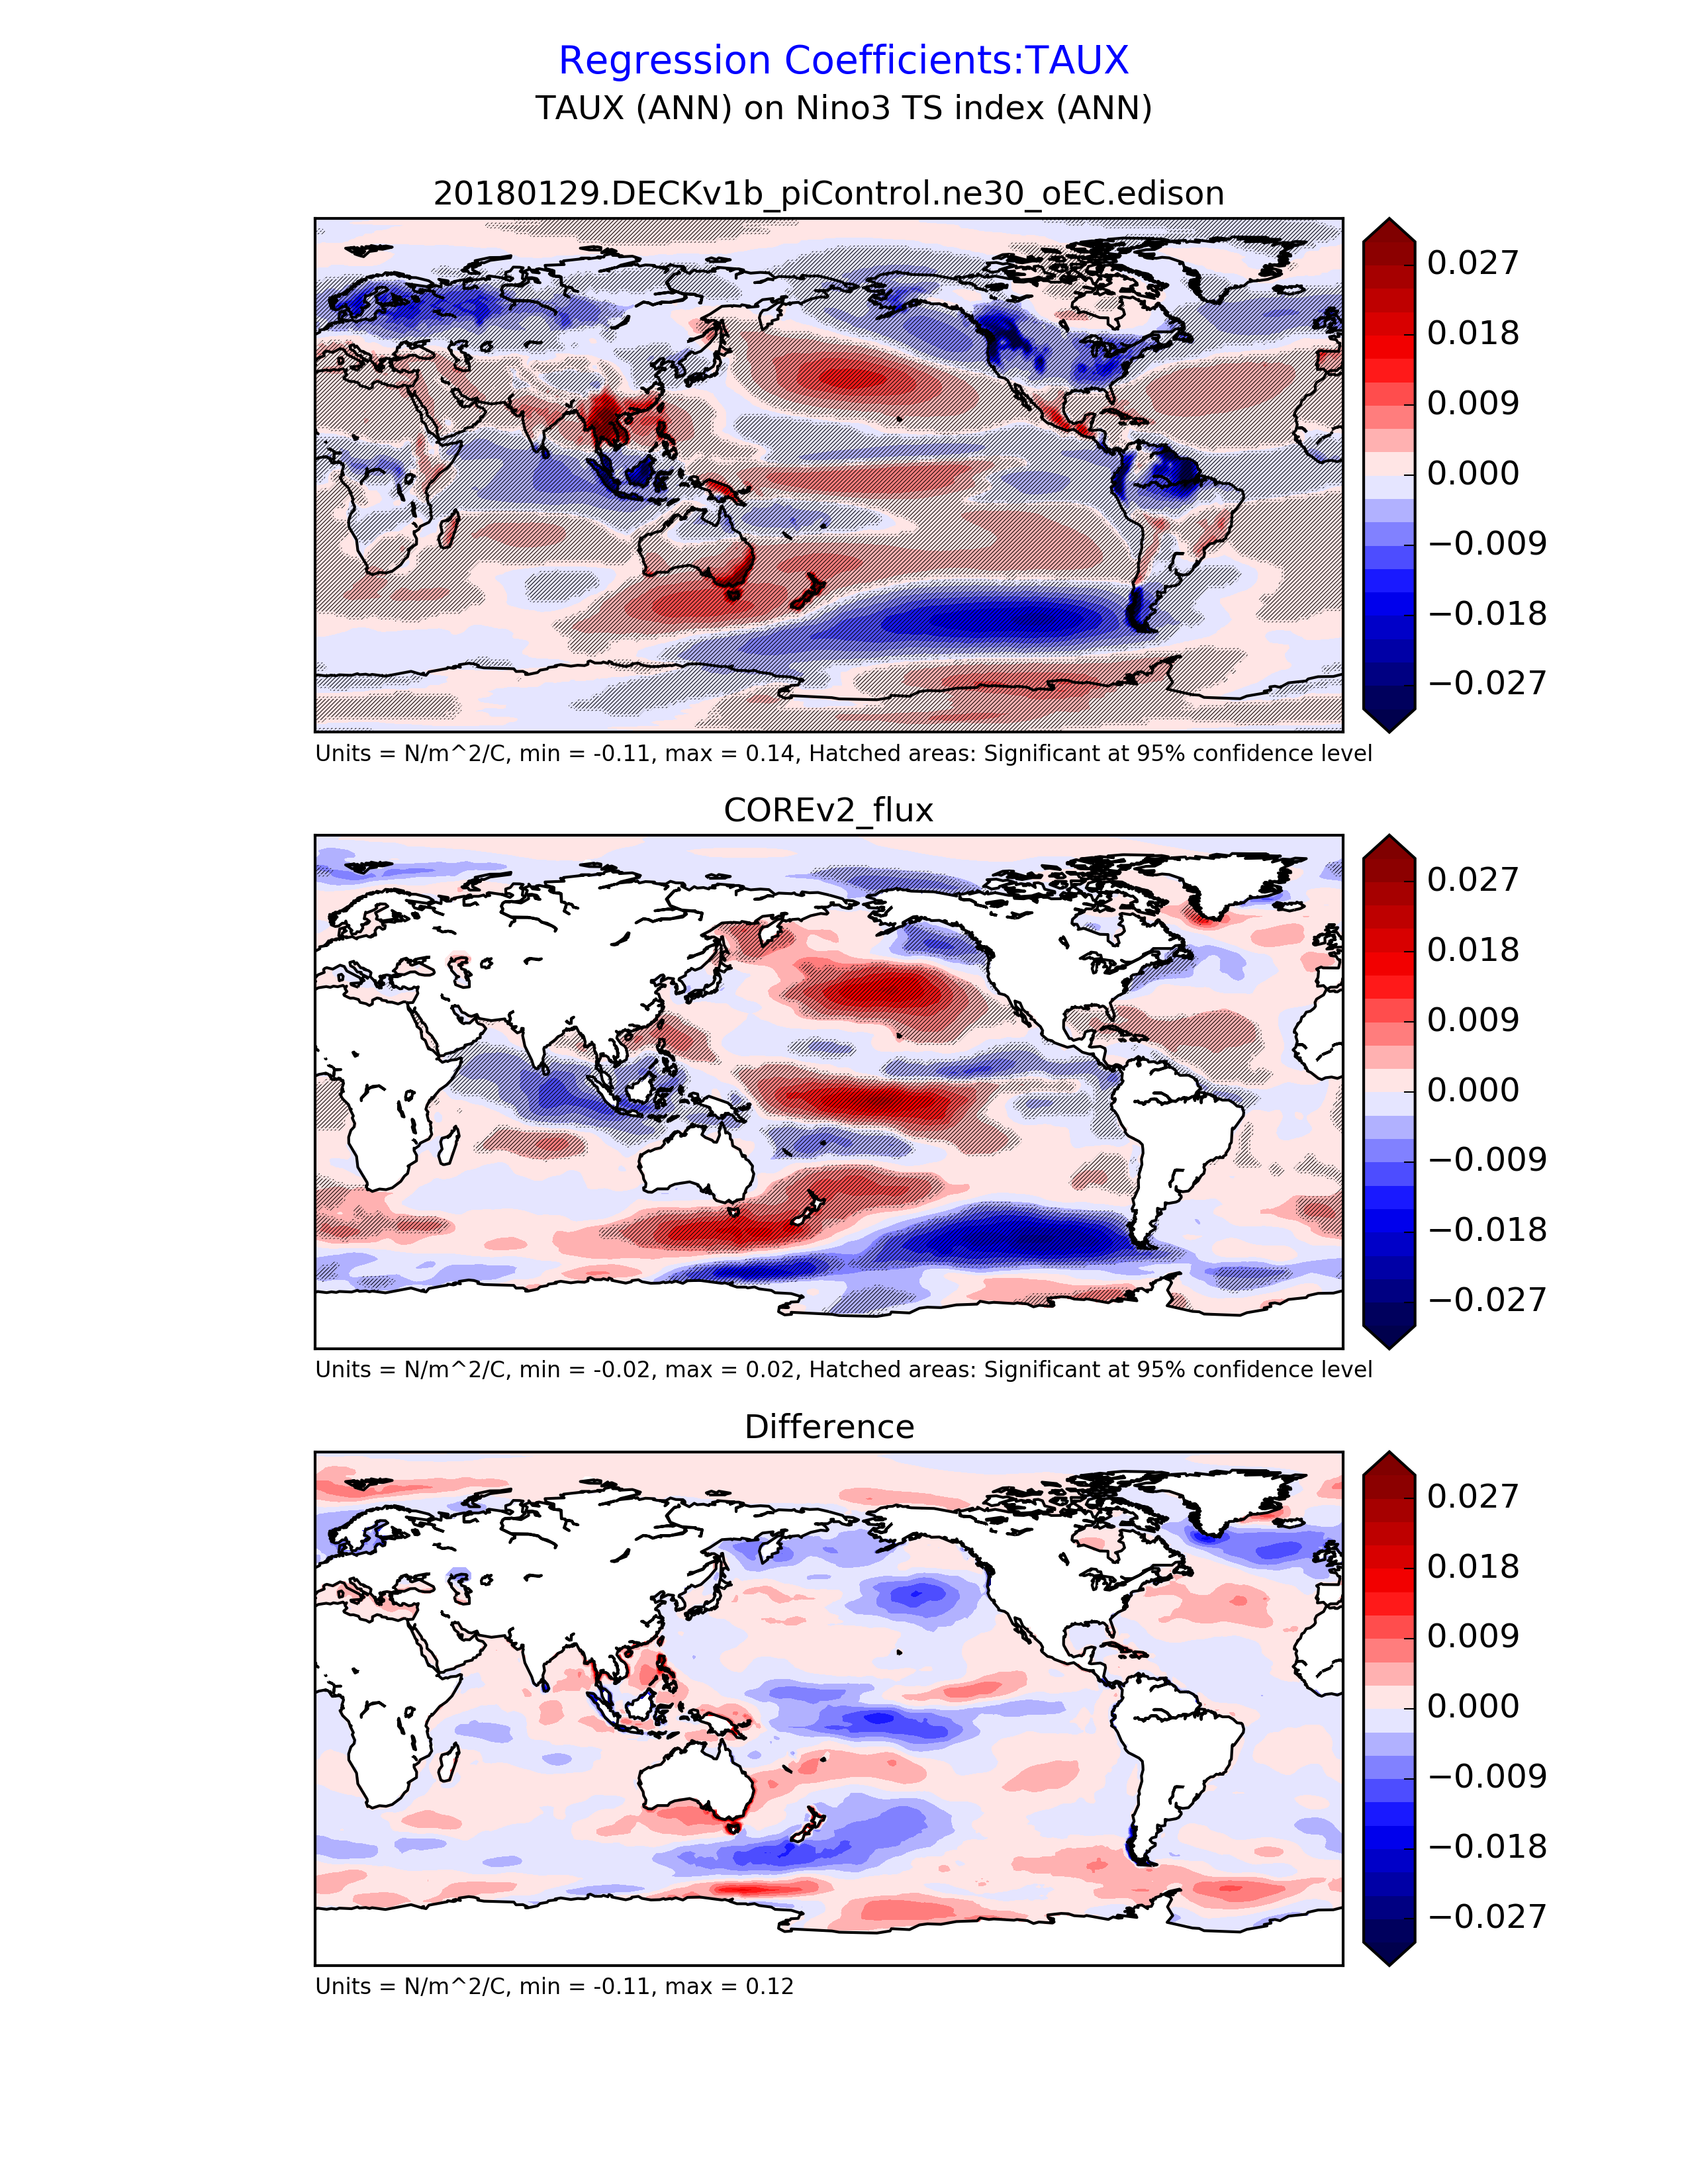
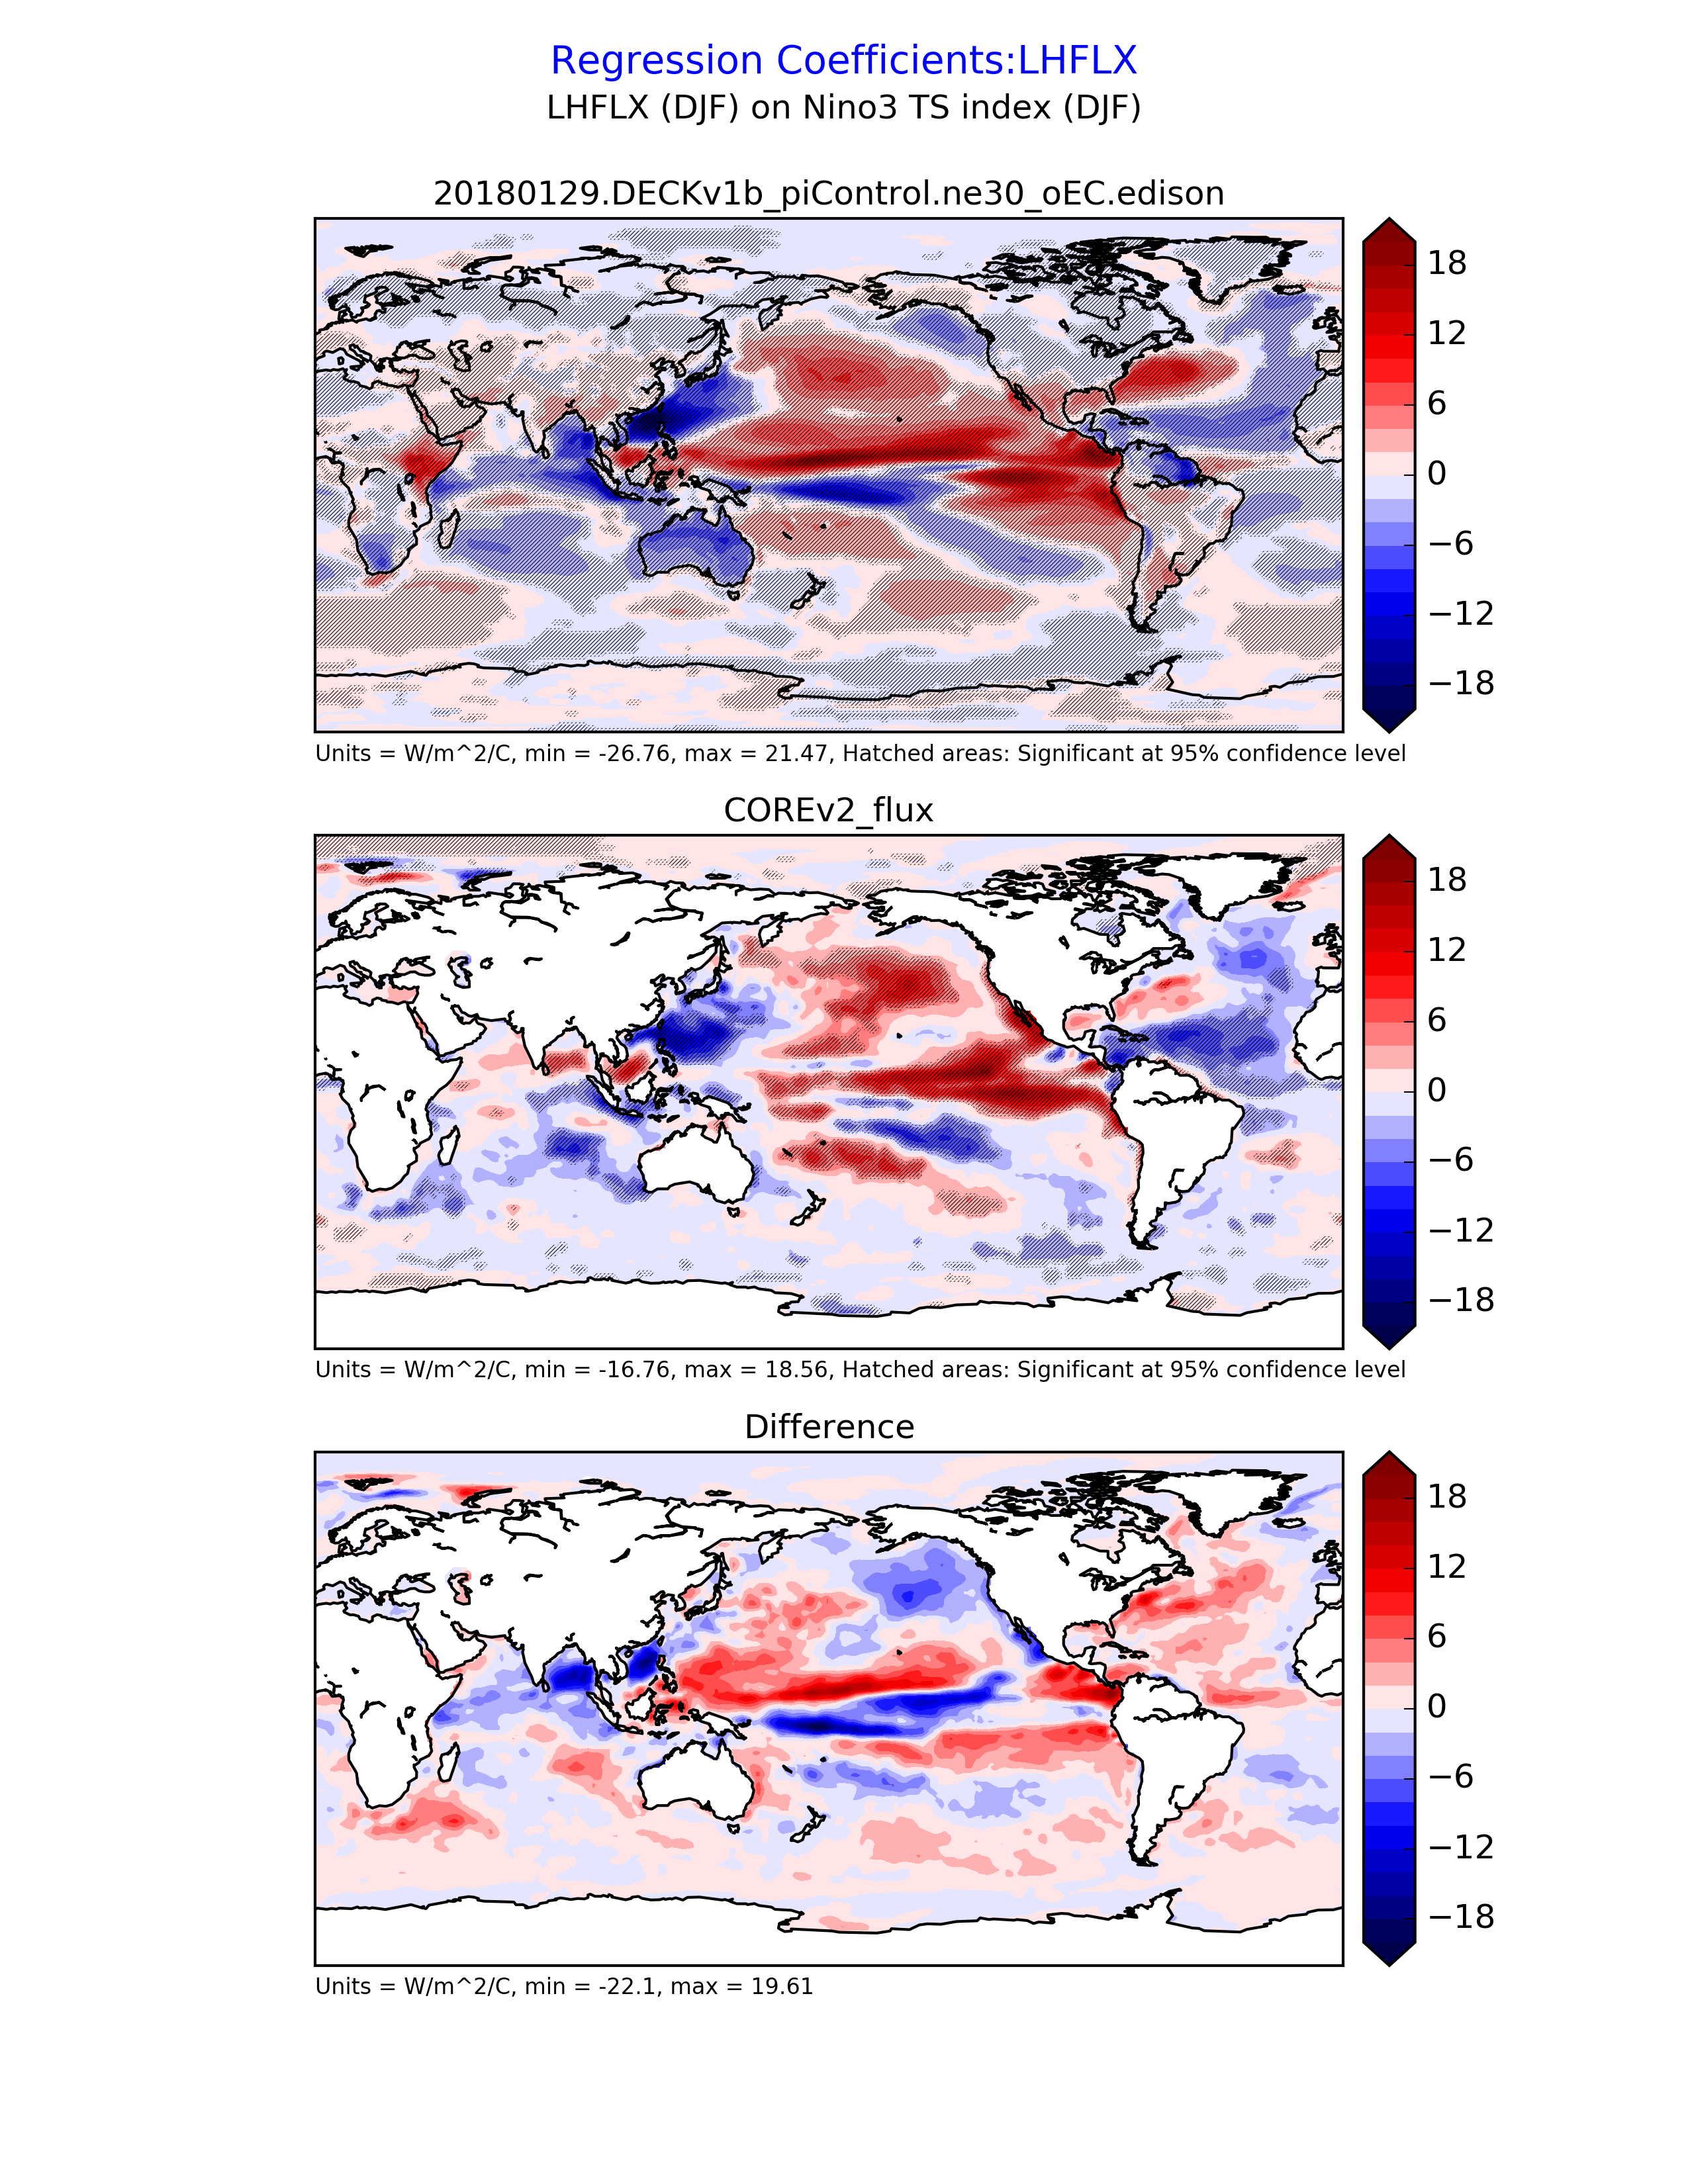
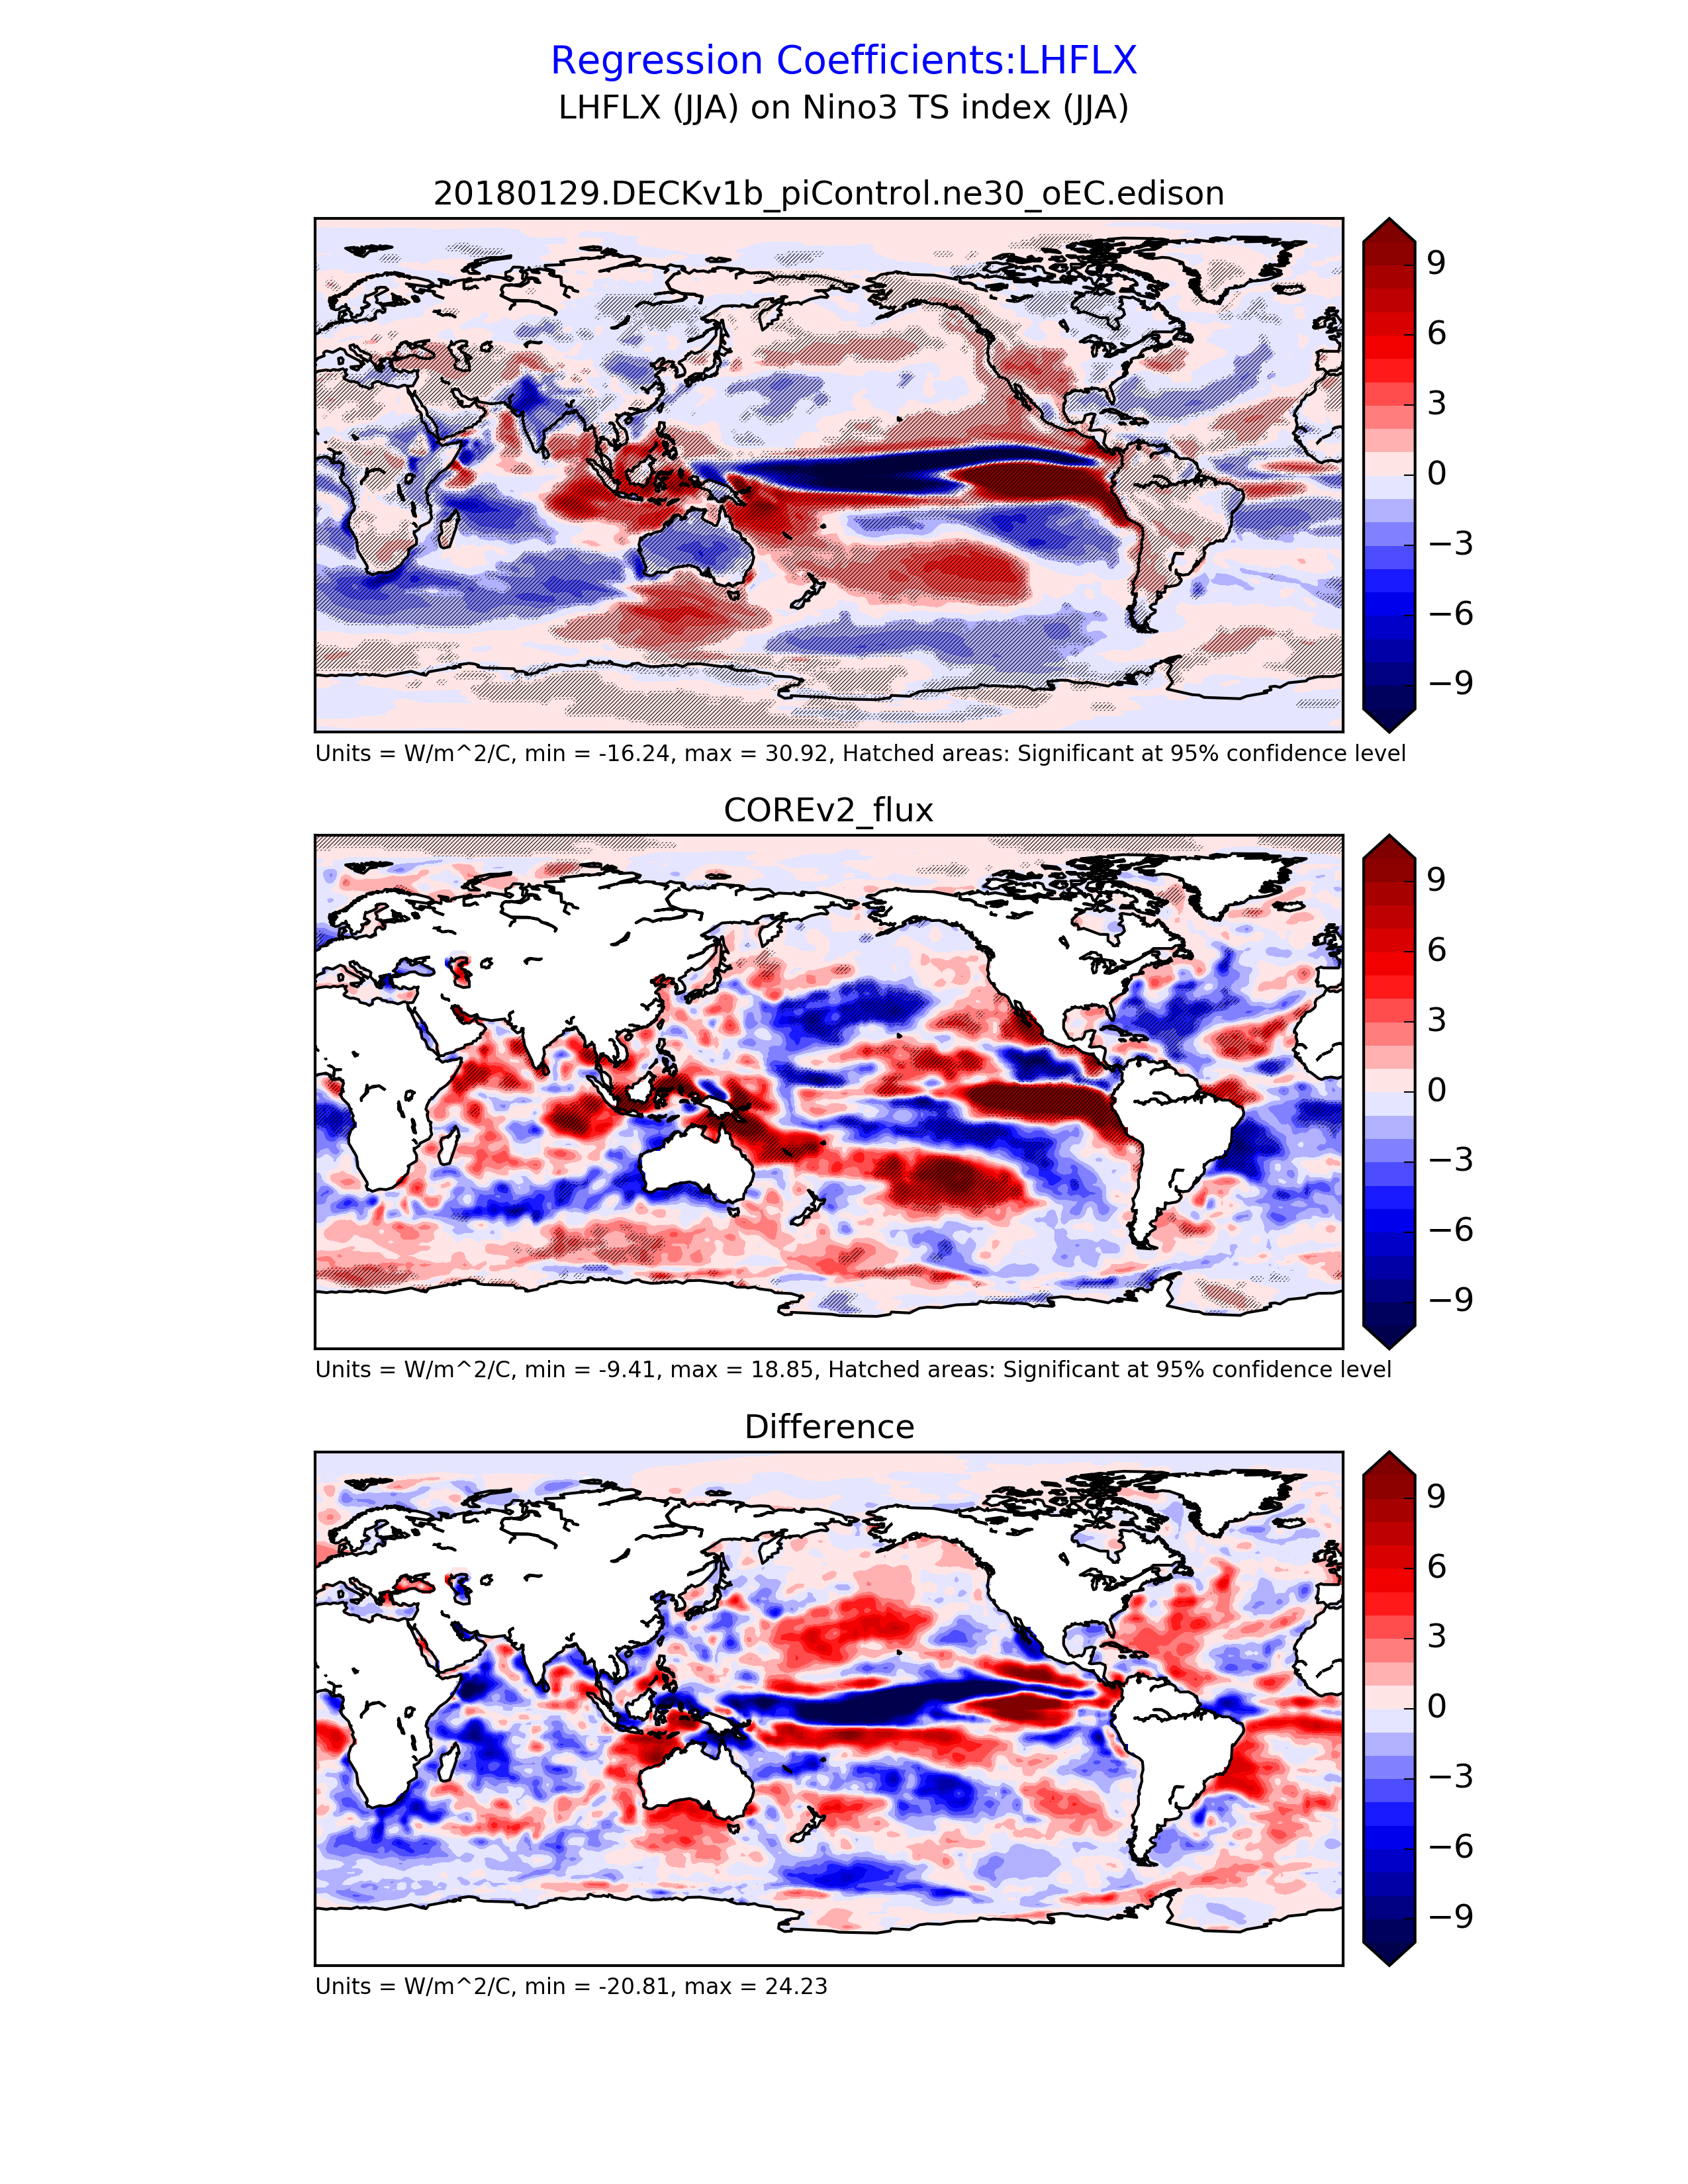
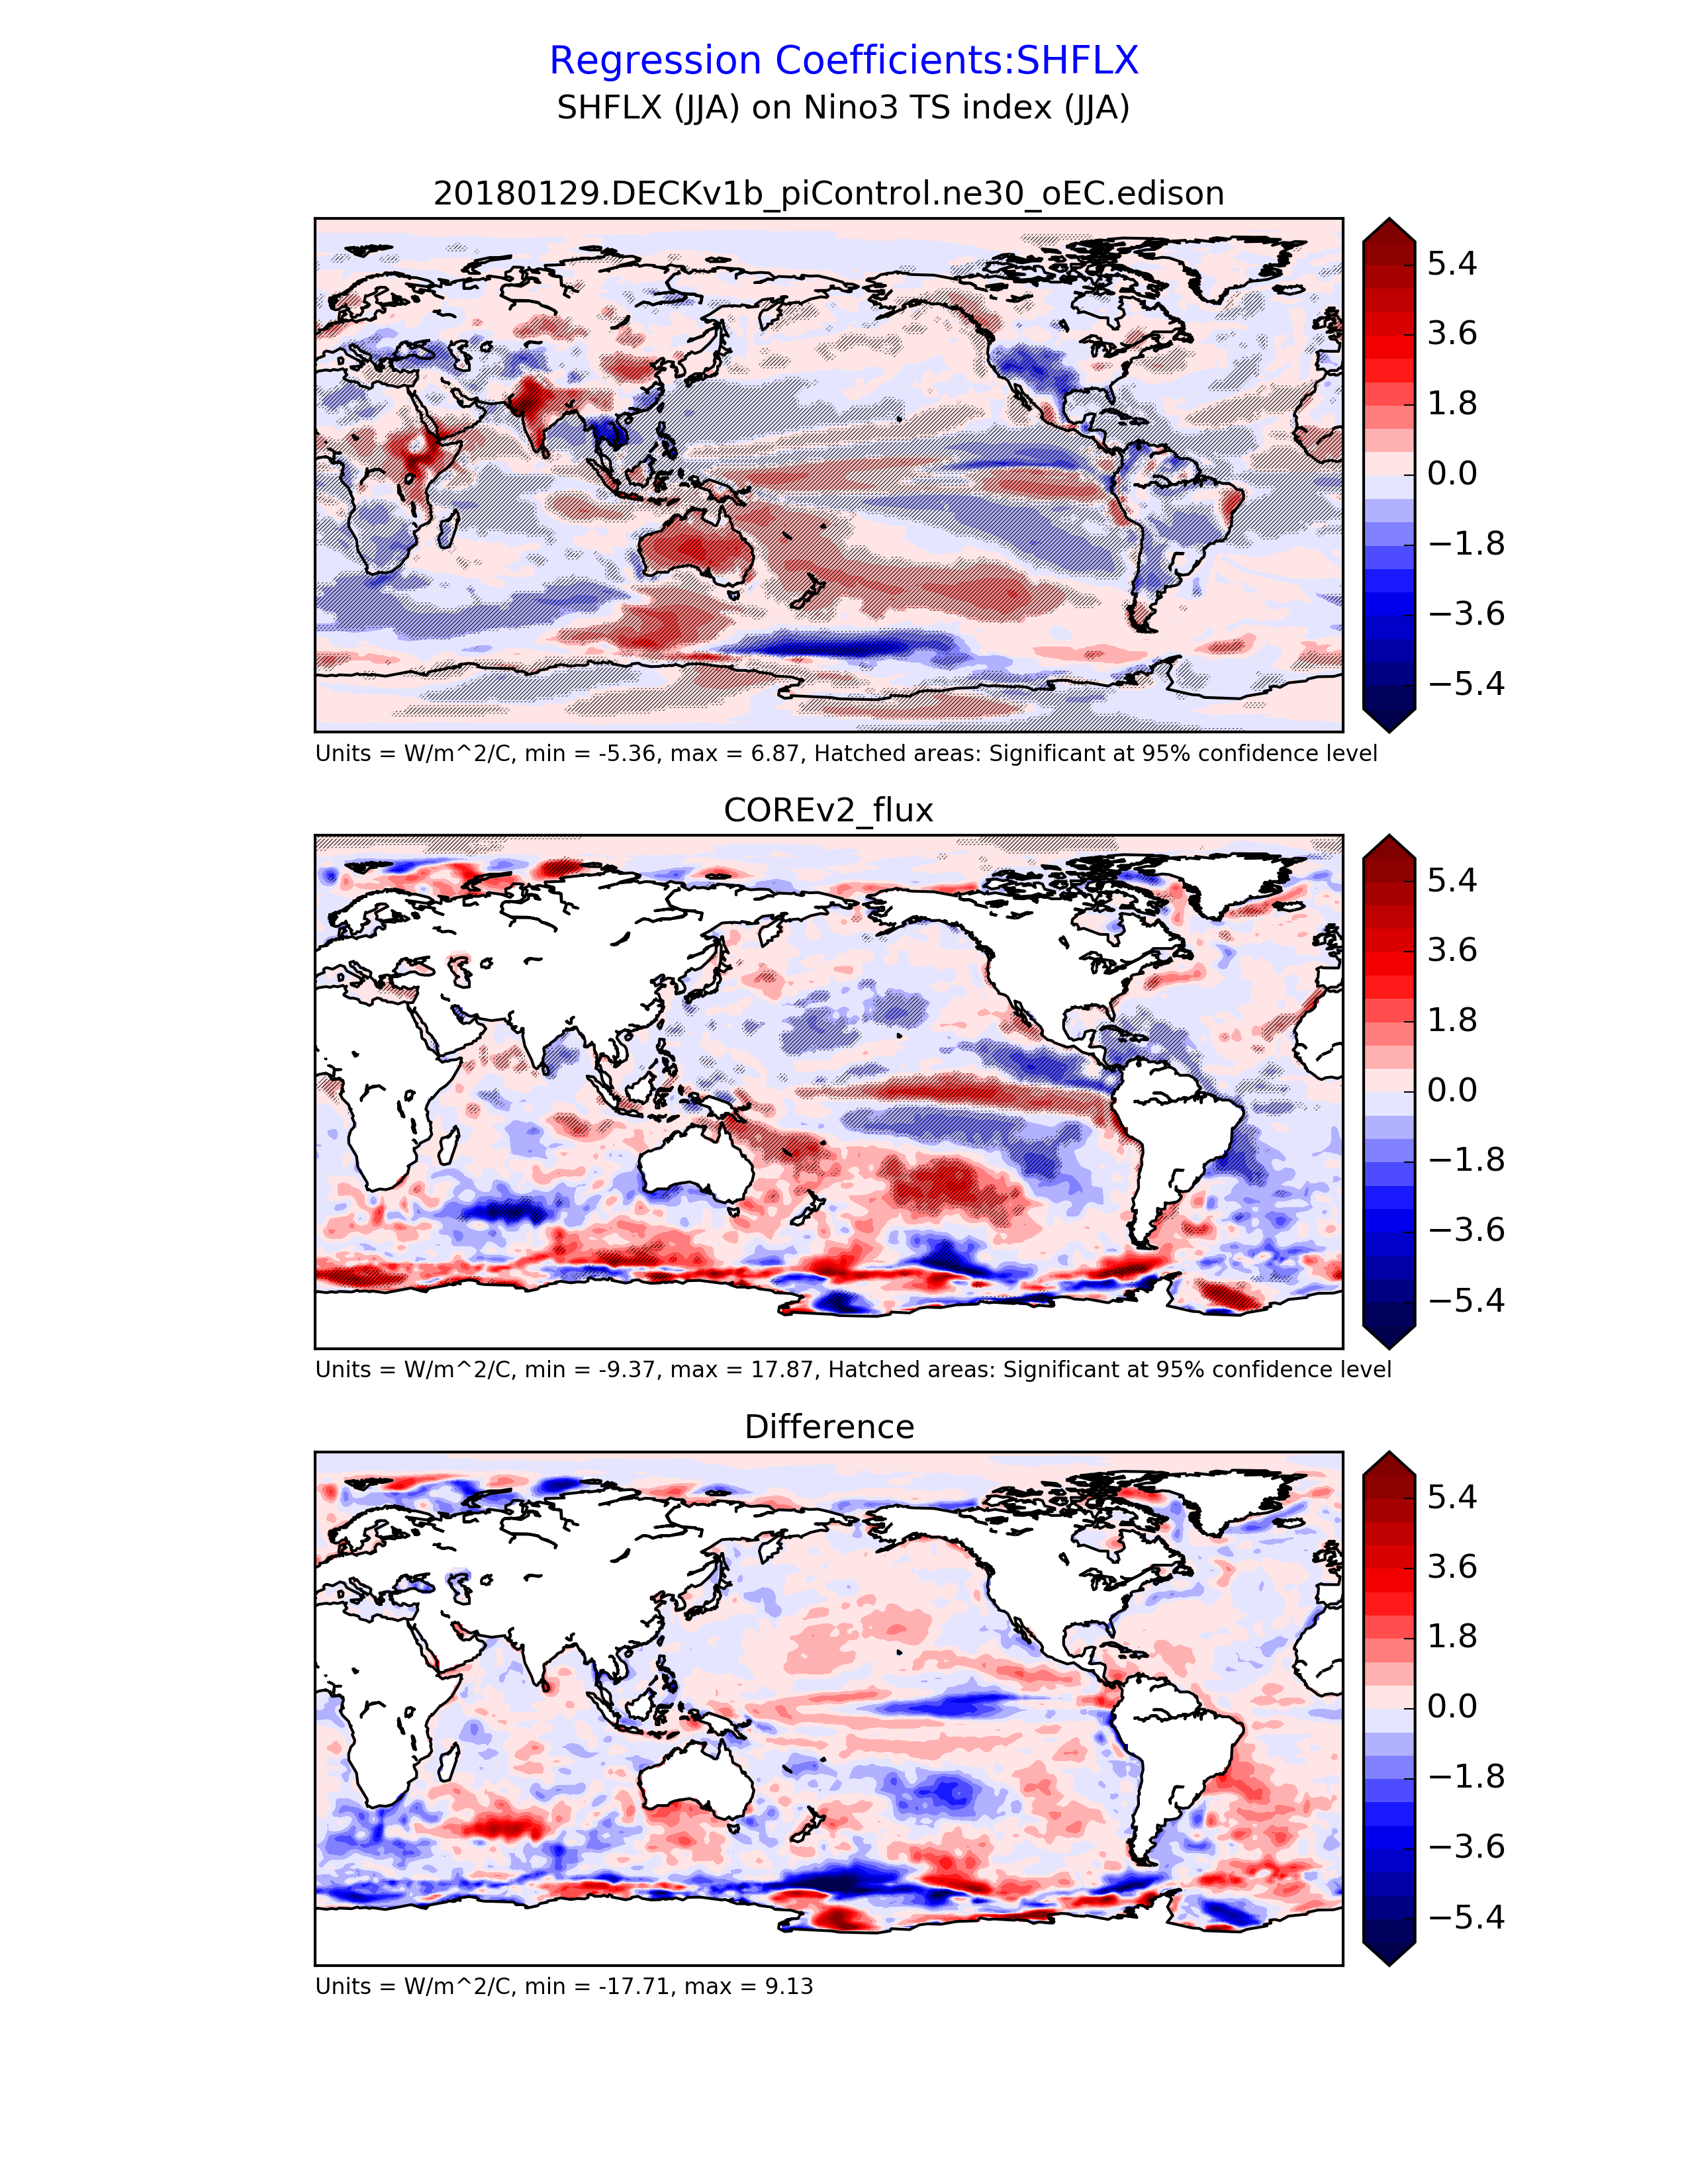
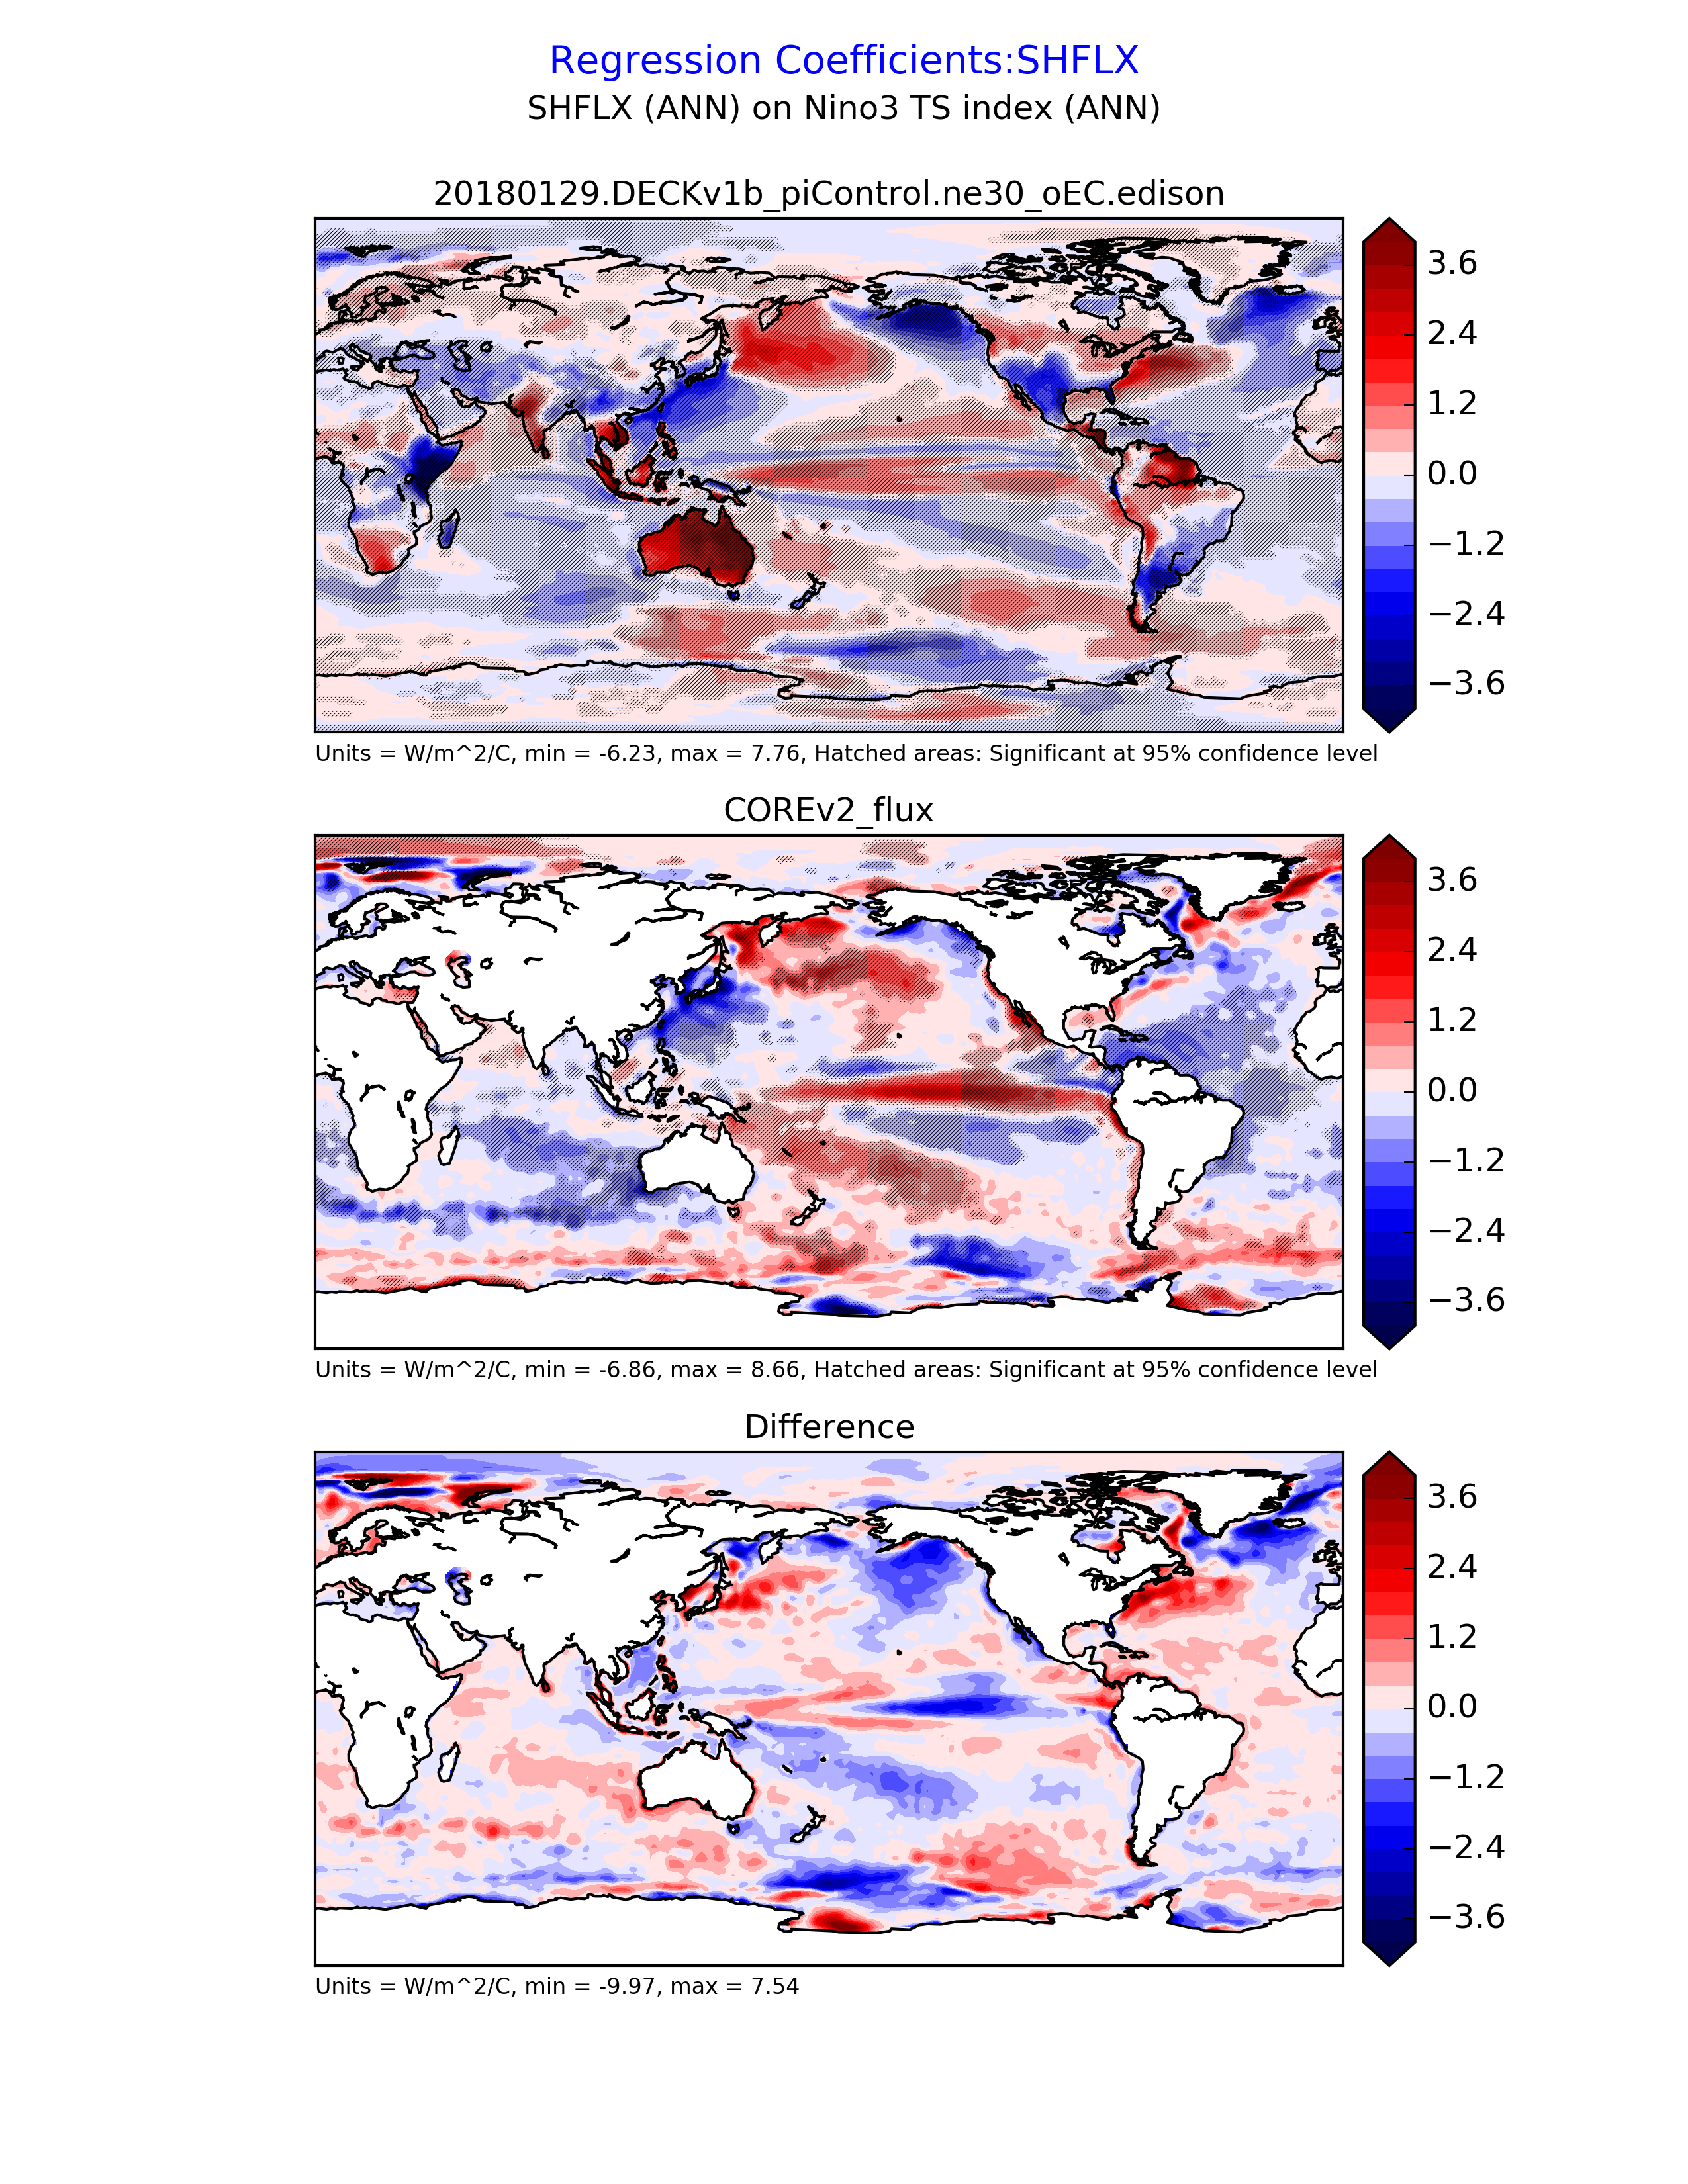
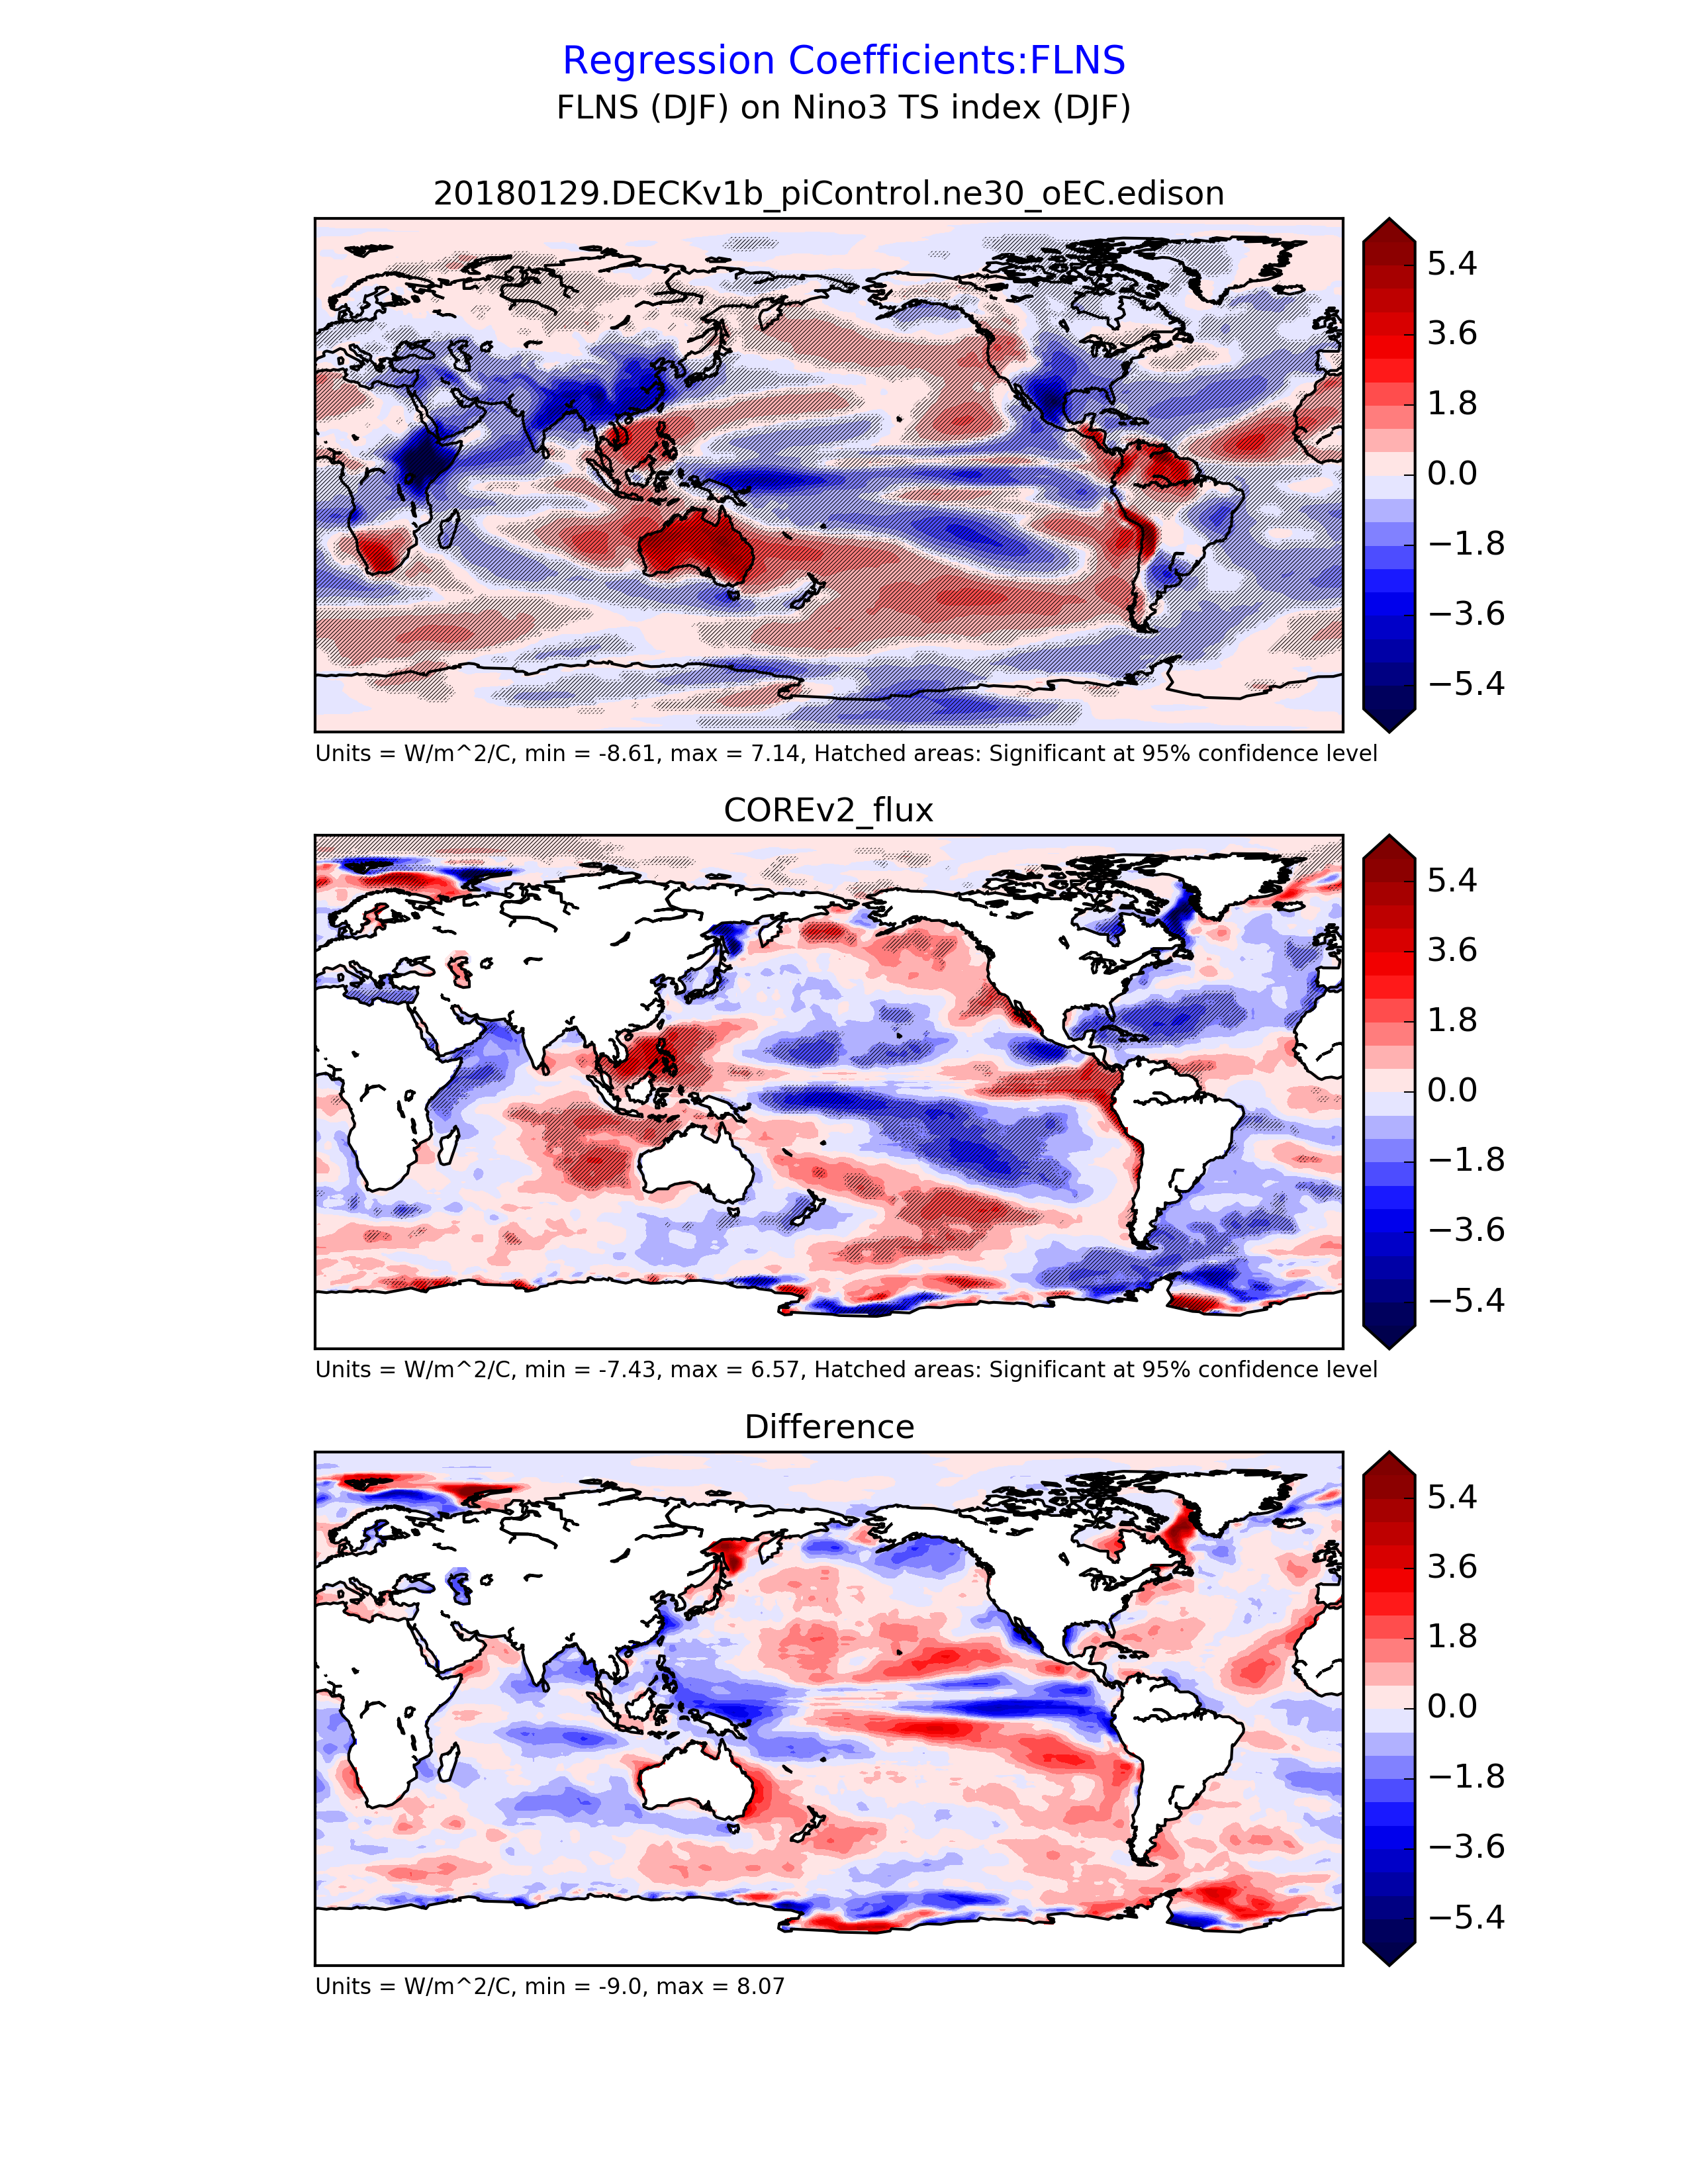
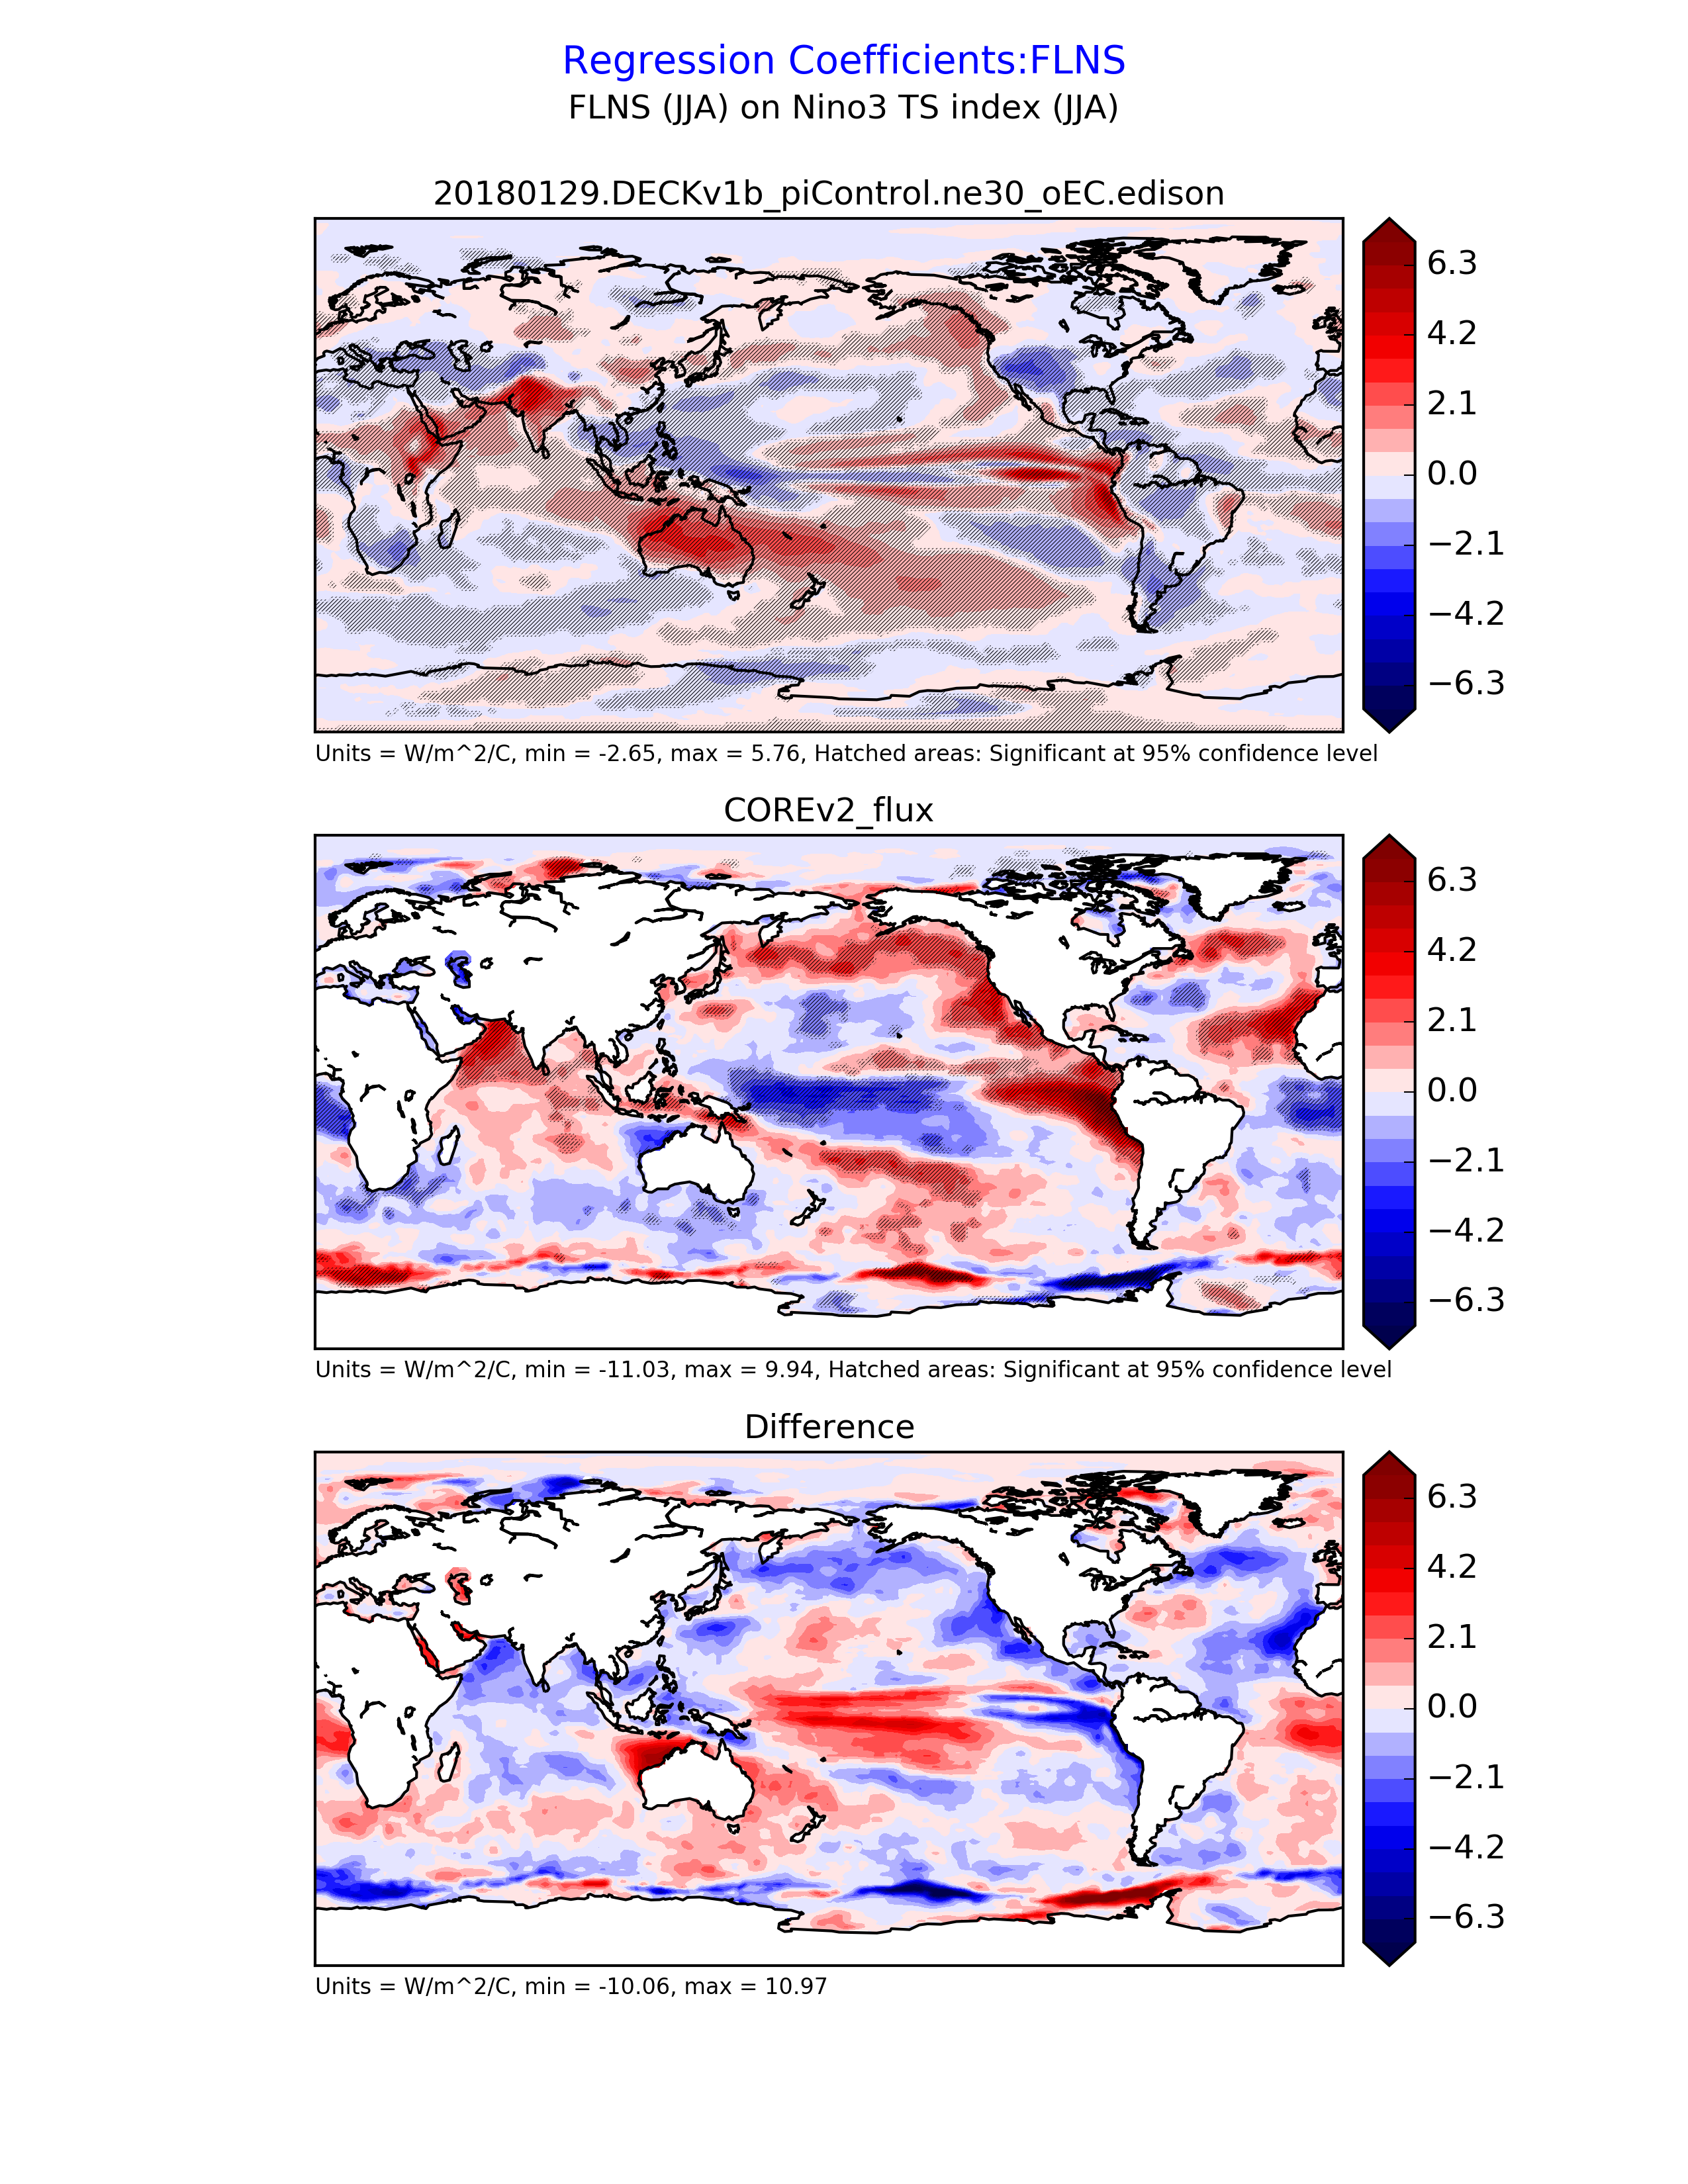
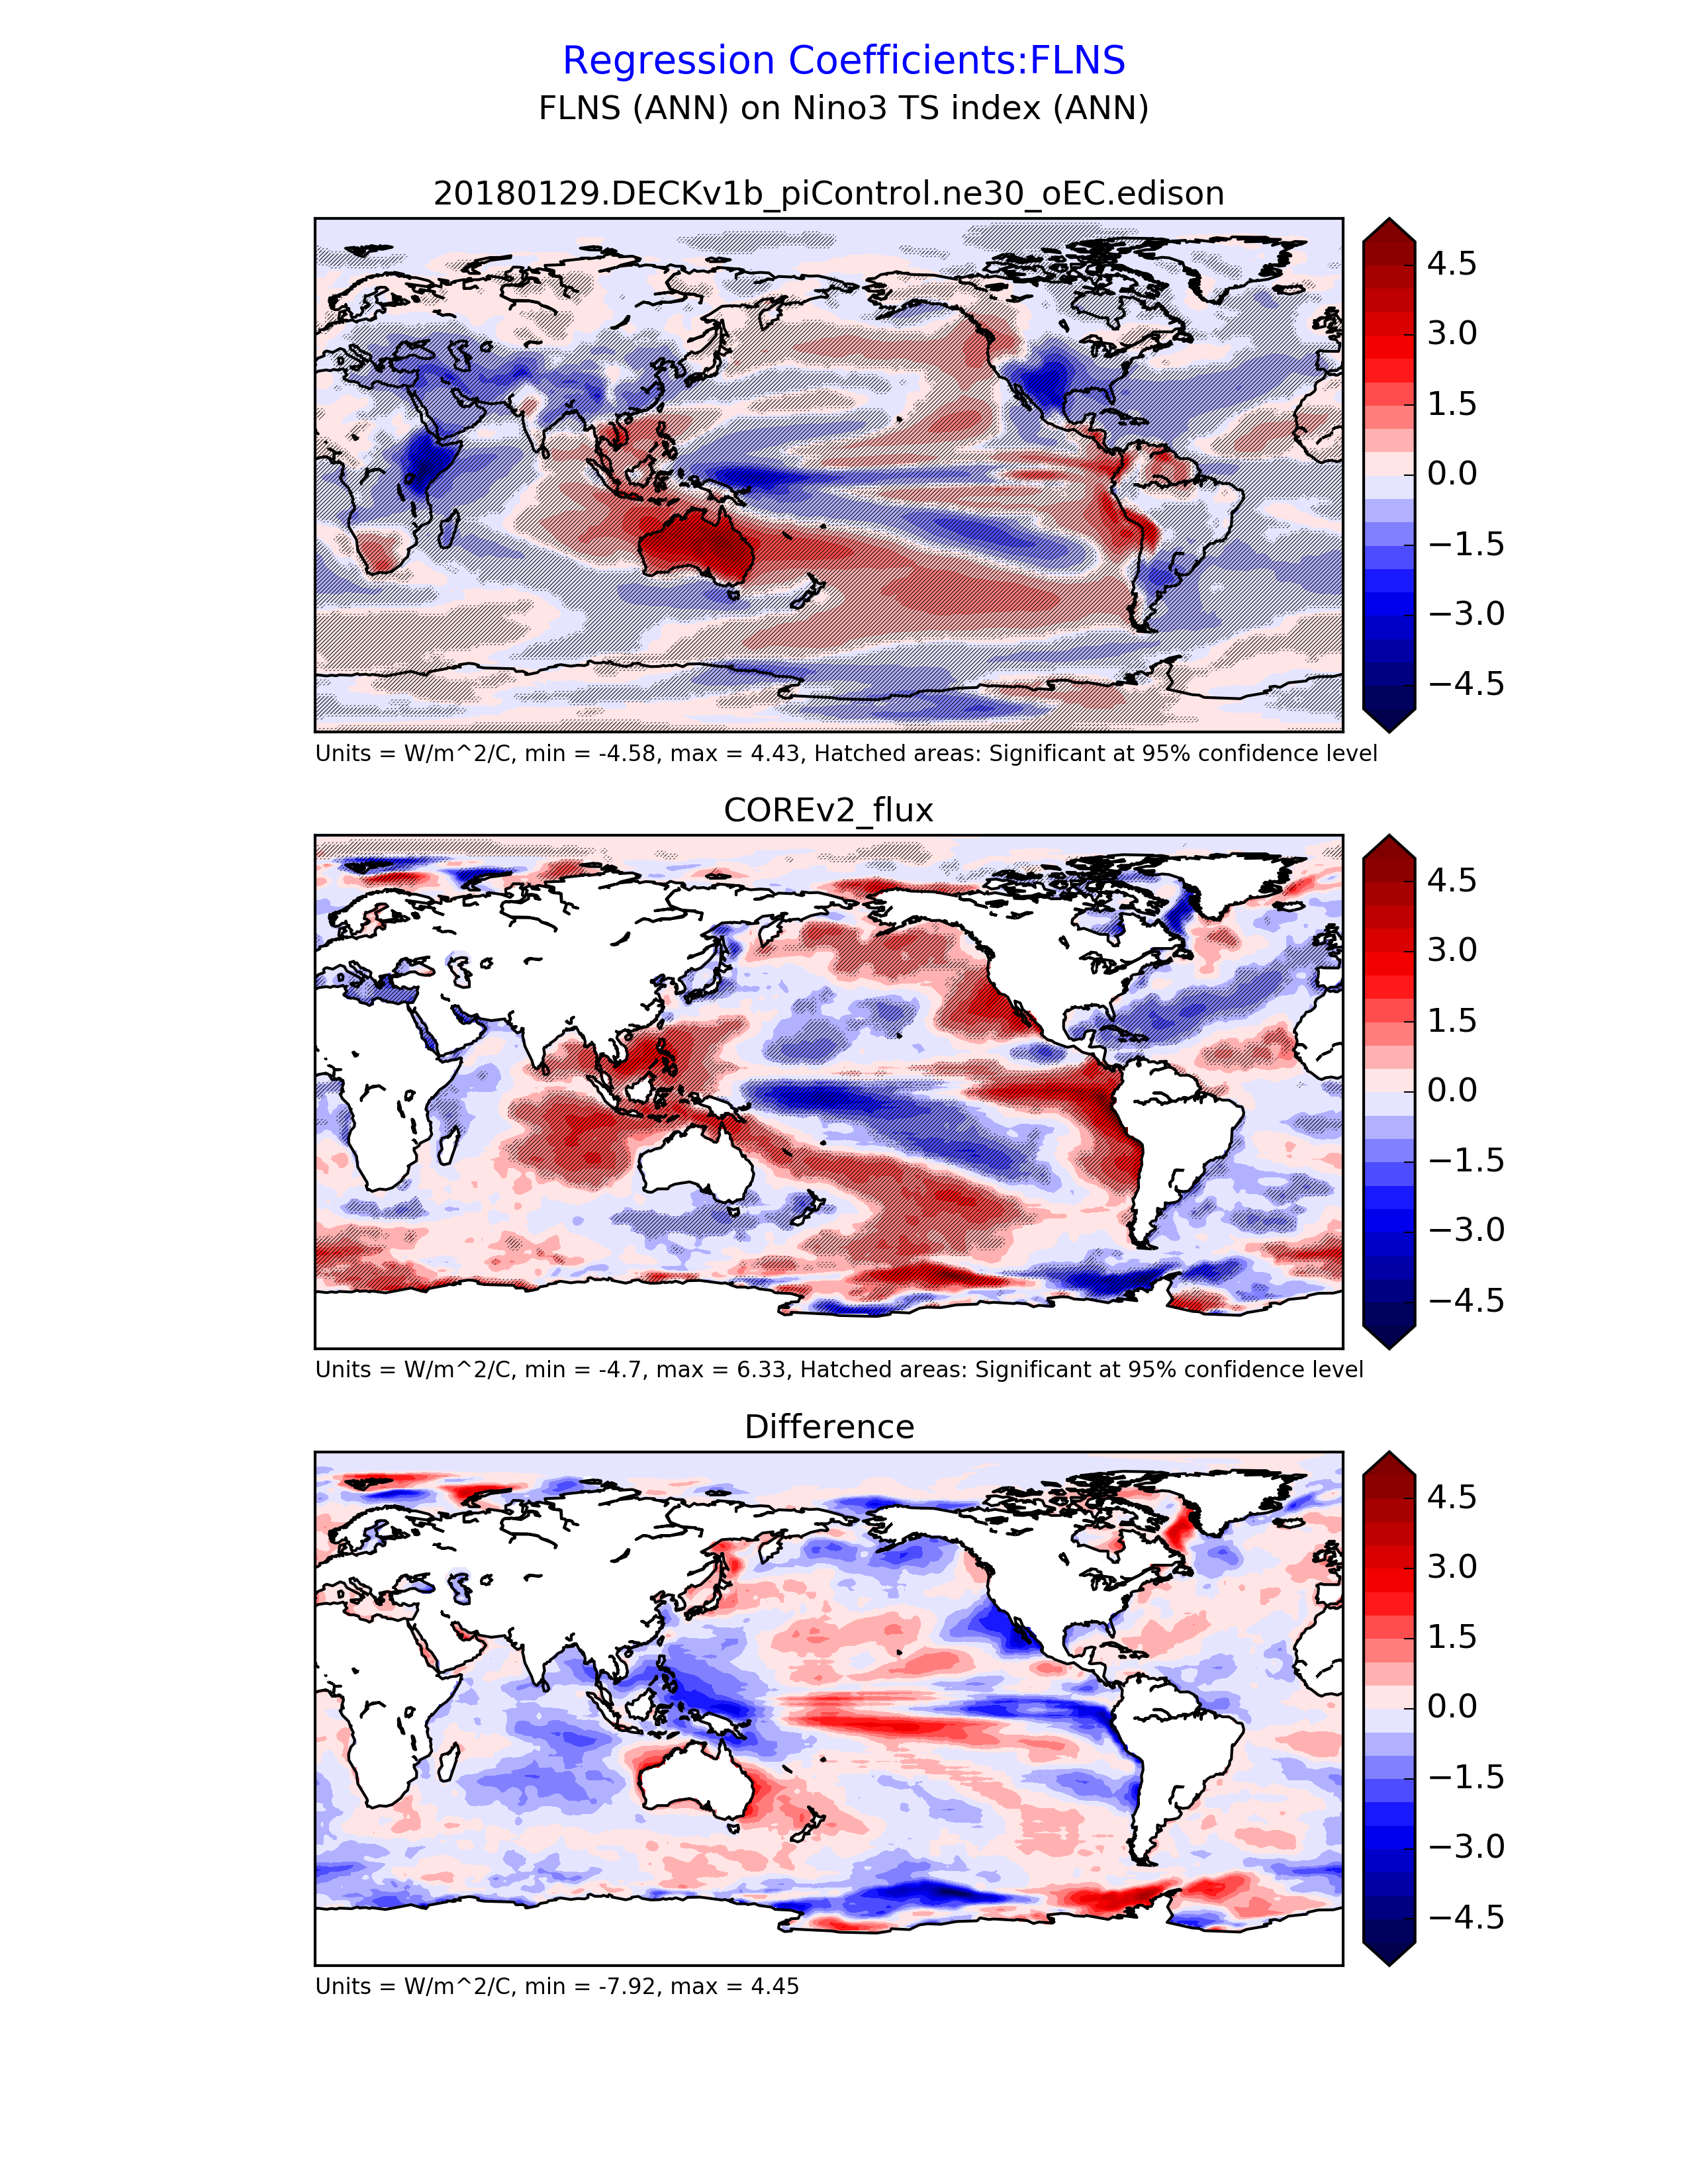
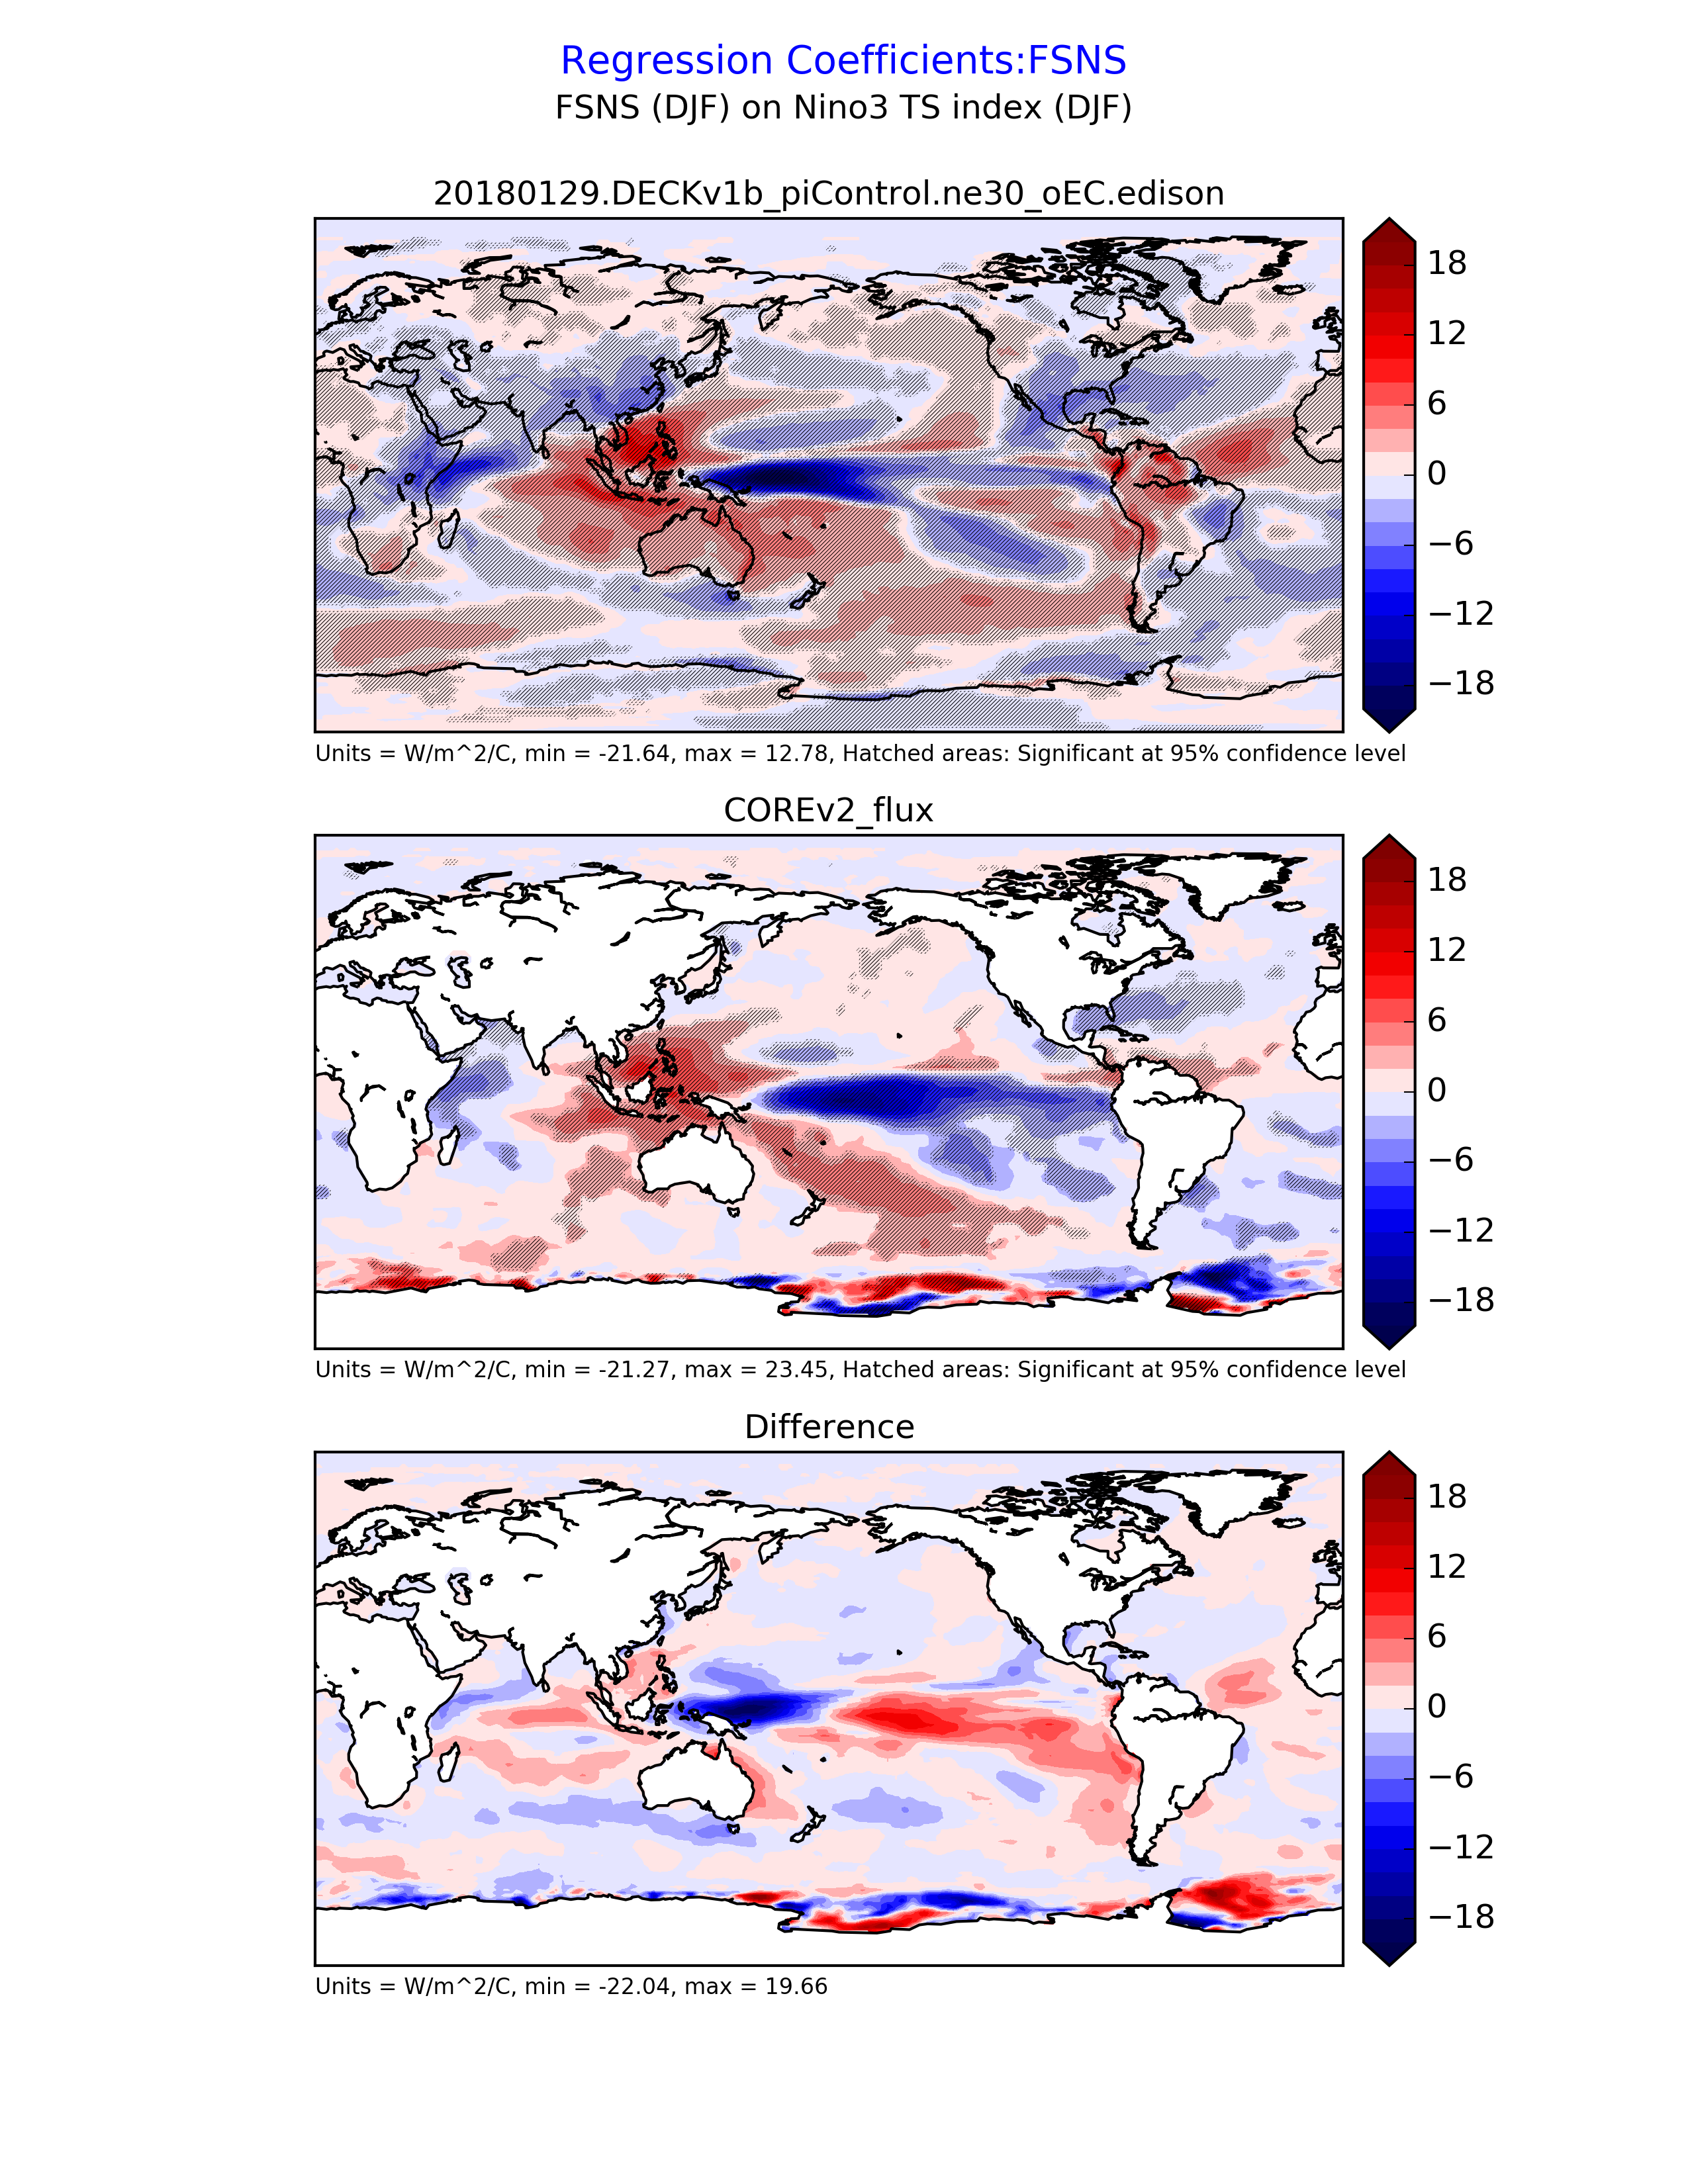
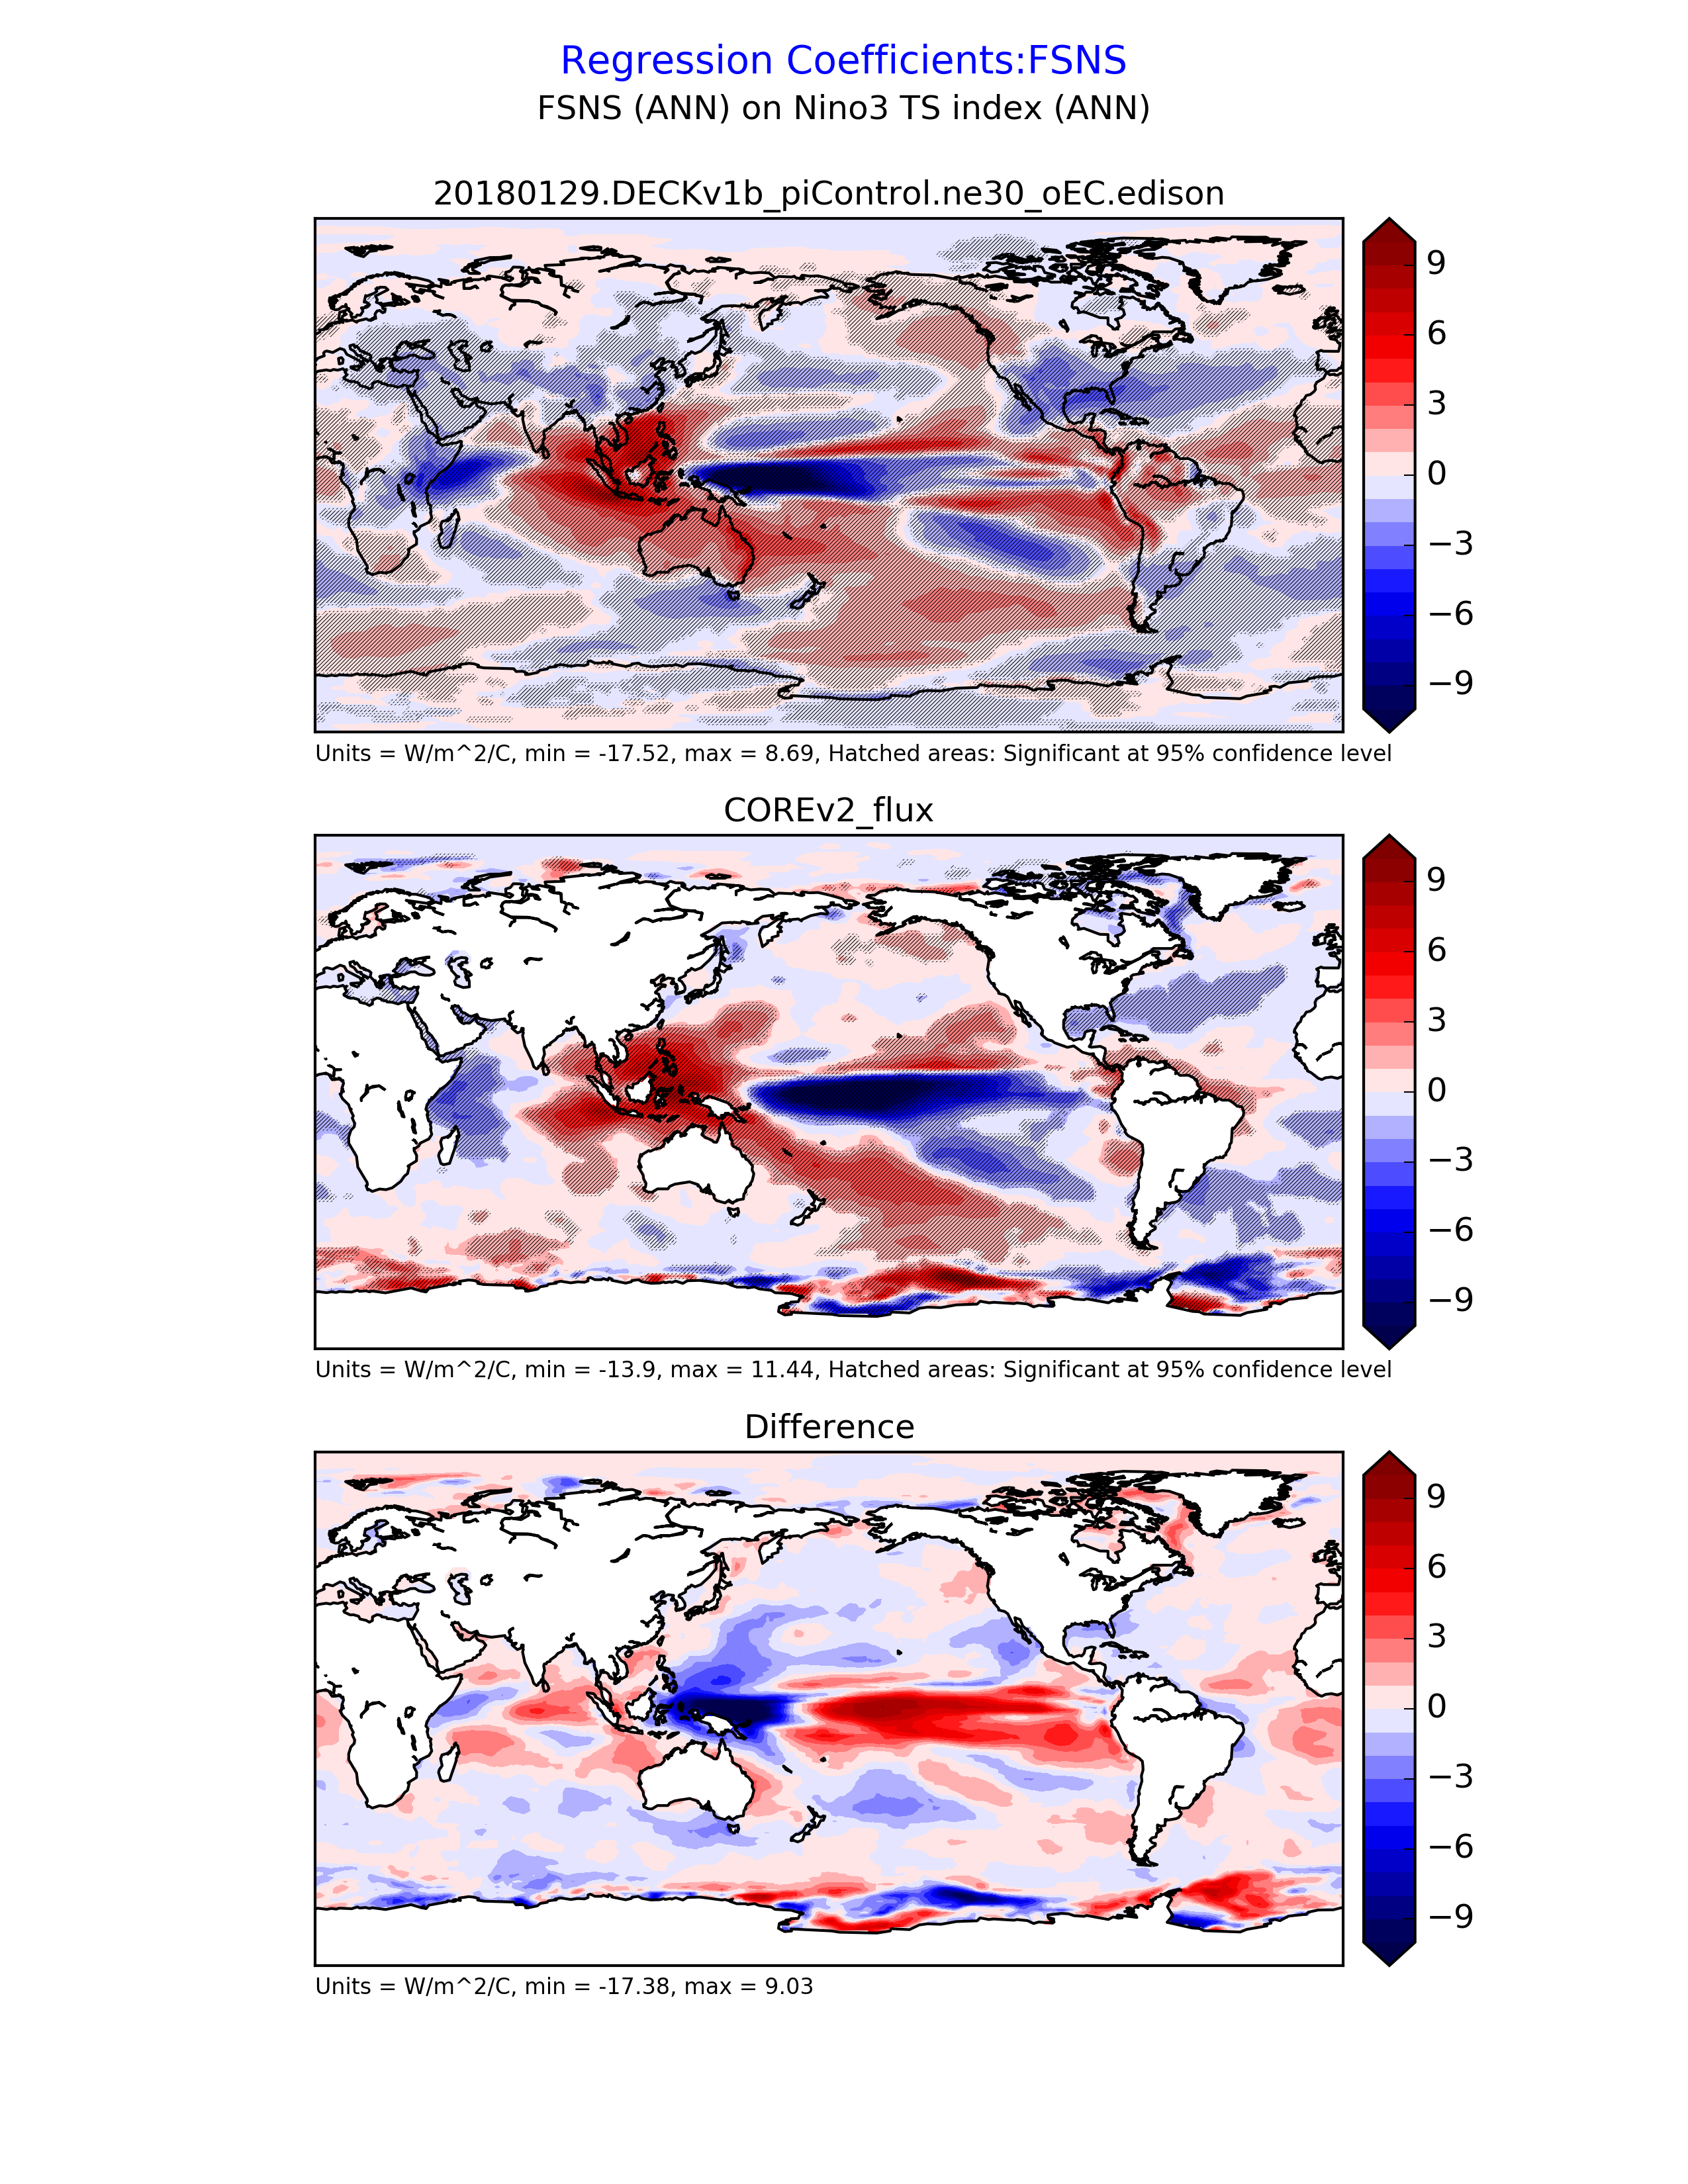
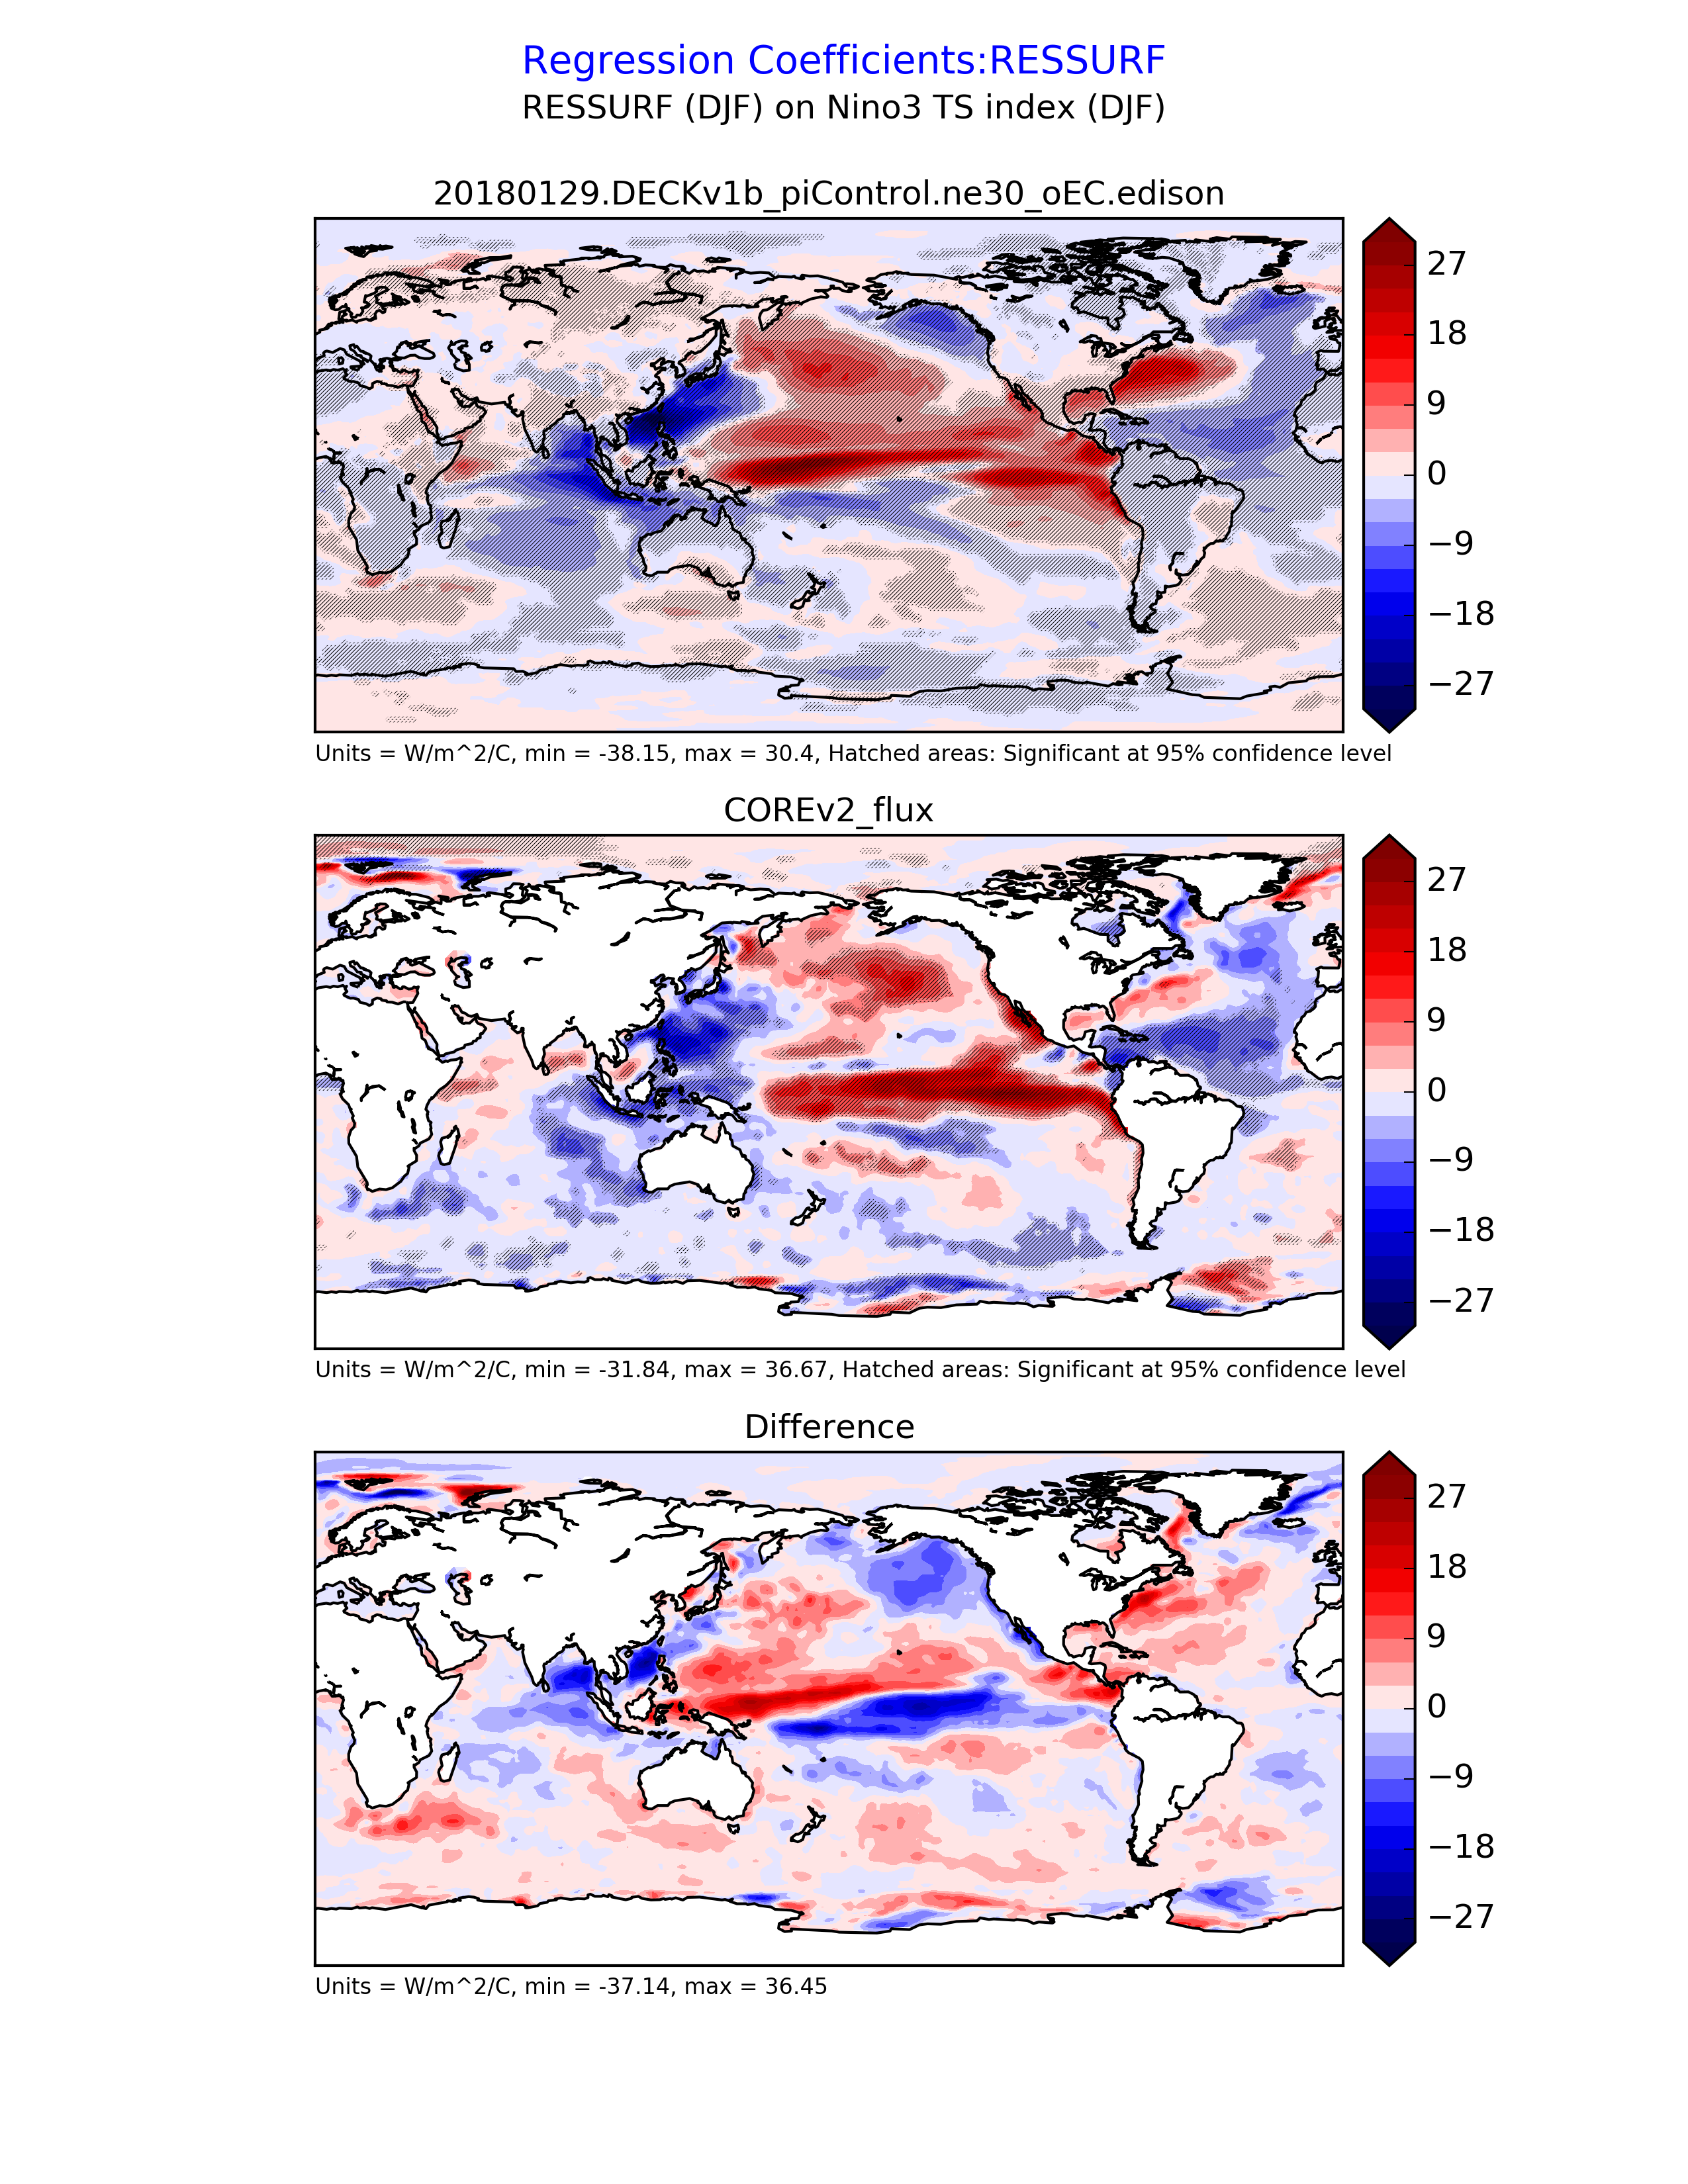
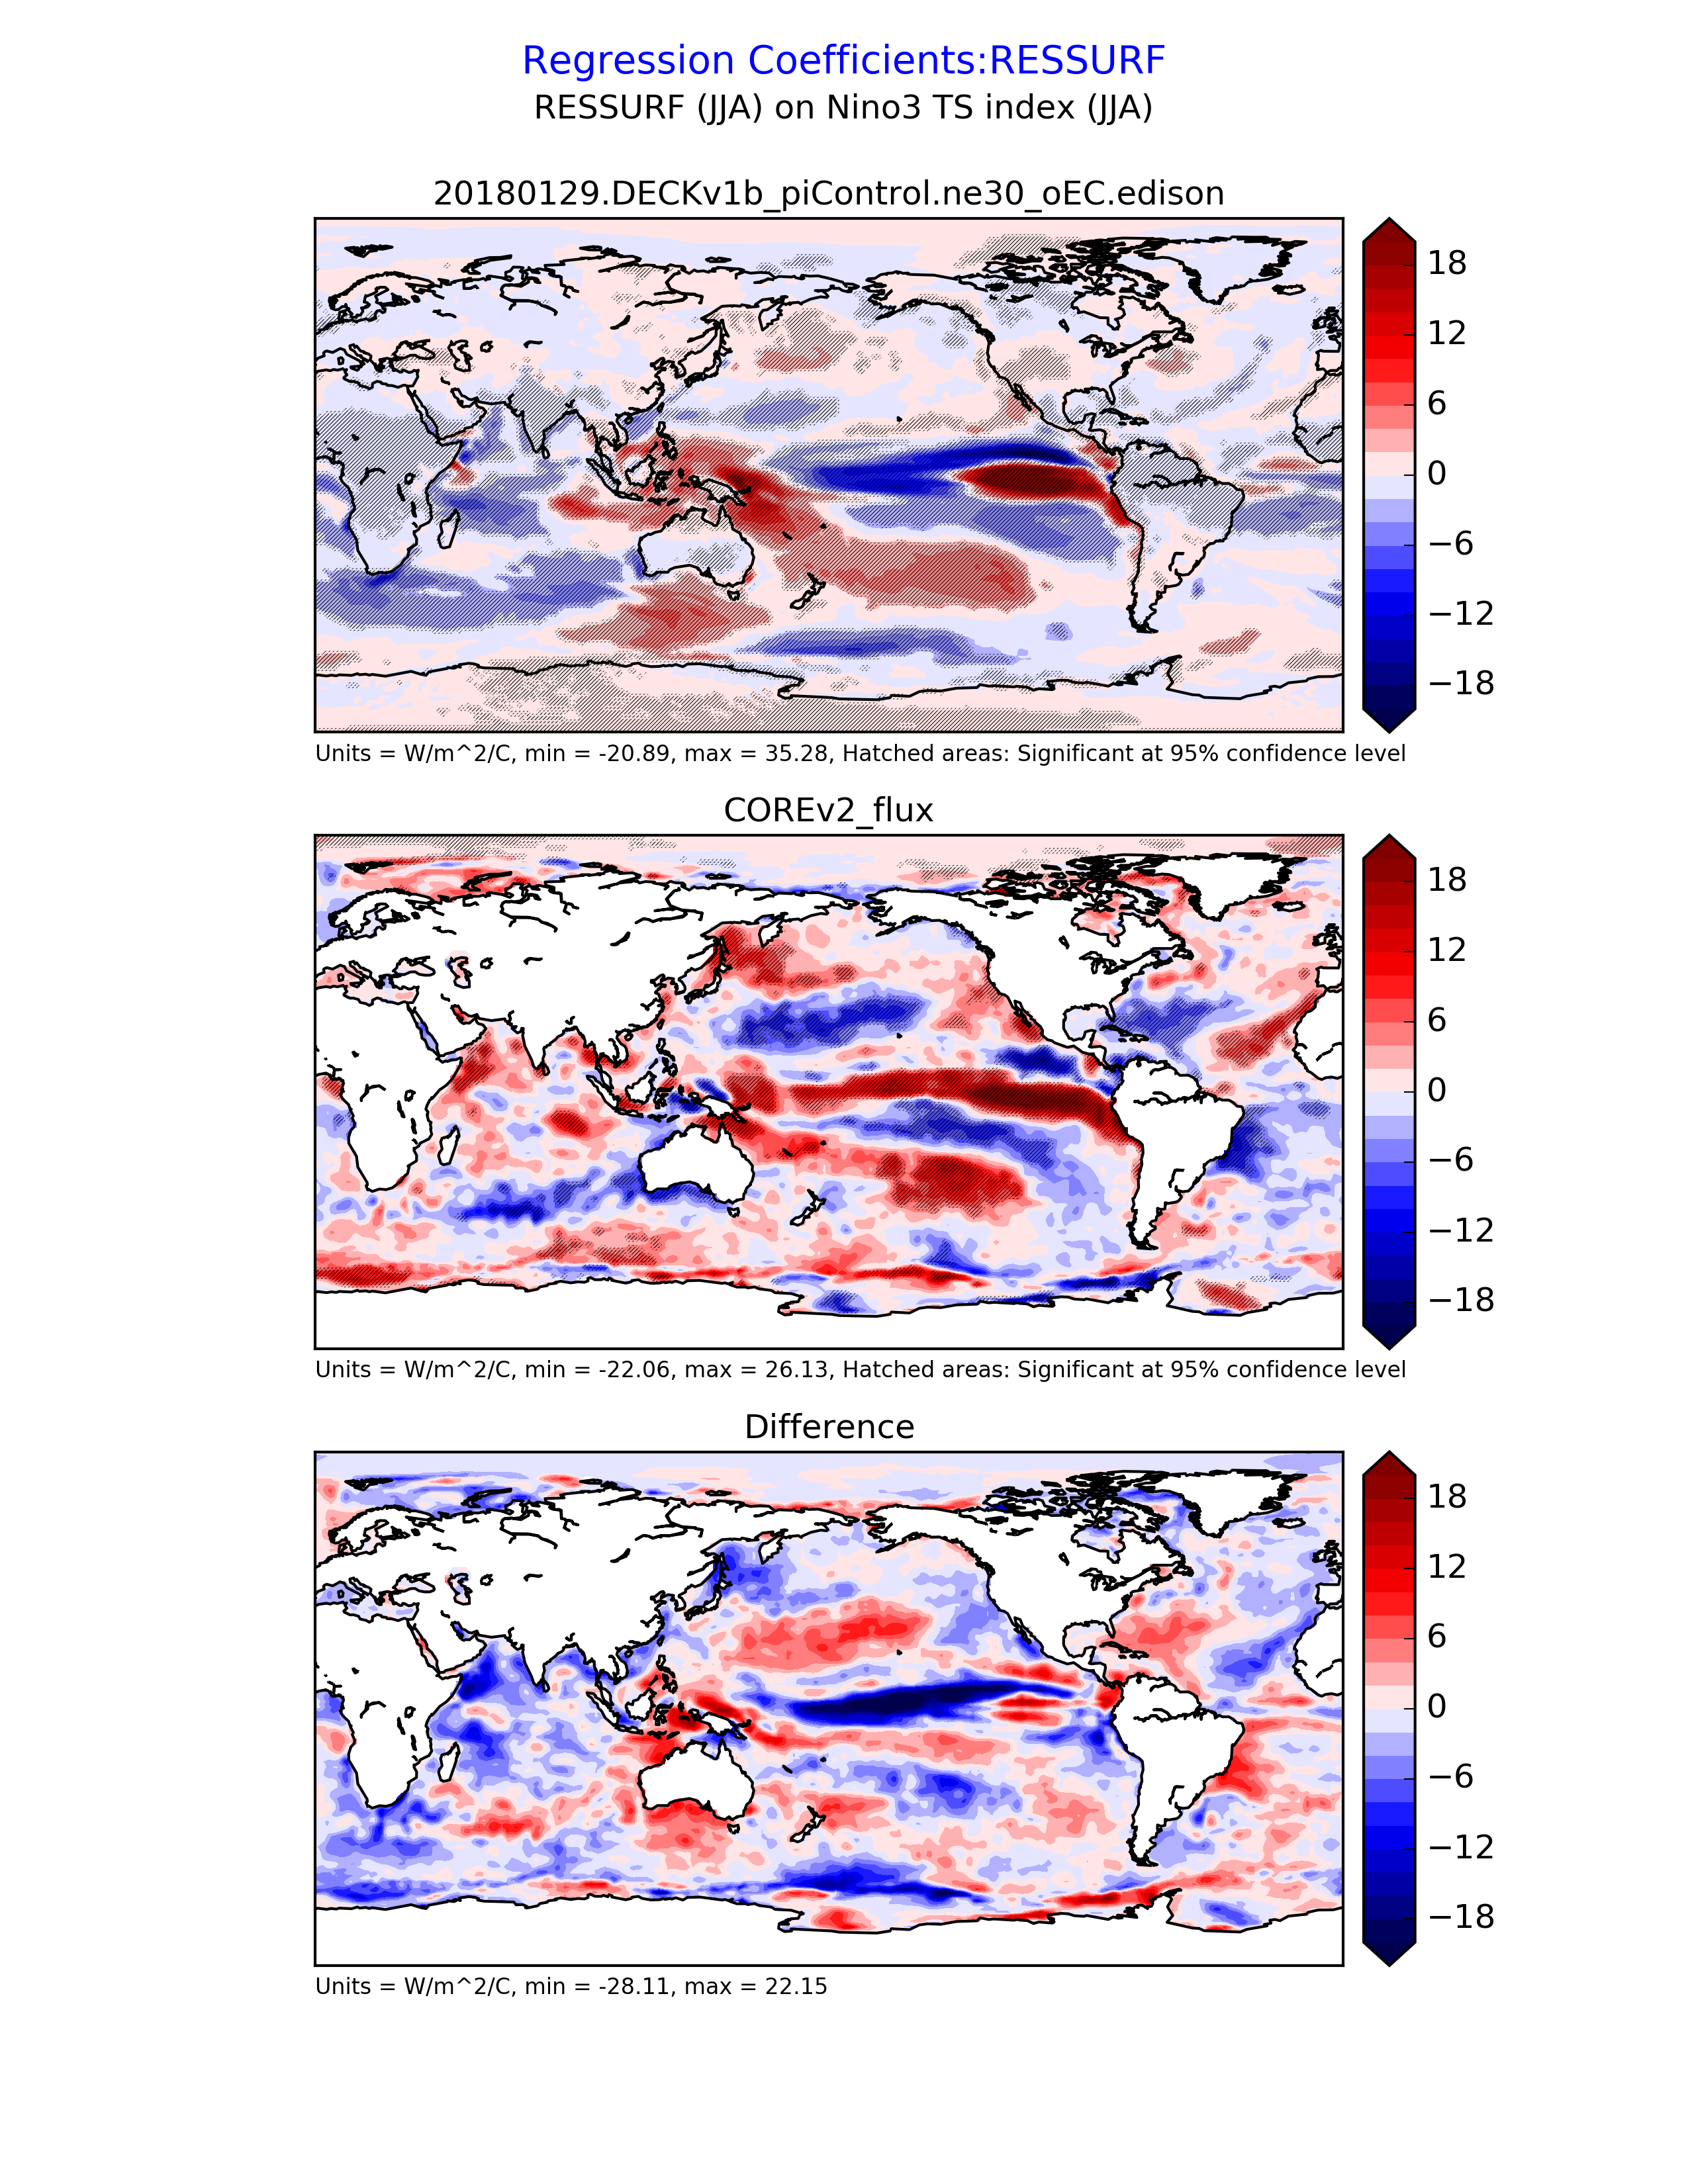
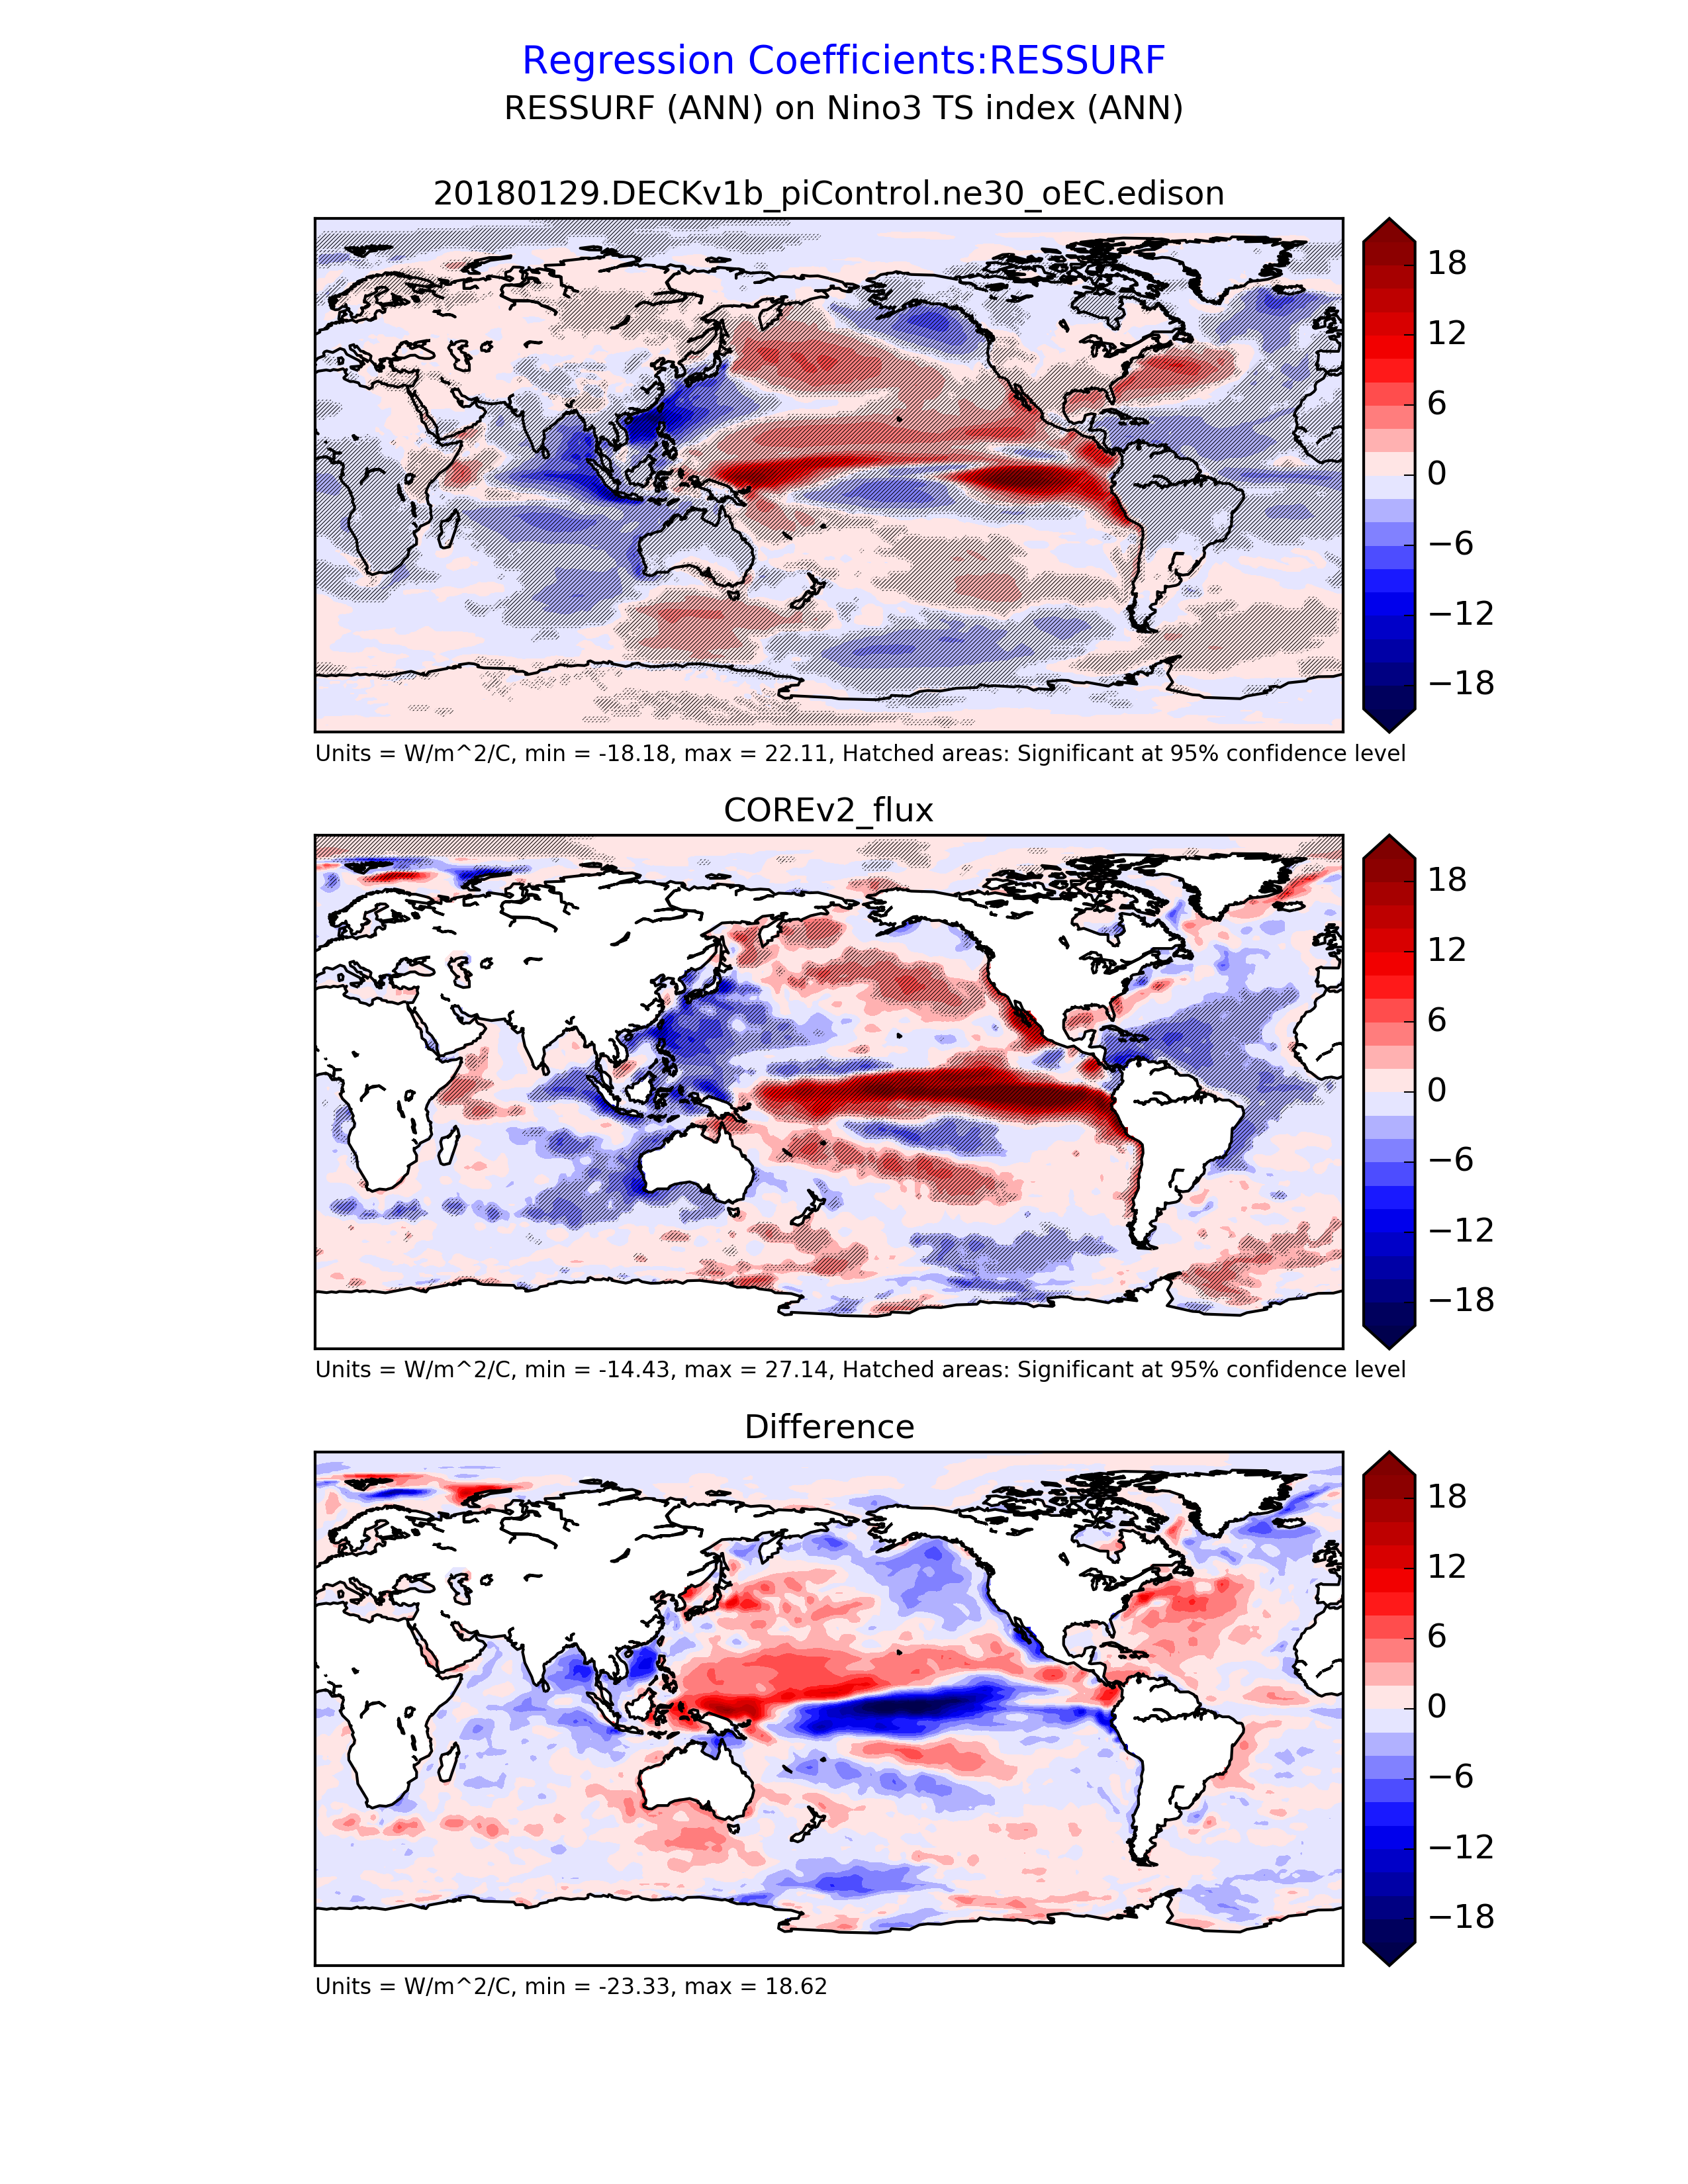
Regression on Nino3 Index
| Precipitation (COREv2)
| DJF
| JJA
| ANN
|
| PRECT
| Precipitation Rate
| plot
| plot
| plot
|
|
| Temperature (NCEP2)
| DJF
| JJA
| ANN
|
| TS
| Surface Temperature
| plot
| plot
| plot
|
|
| Sea Level Pressure (NCEP2_surface)
| DJF
| JJA
| ANN
|
| PSL
| Sea Level Pressure
| plot
| plot
| plot
|
|
| Wind Stress (COREv2_flux)
| DJF
| JJA
| ANN
|
| TAUX
| Ocean Zonal Wind Stress
| plot
| plot
| plot
|
|
| Surface Heat Flux (COREv2_flux)
| DJF
| JJA
| ANN
|
| LHFLX
| Latent Heat Flux
| plot
| plot
| plot
|
| SHFLX
| Sensible Heat Flux
| plot
| plot
| plot
|
| FLNS
| Longwave Heat Flux
| plot
| plot
| plot
|
| FSNS
| Shortwave Heat Flux
| plot
| plot
| plot
|
| RESSURF
| Surface Net Heat Flux
| plot
| plot
| plot
|
|
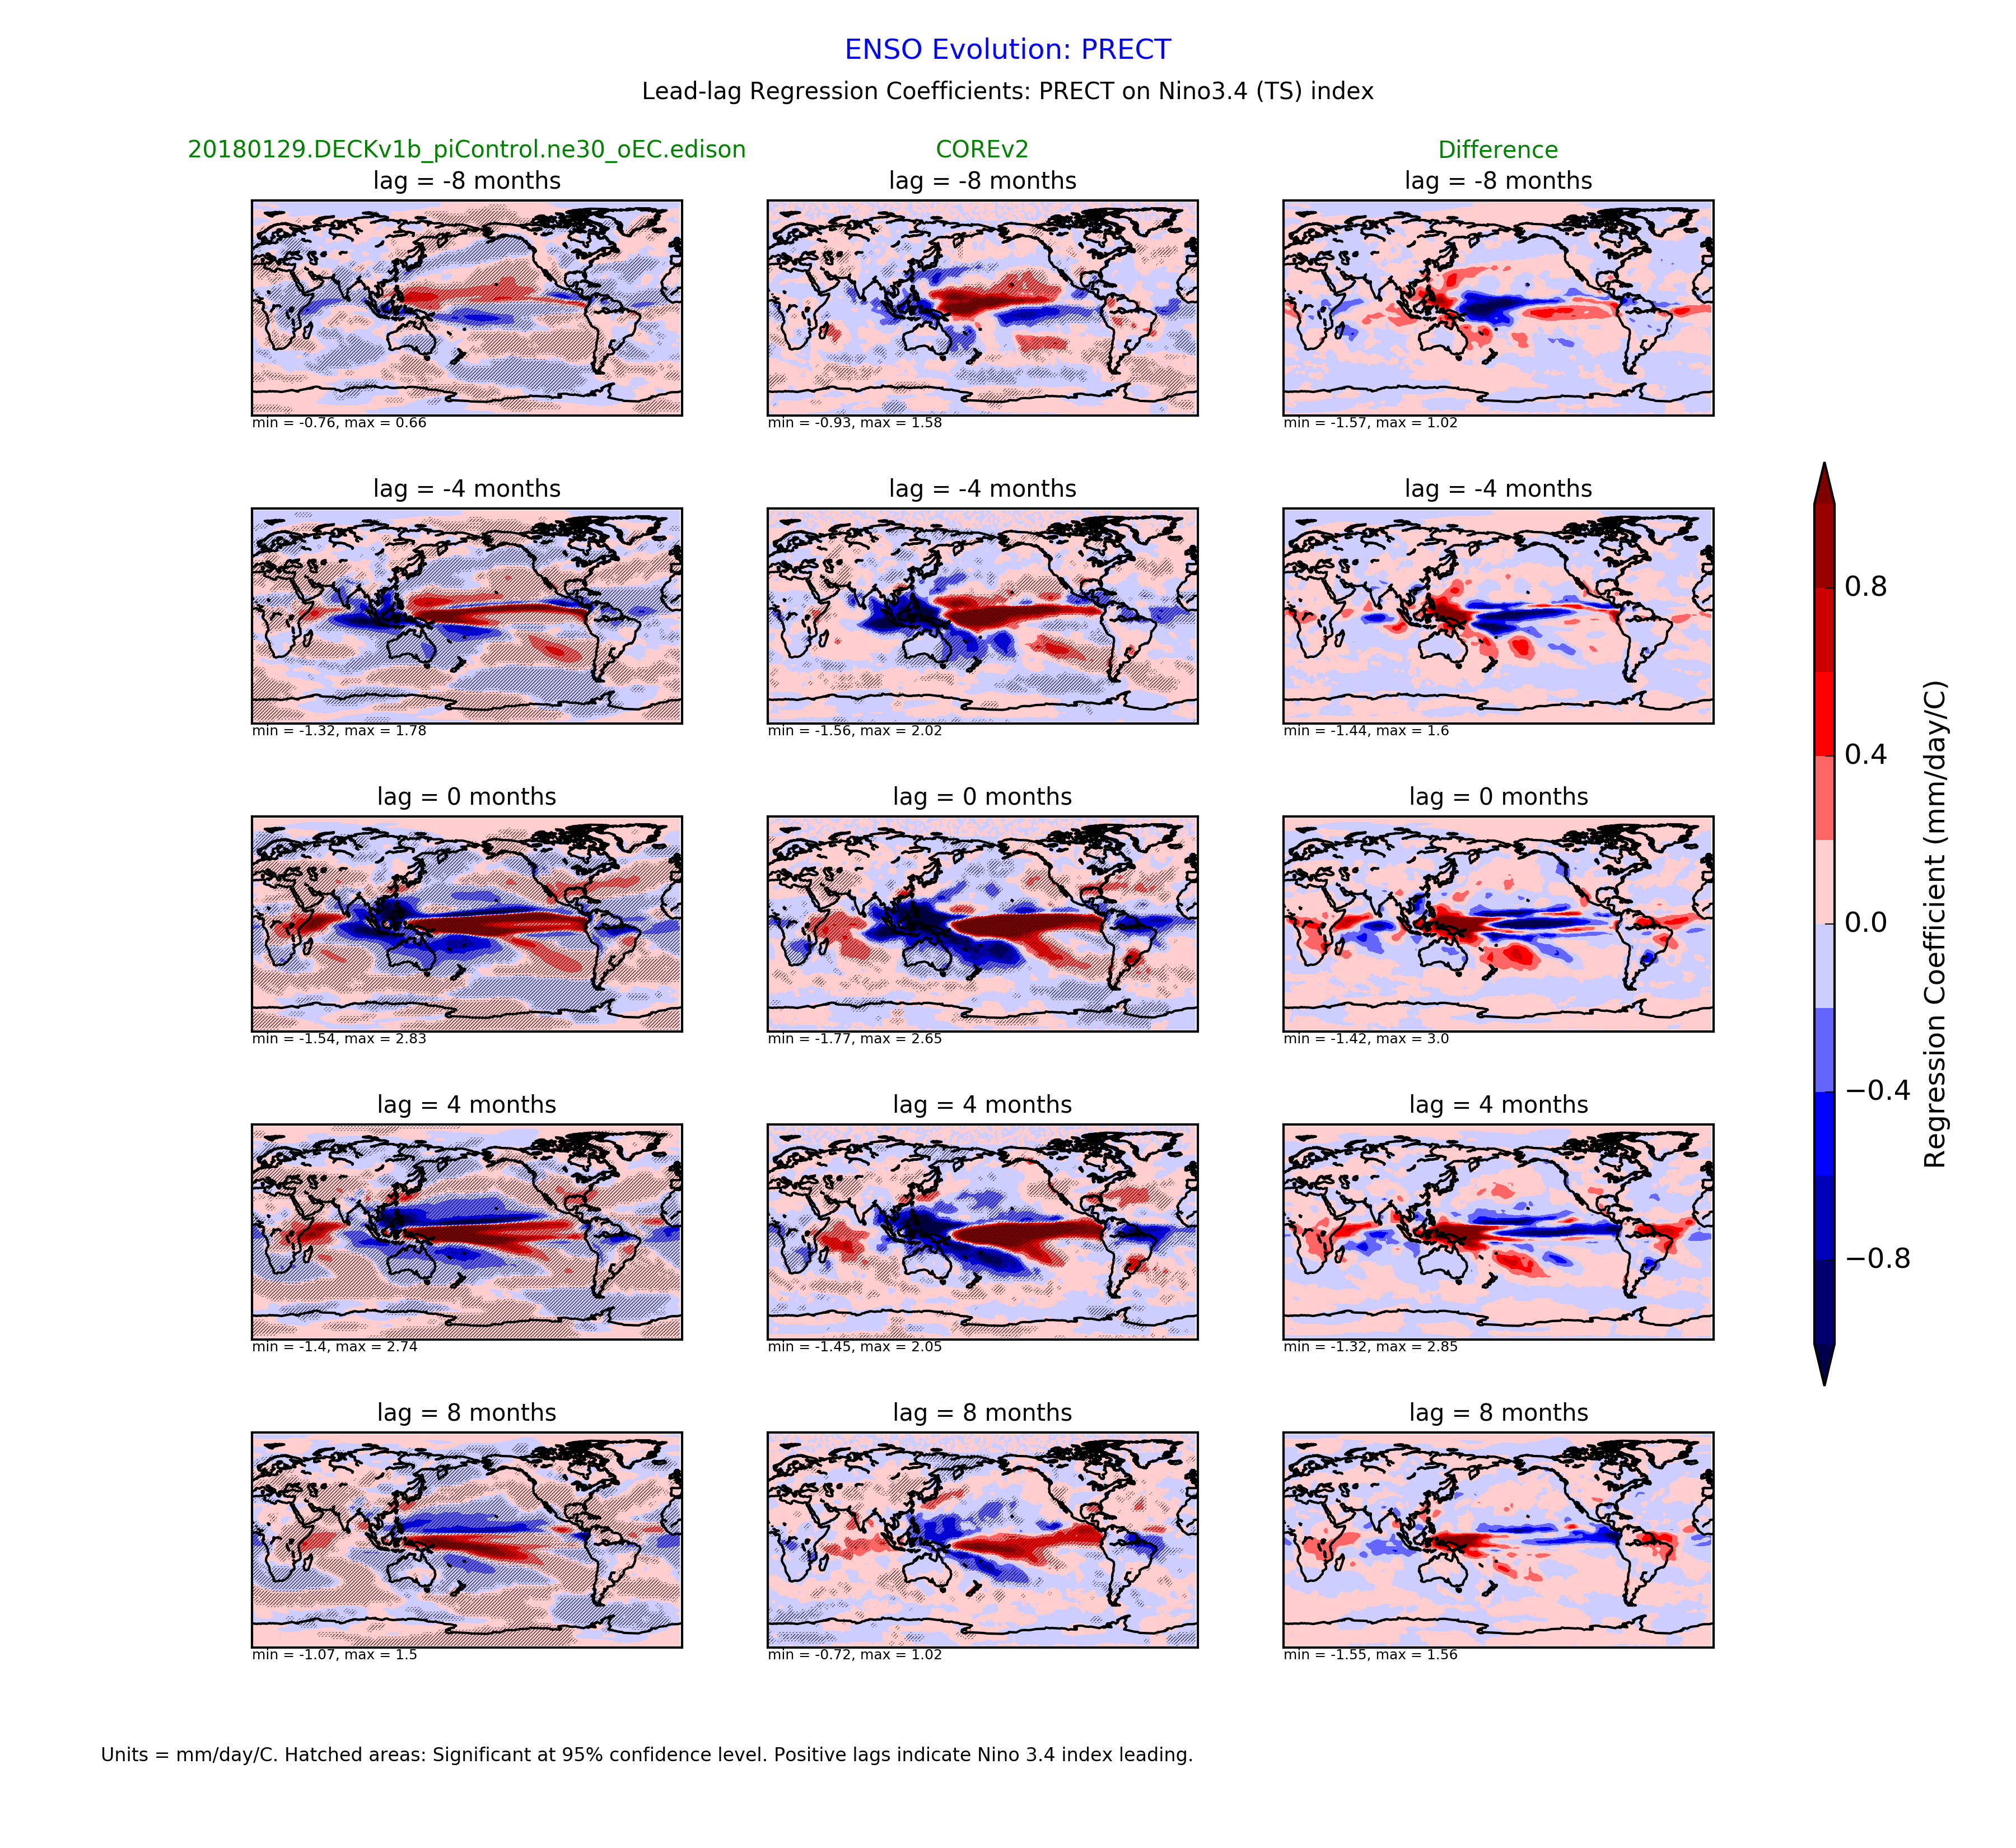
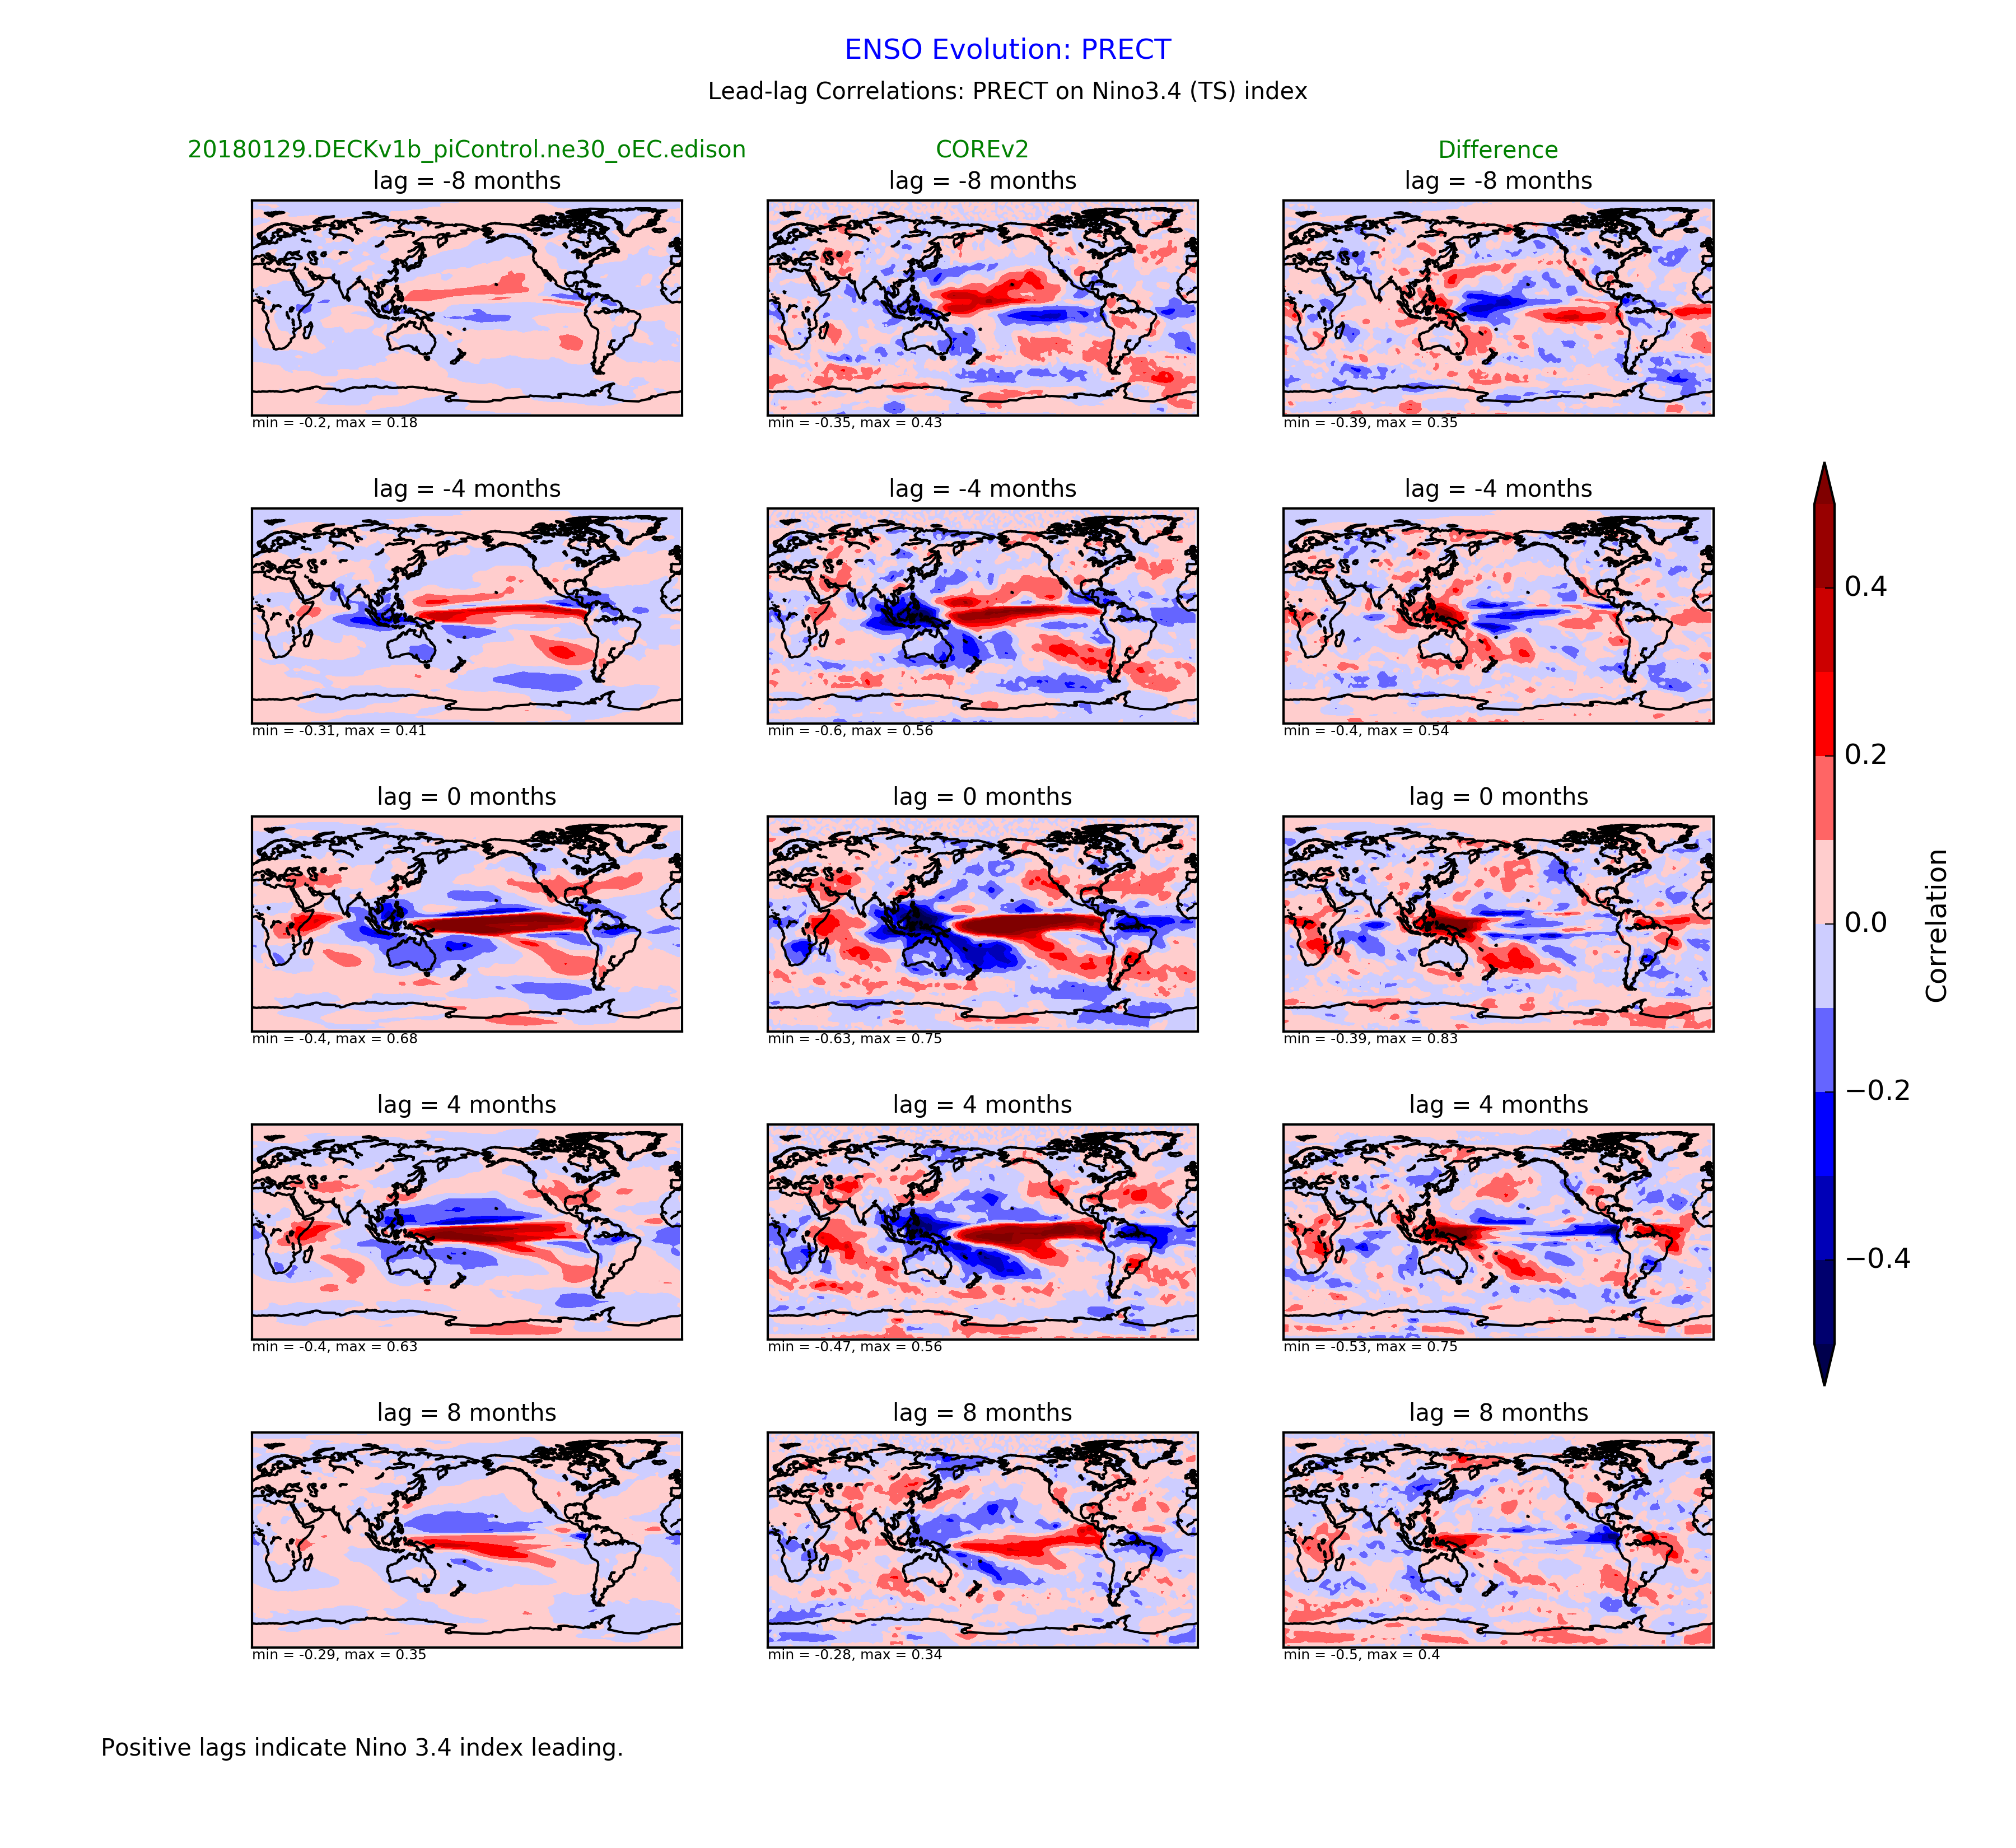
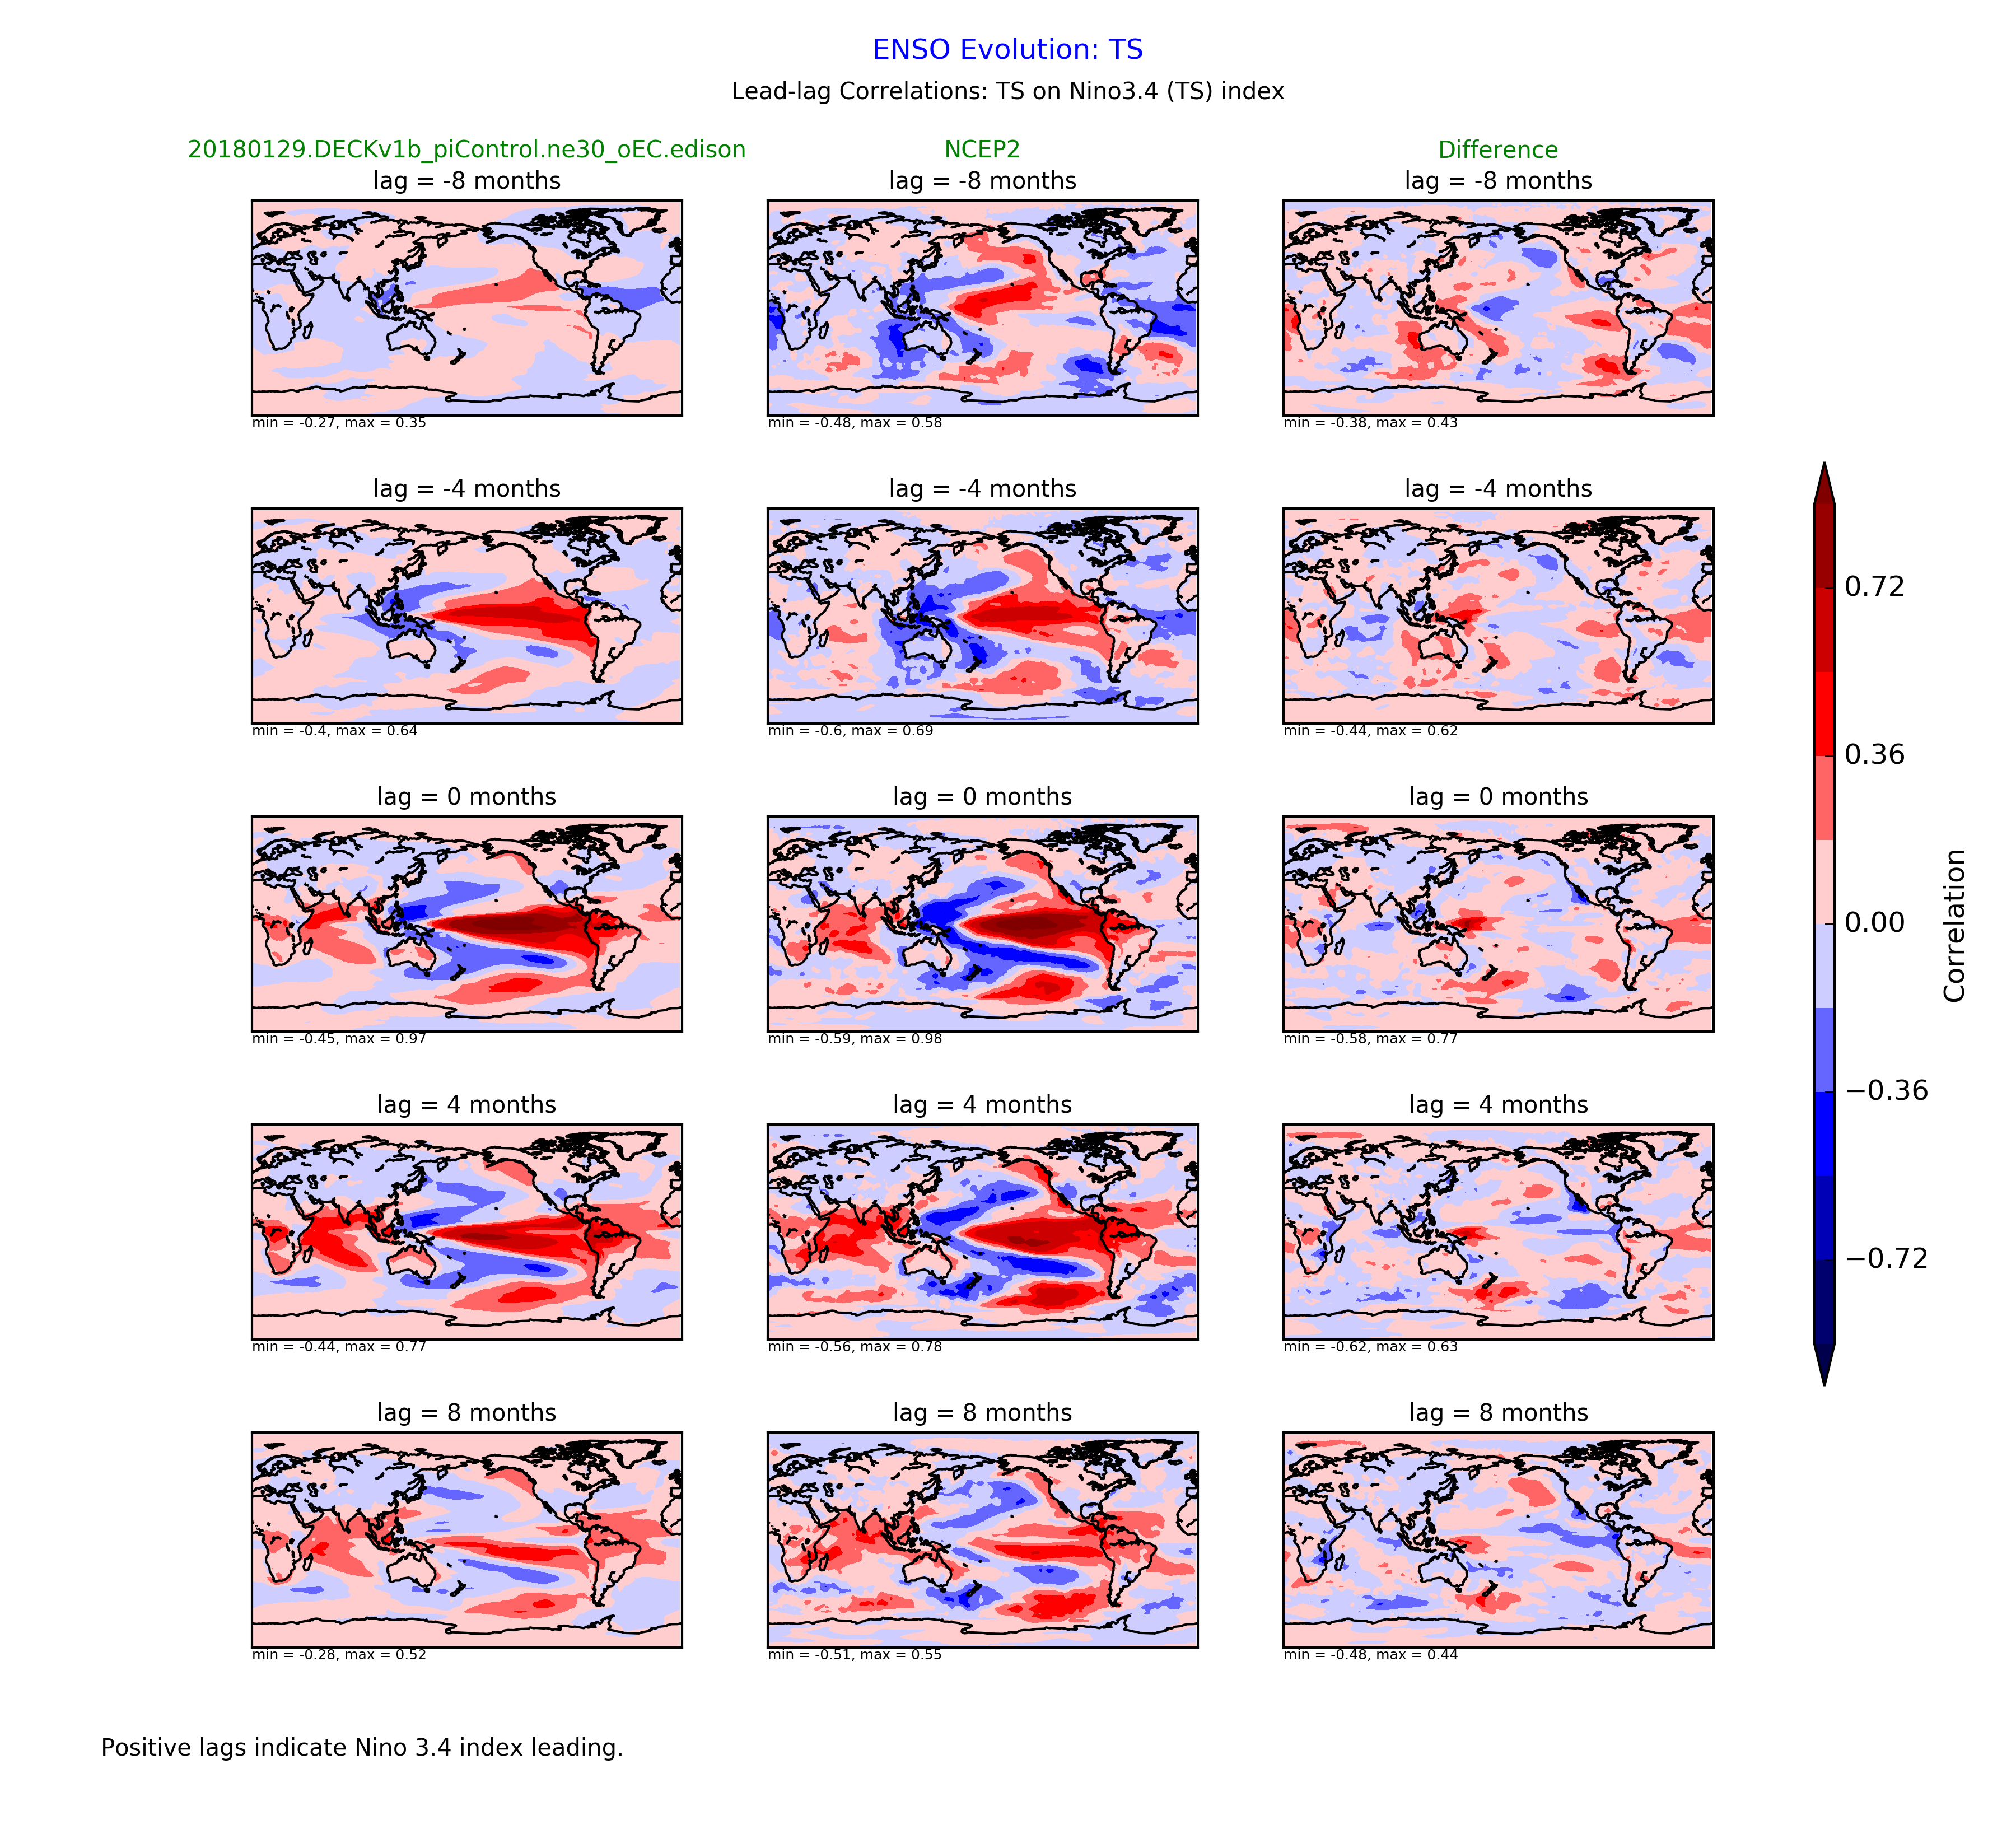
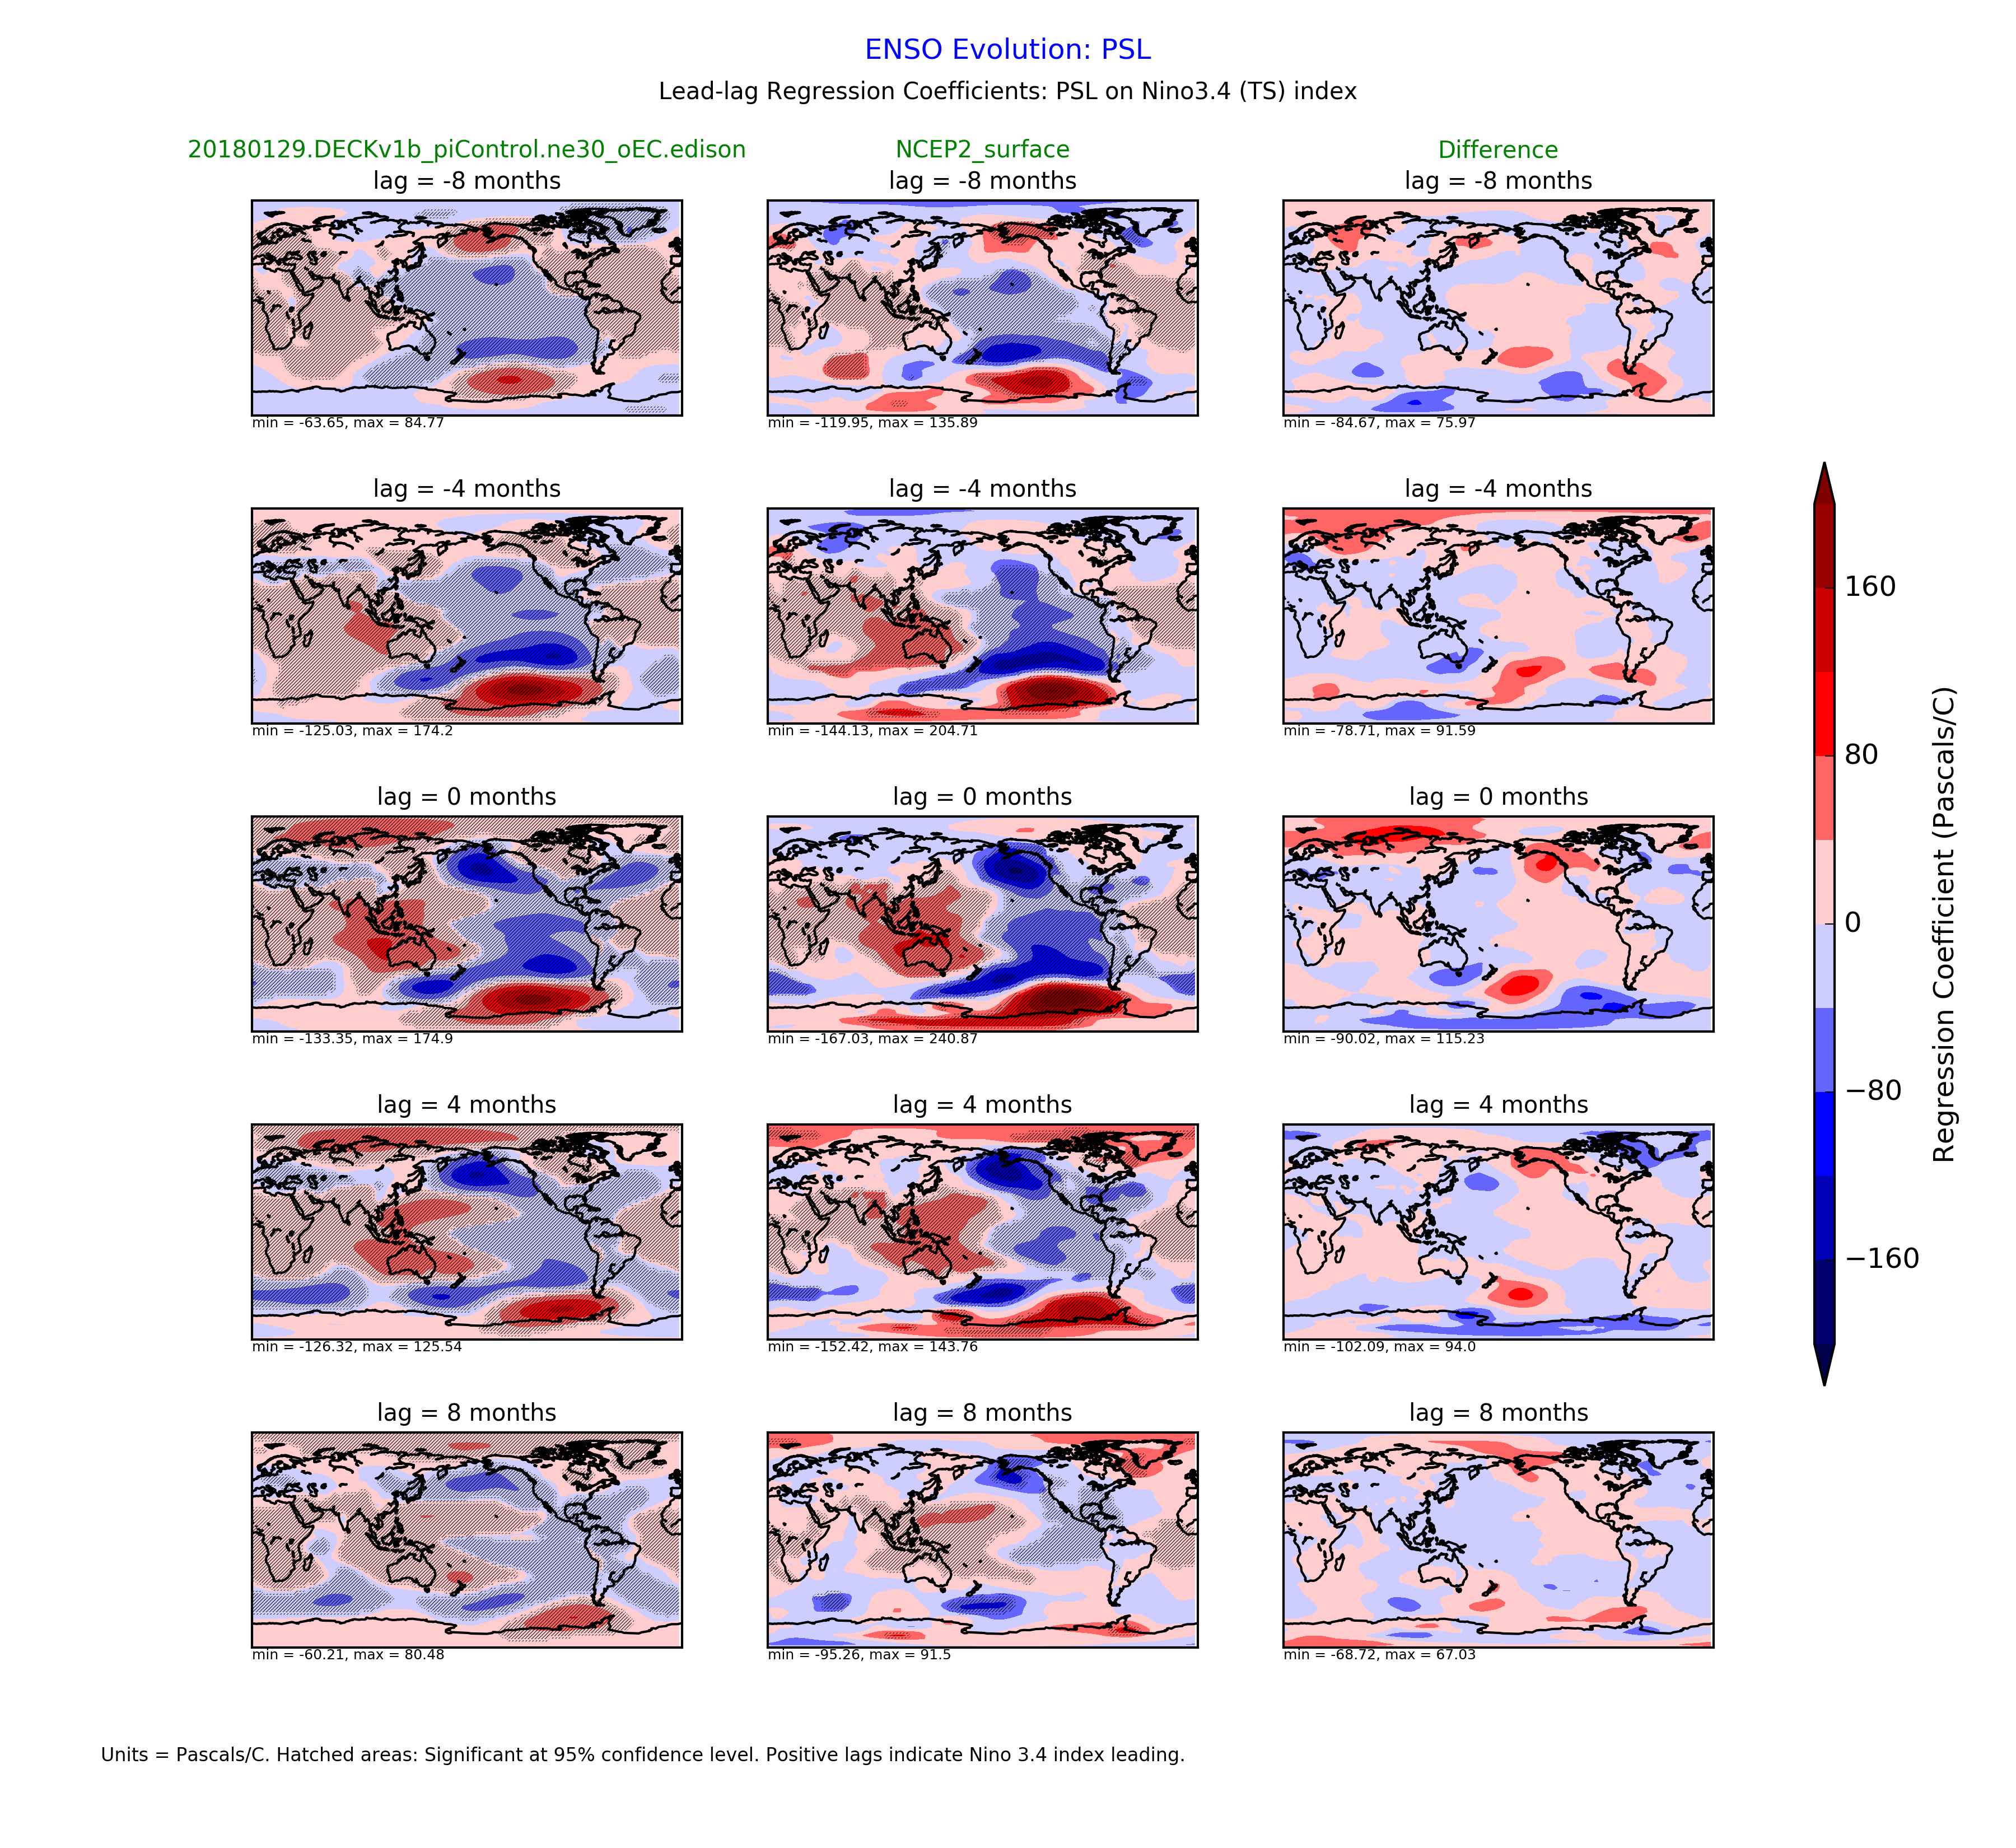
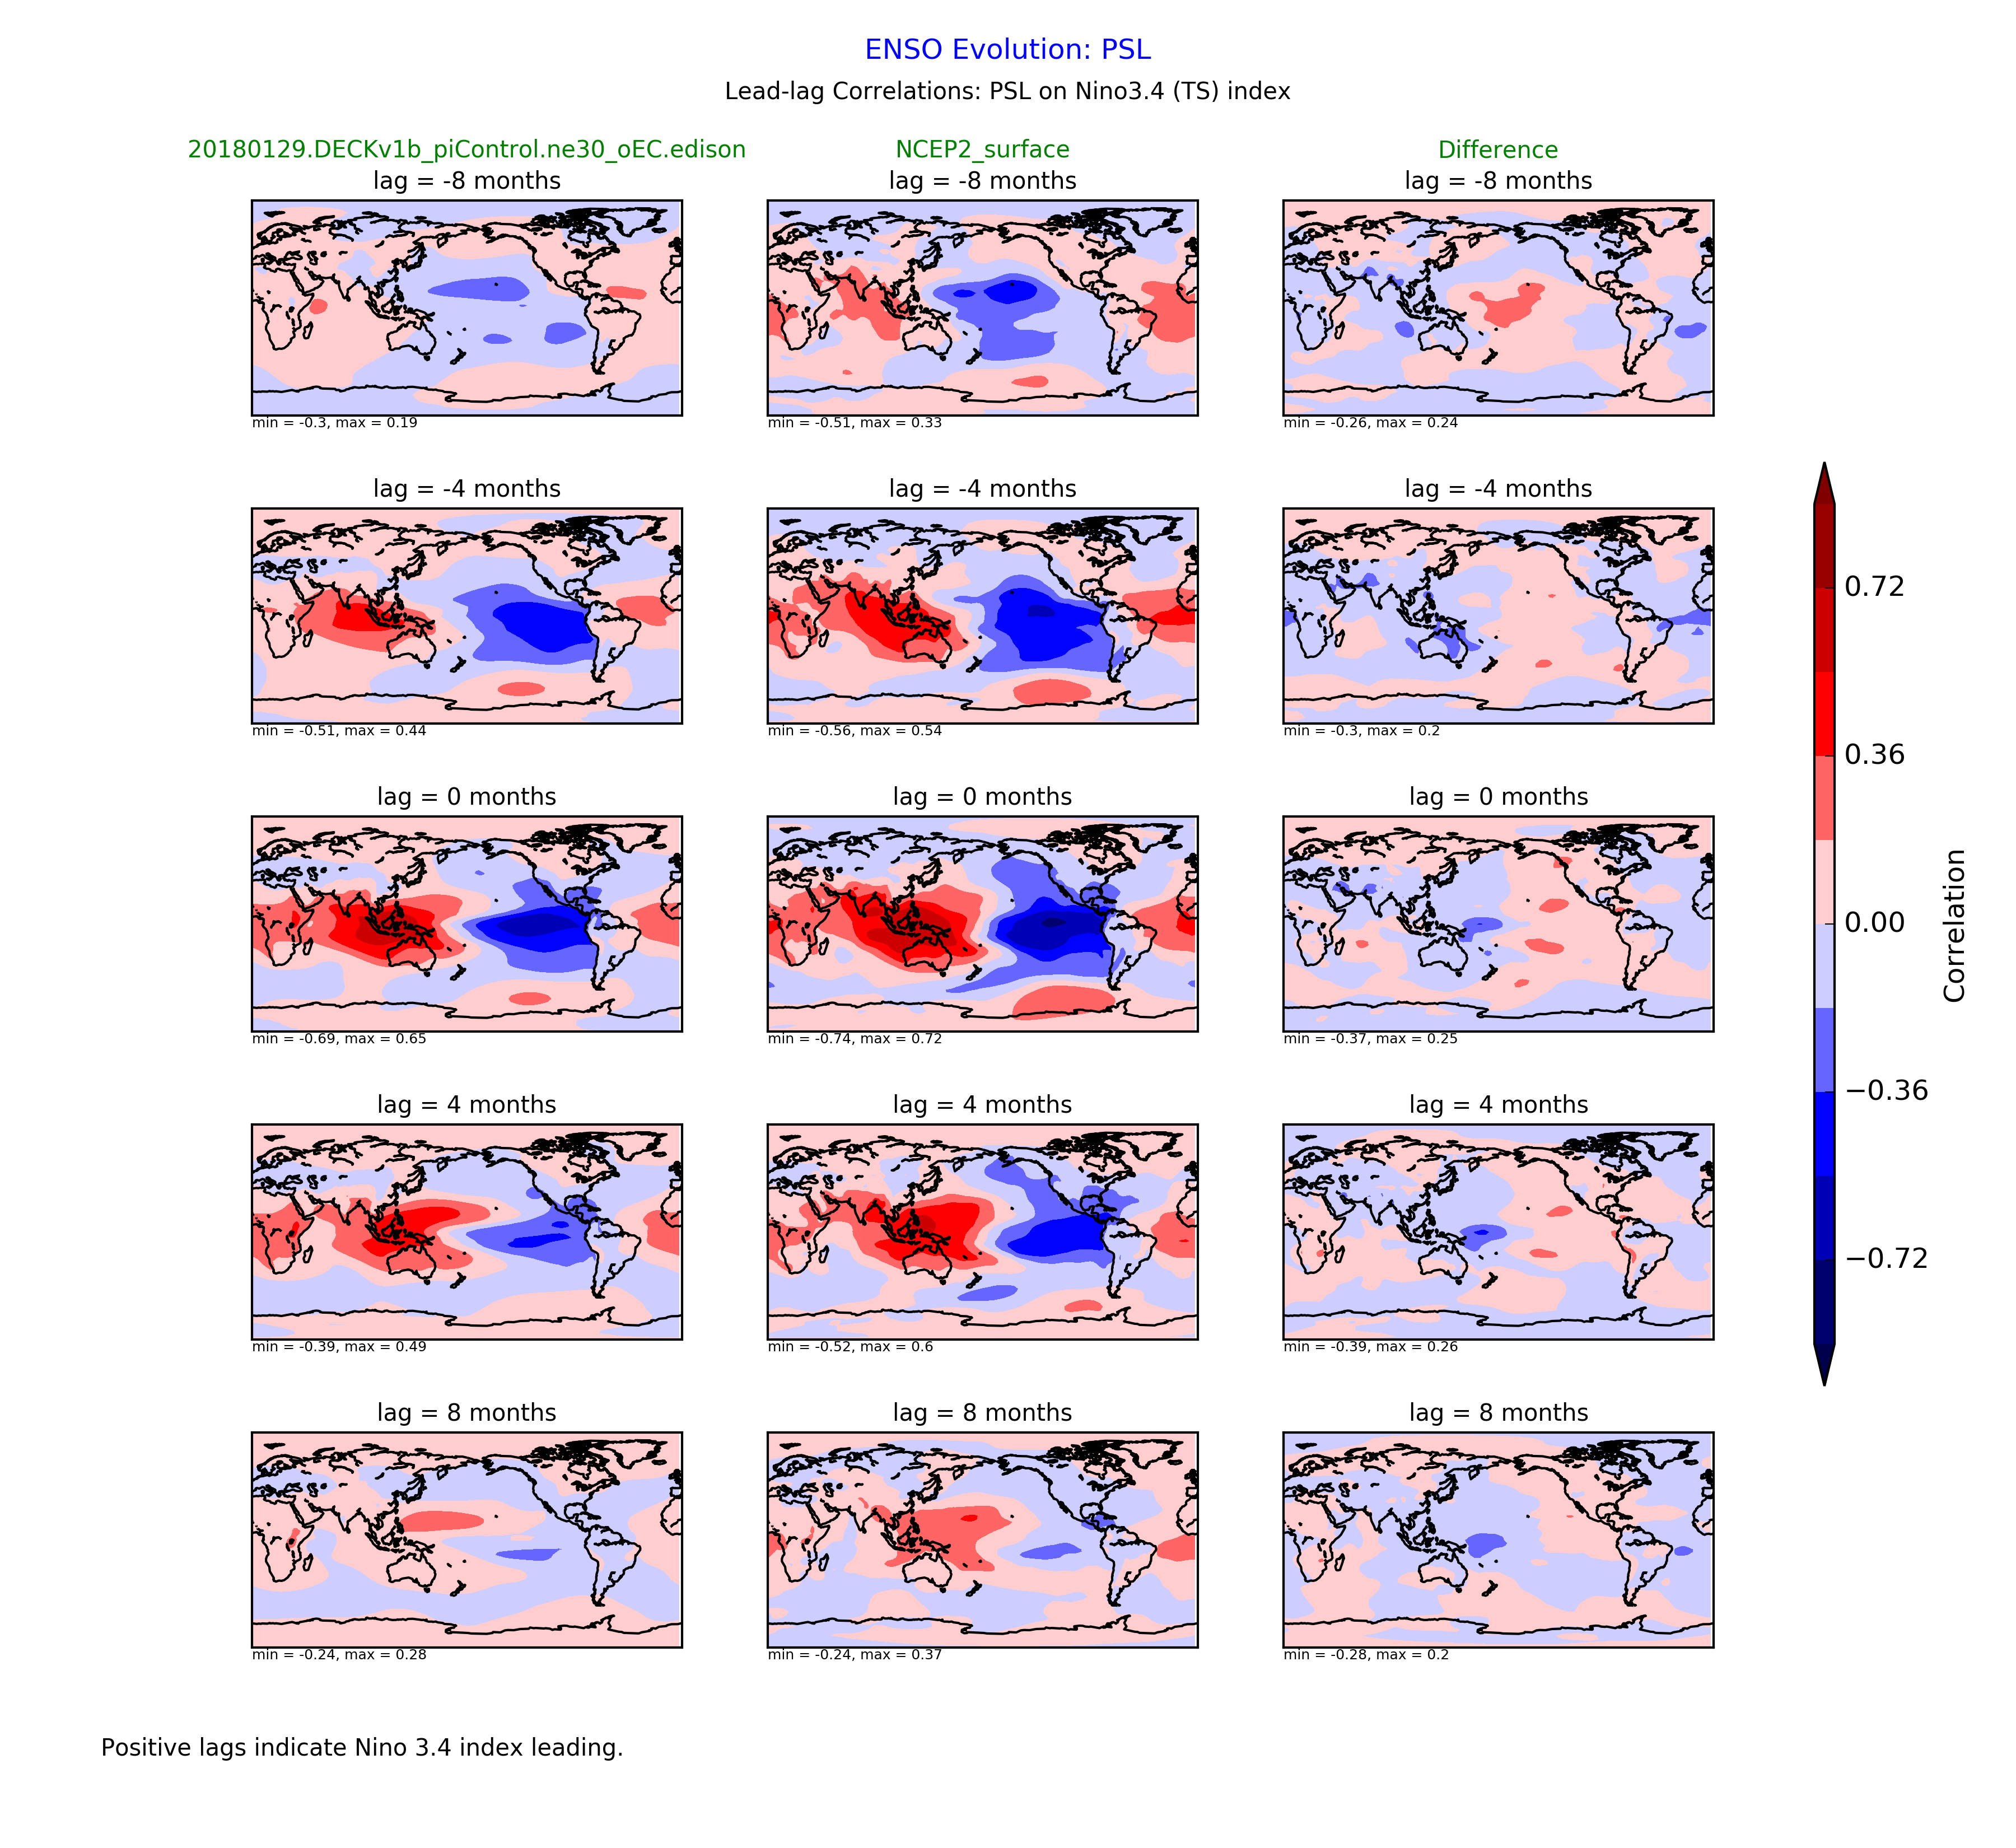
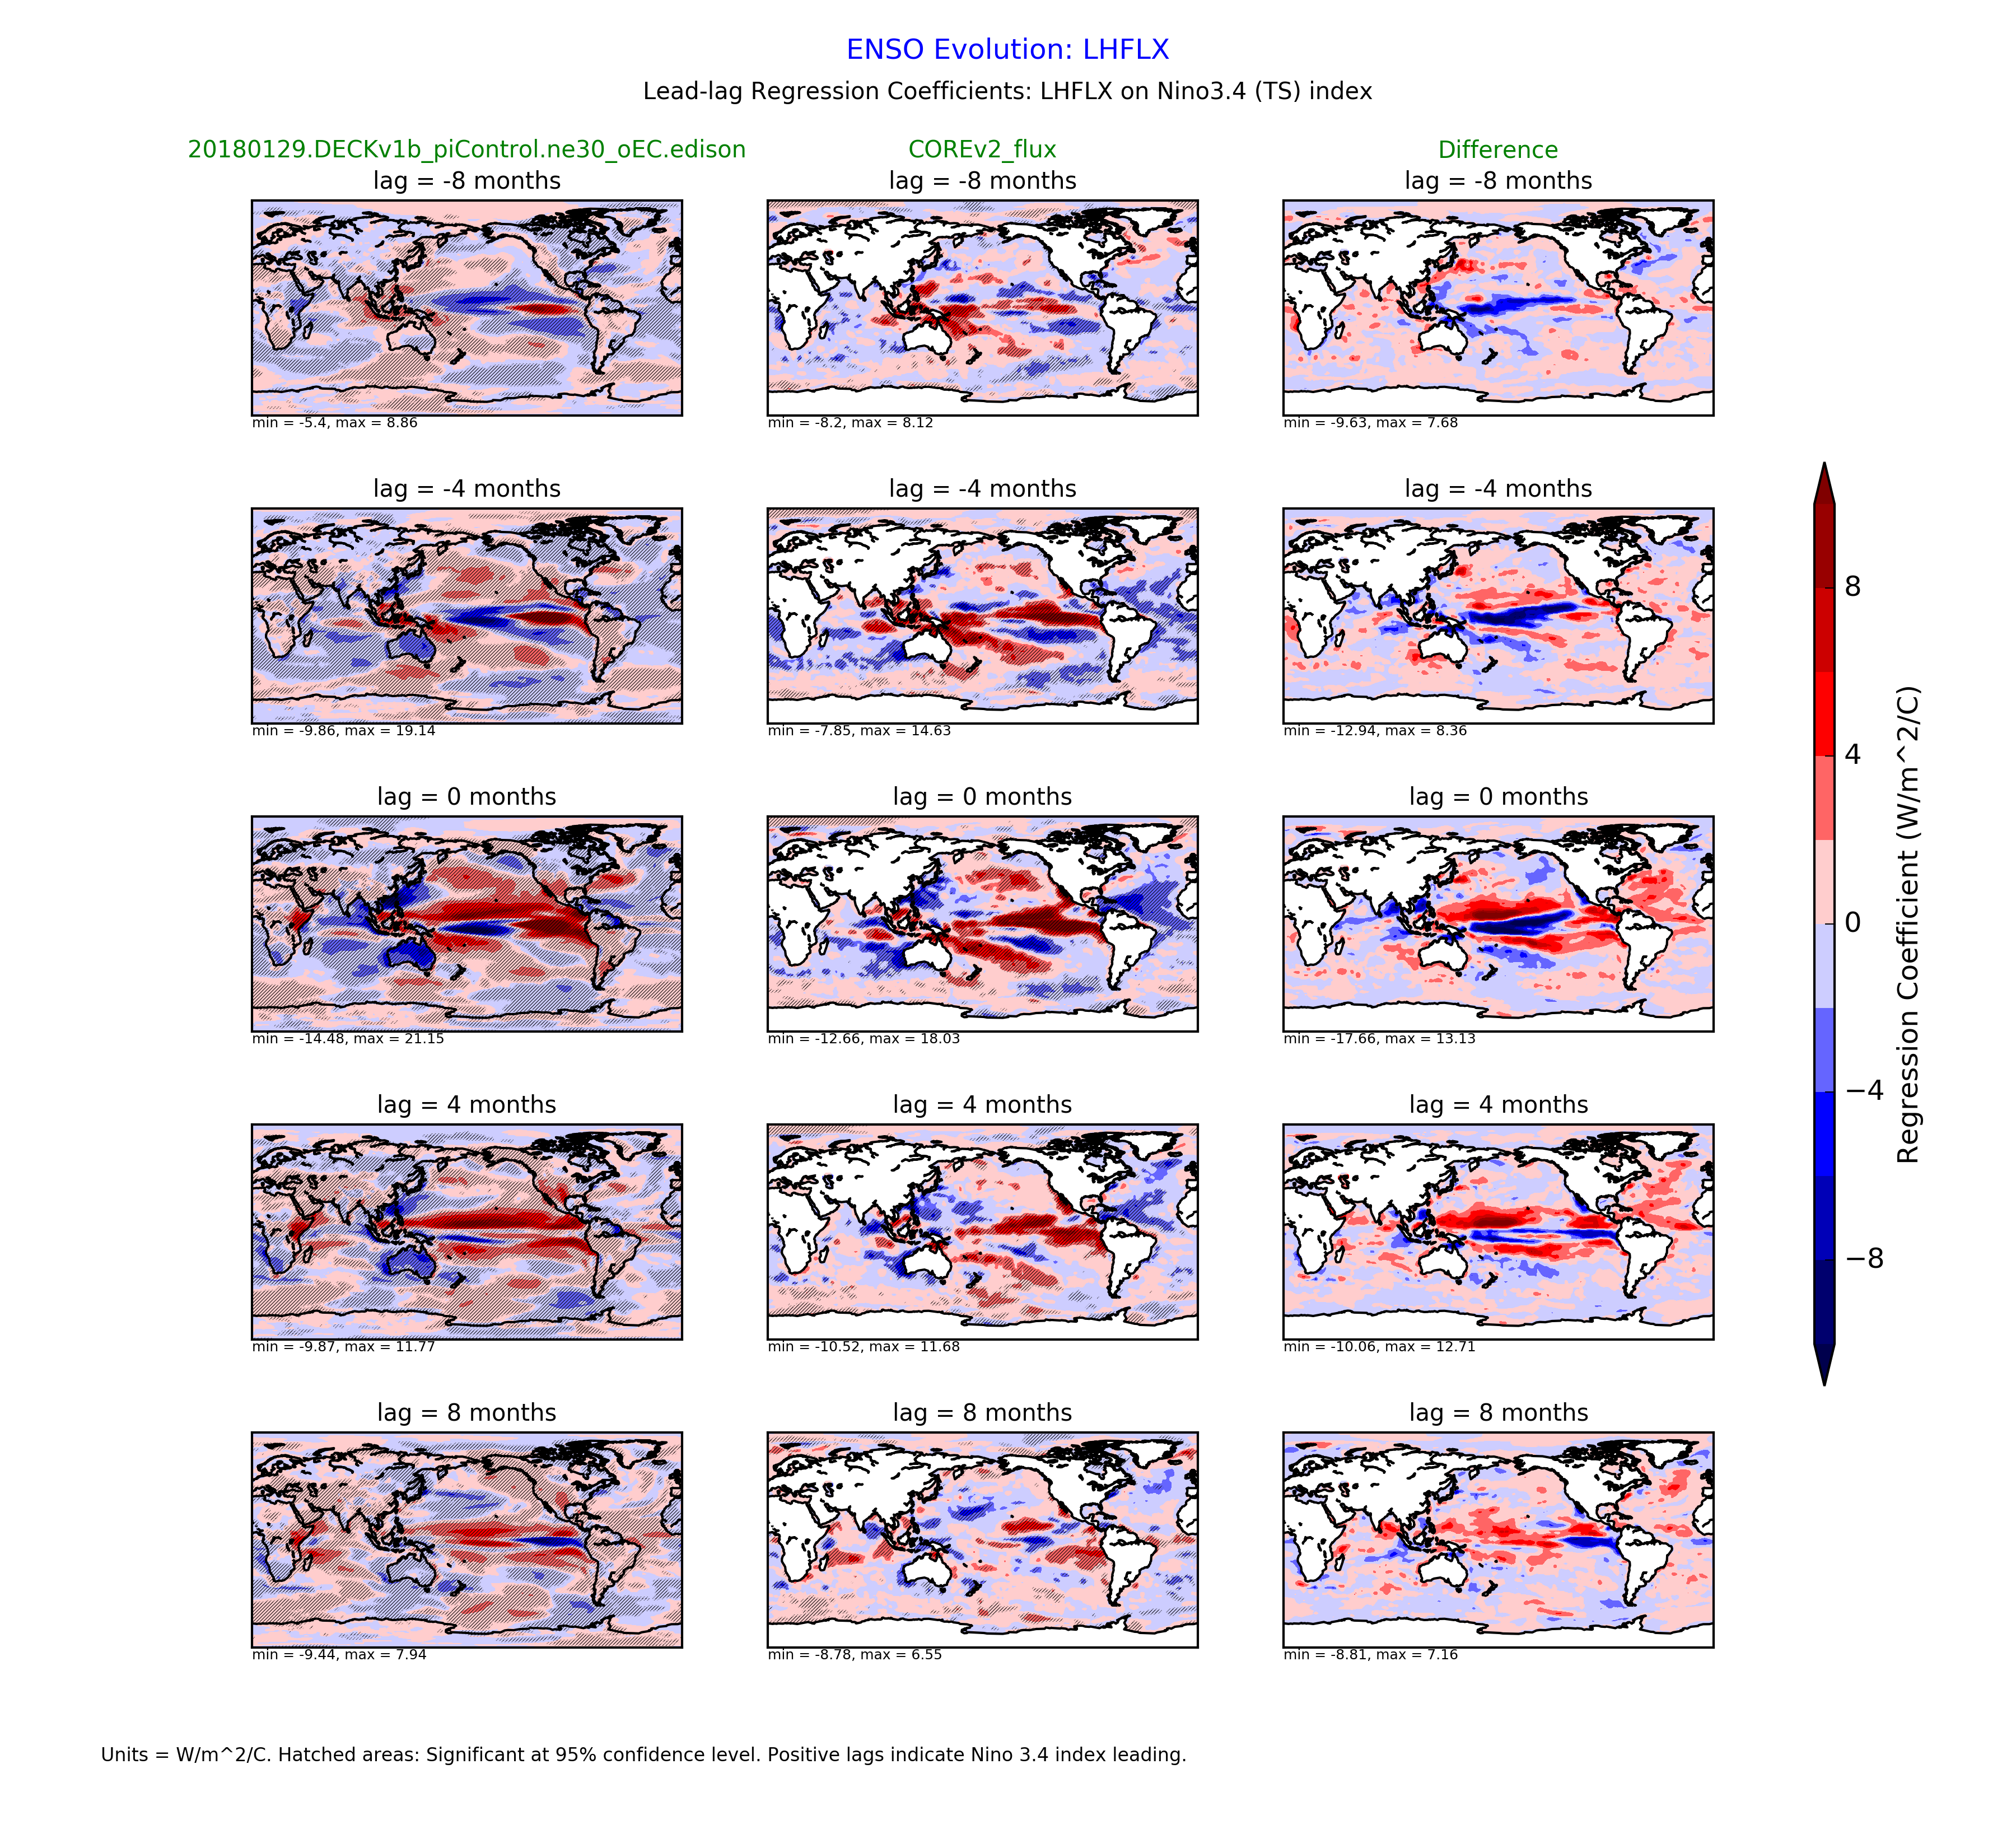
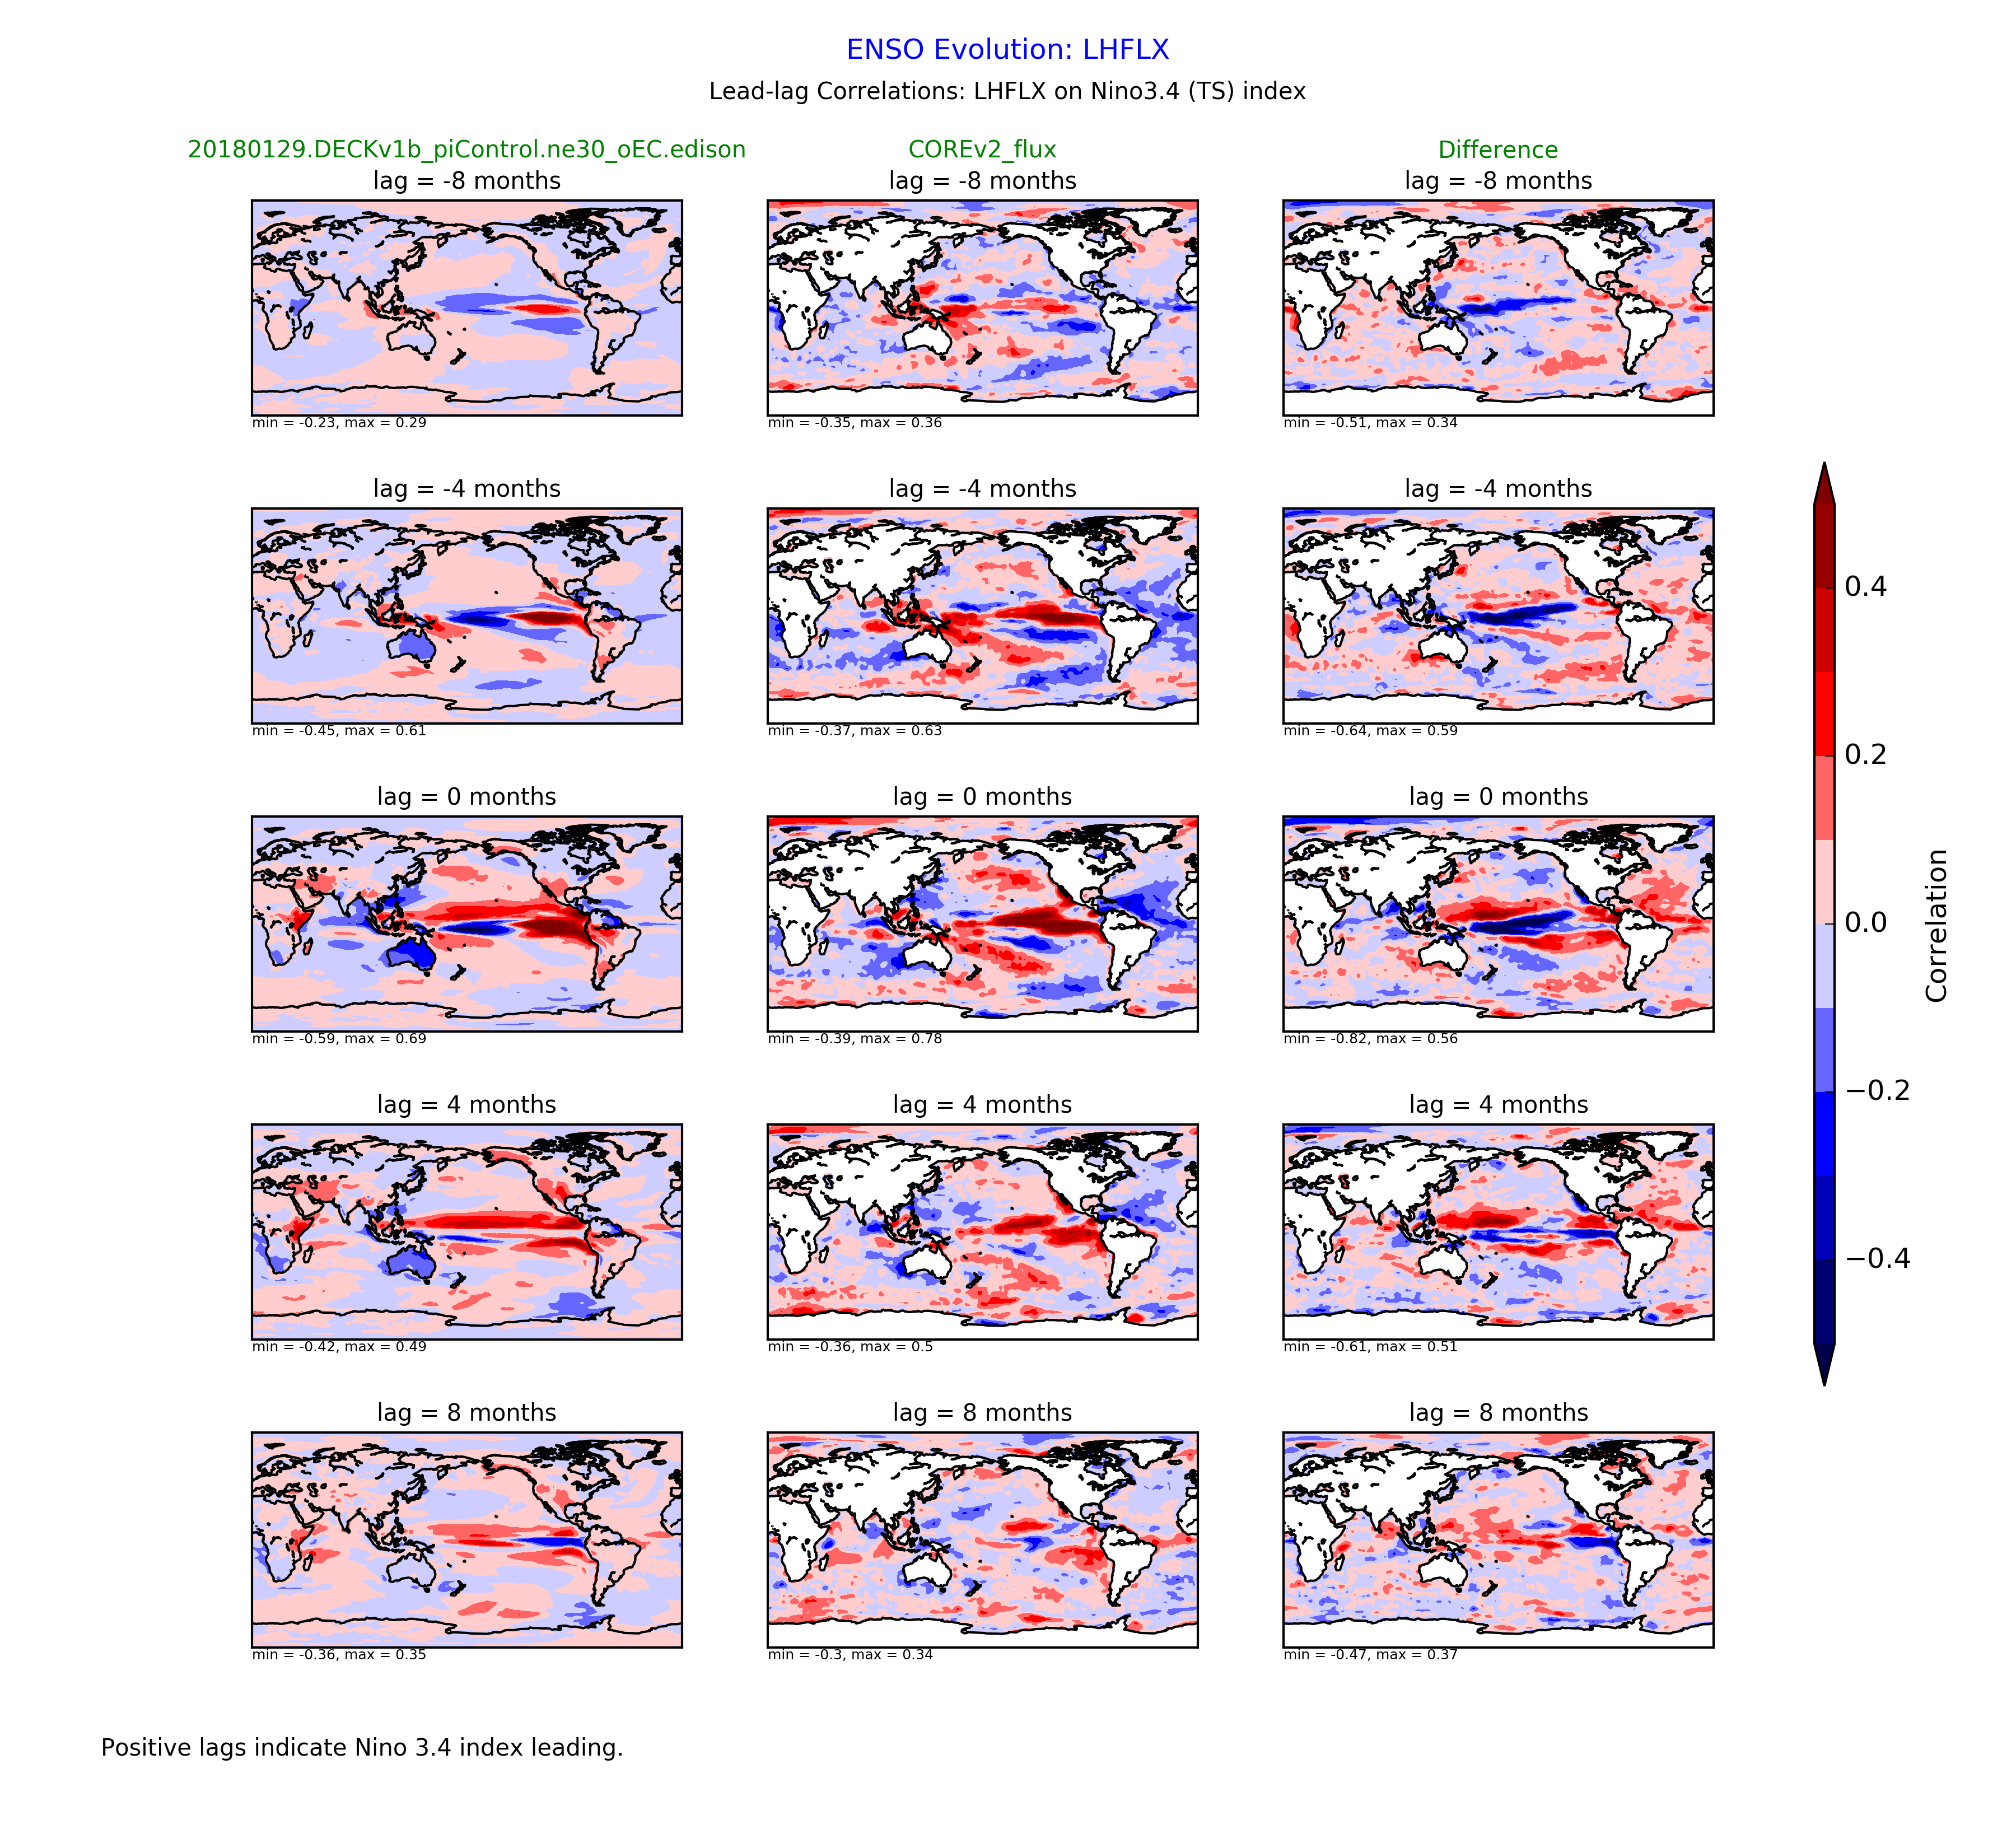
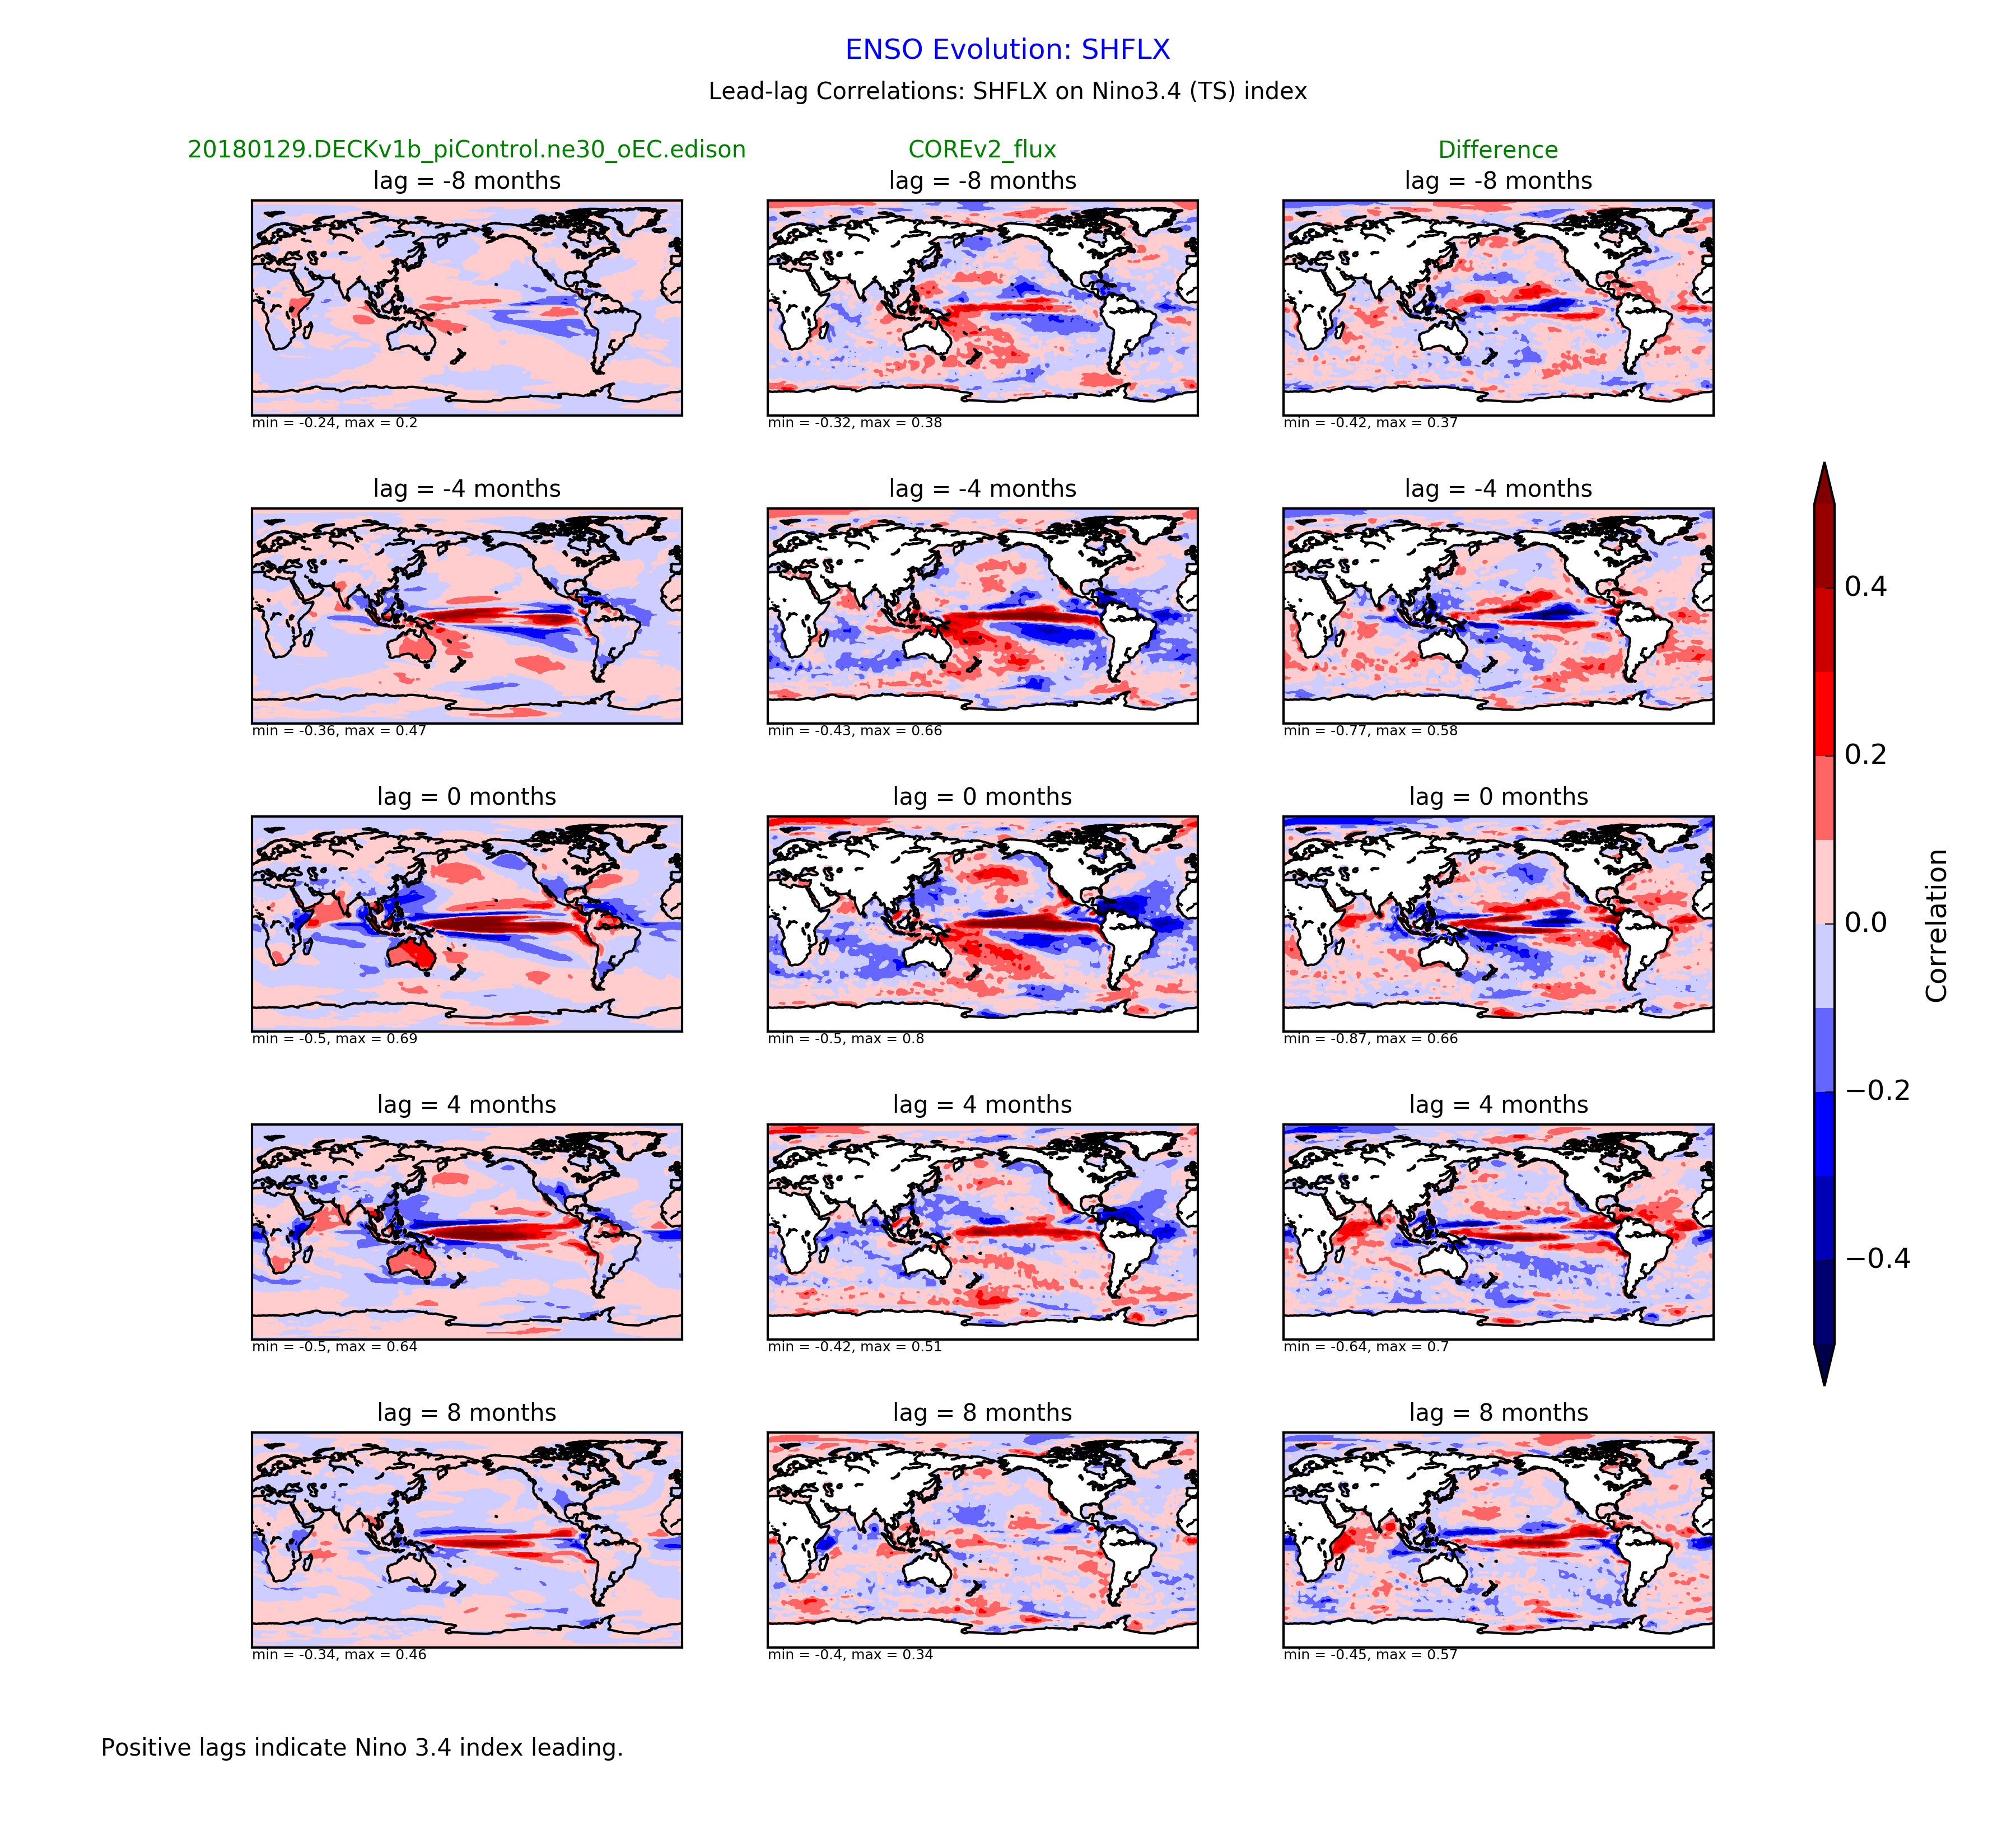
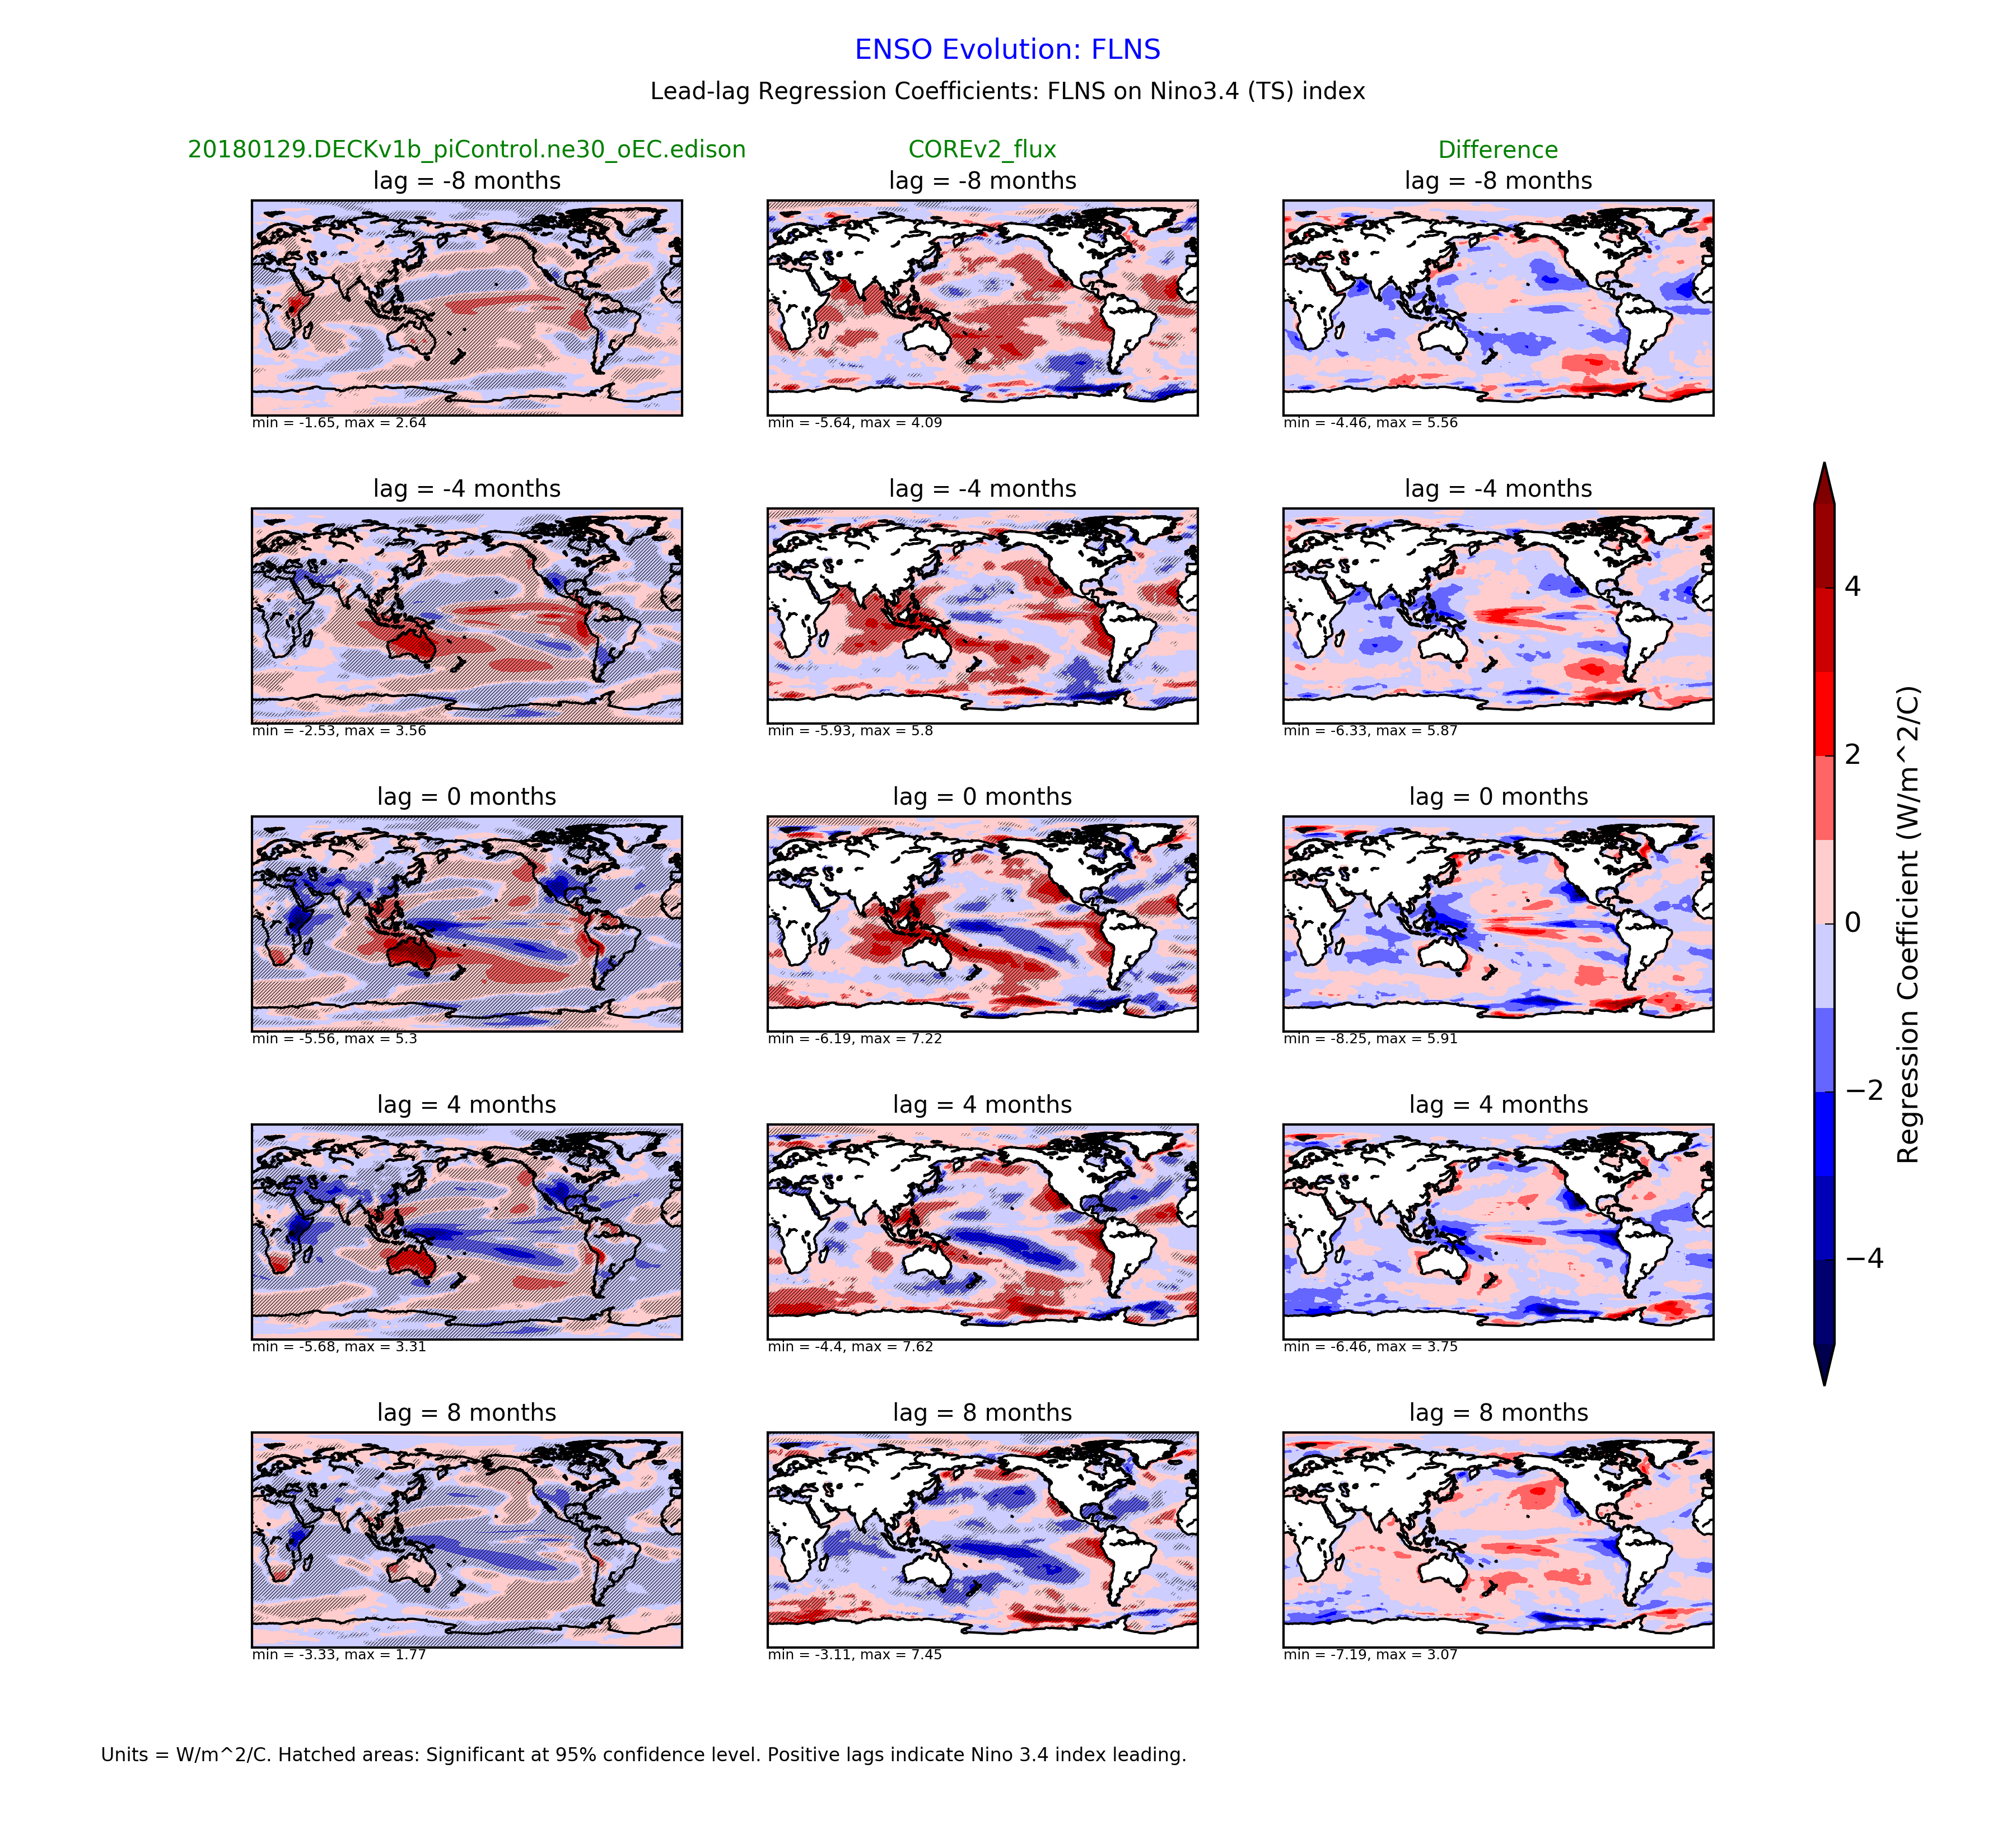
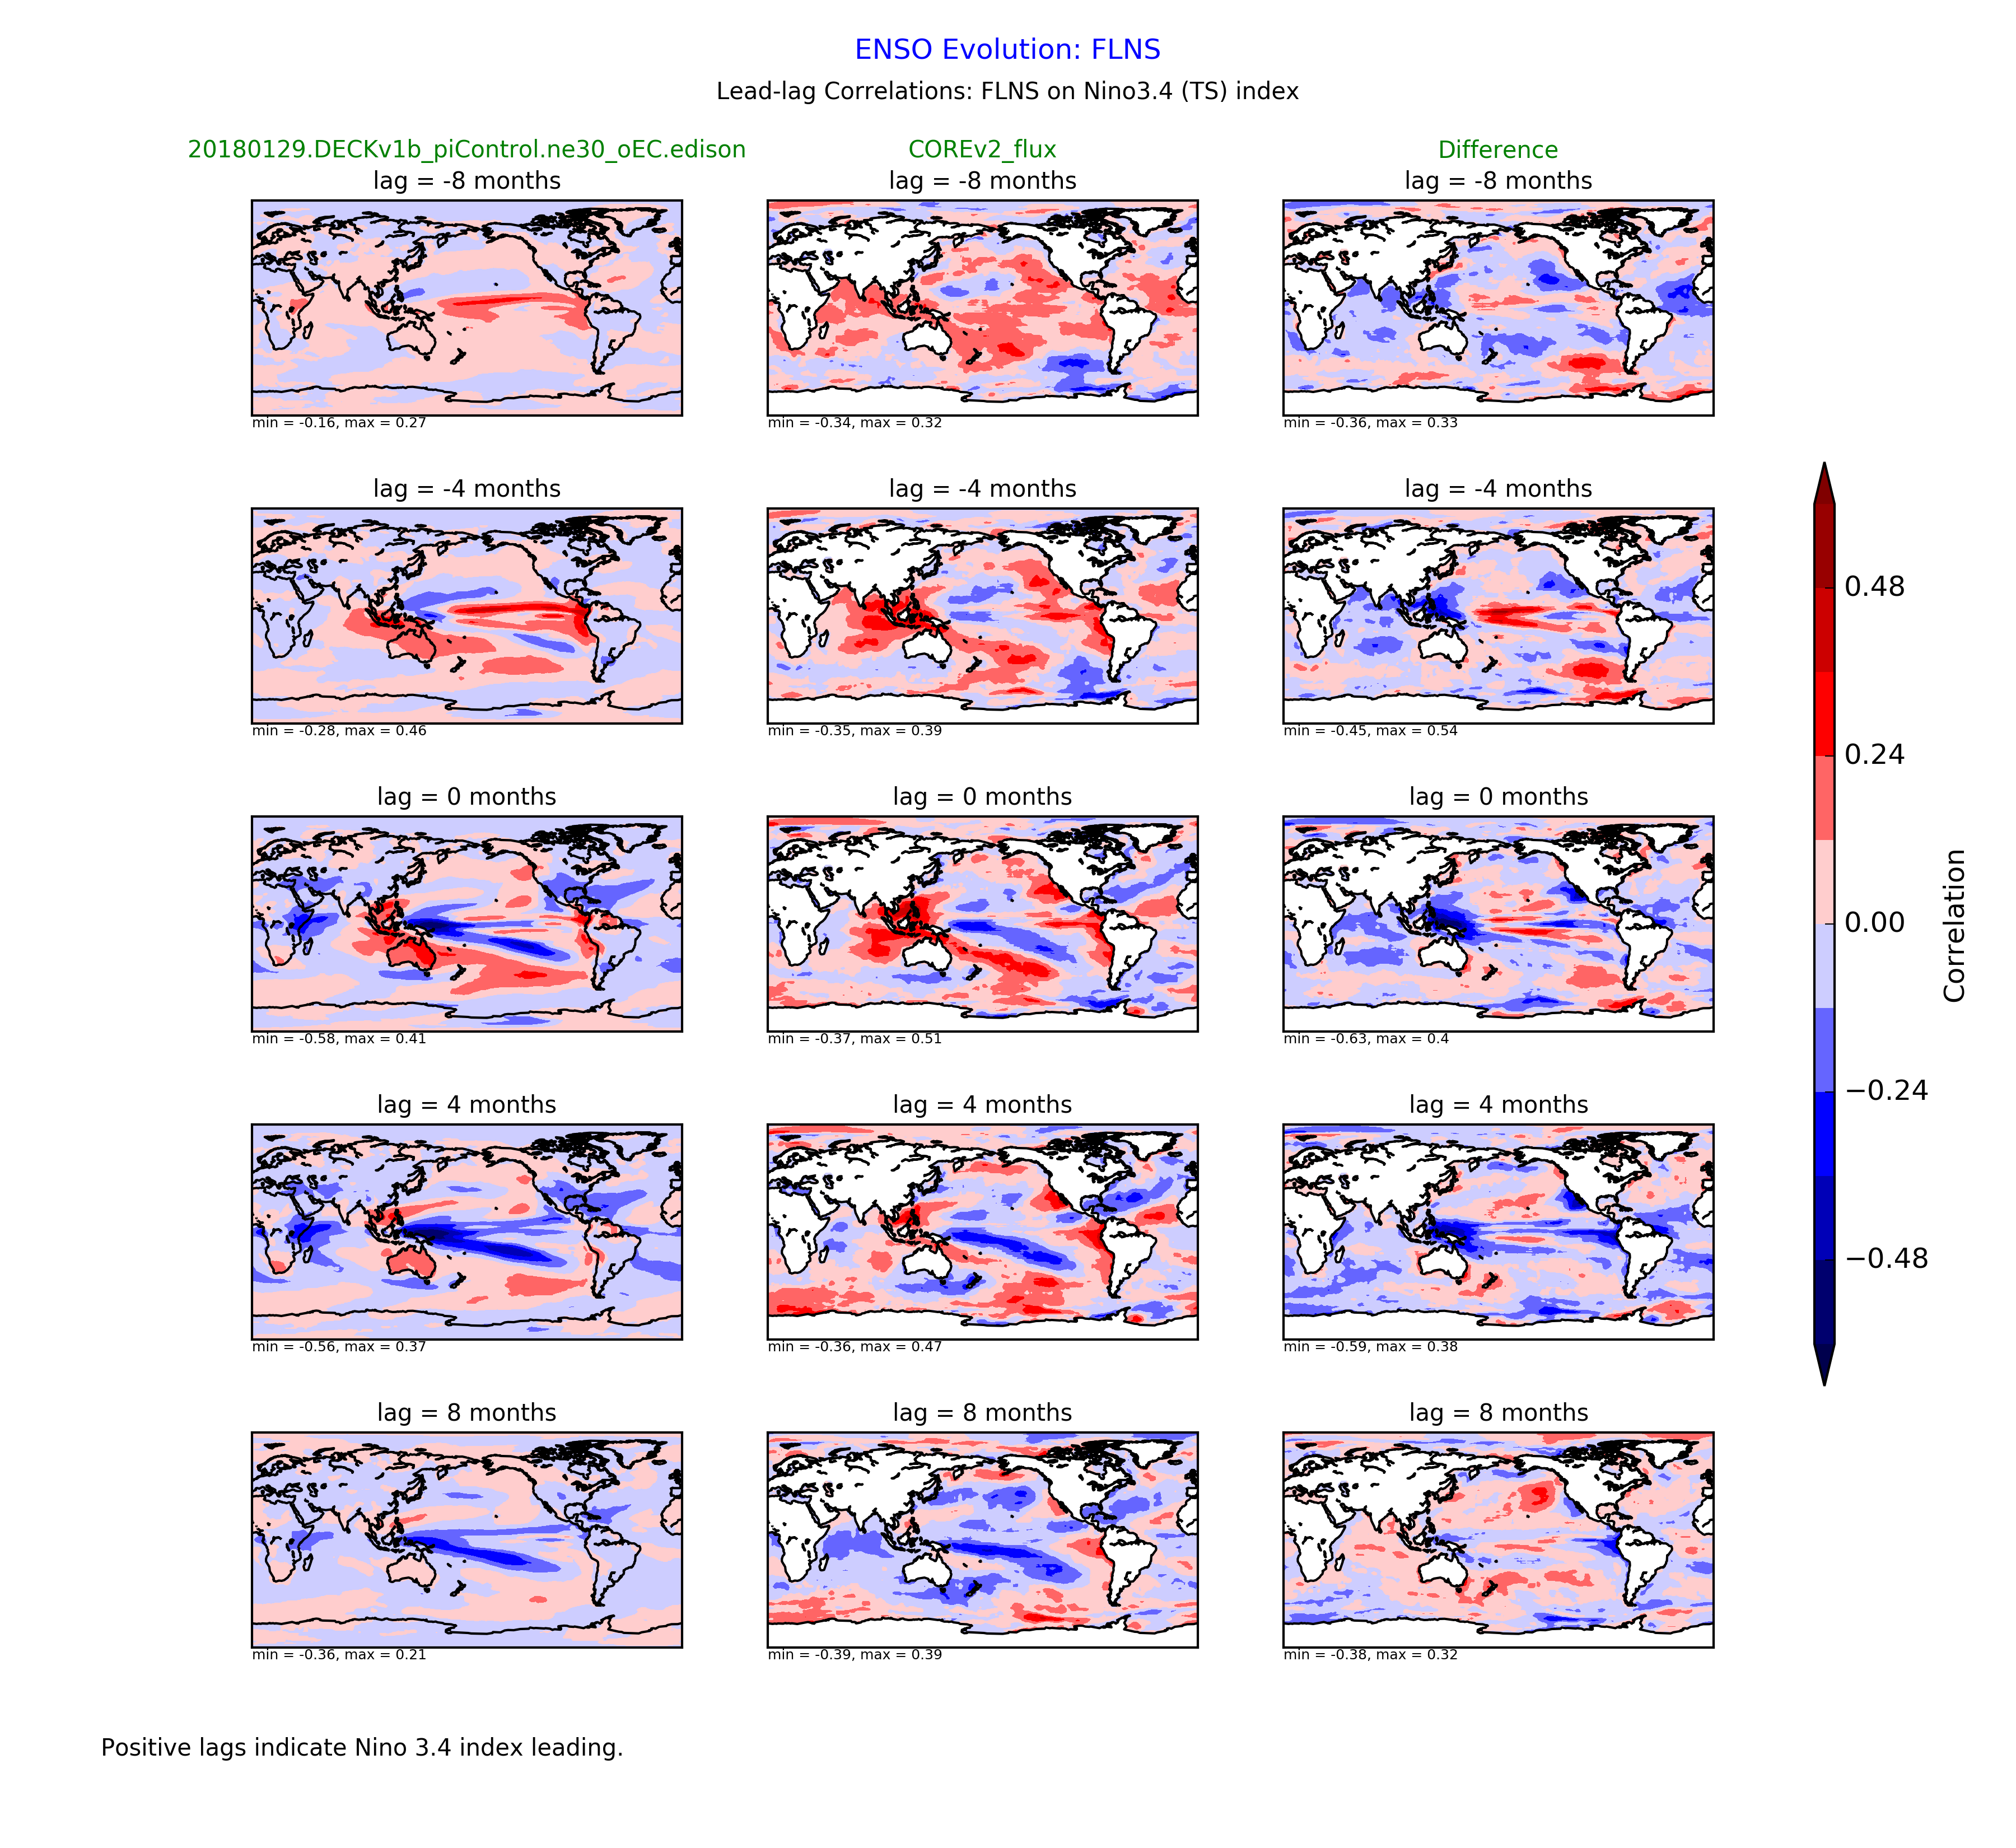
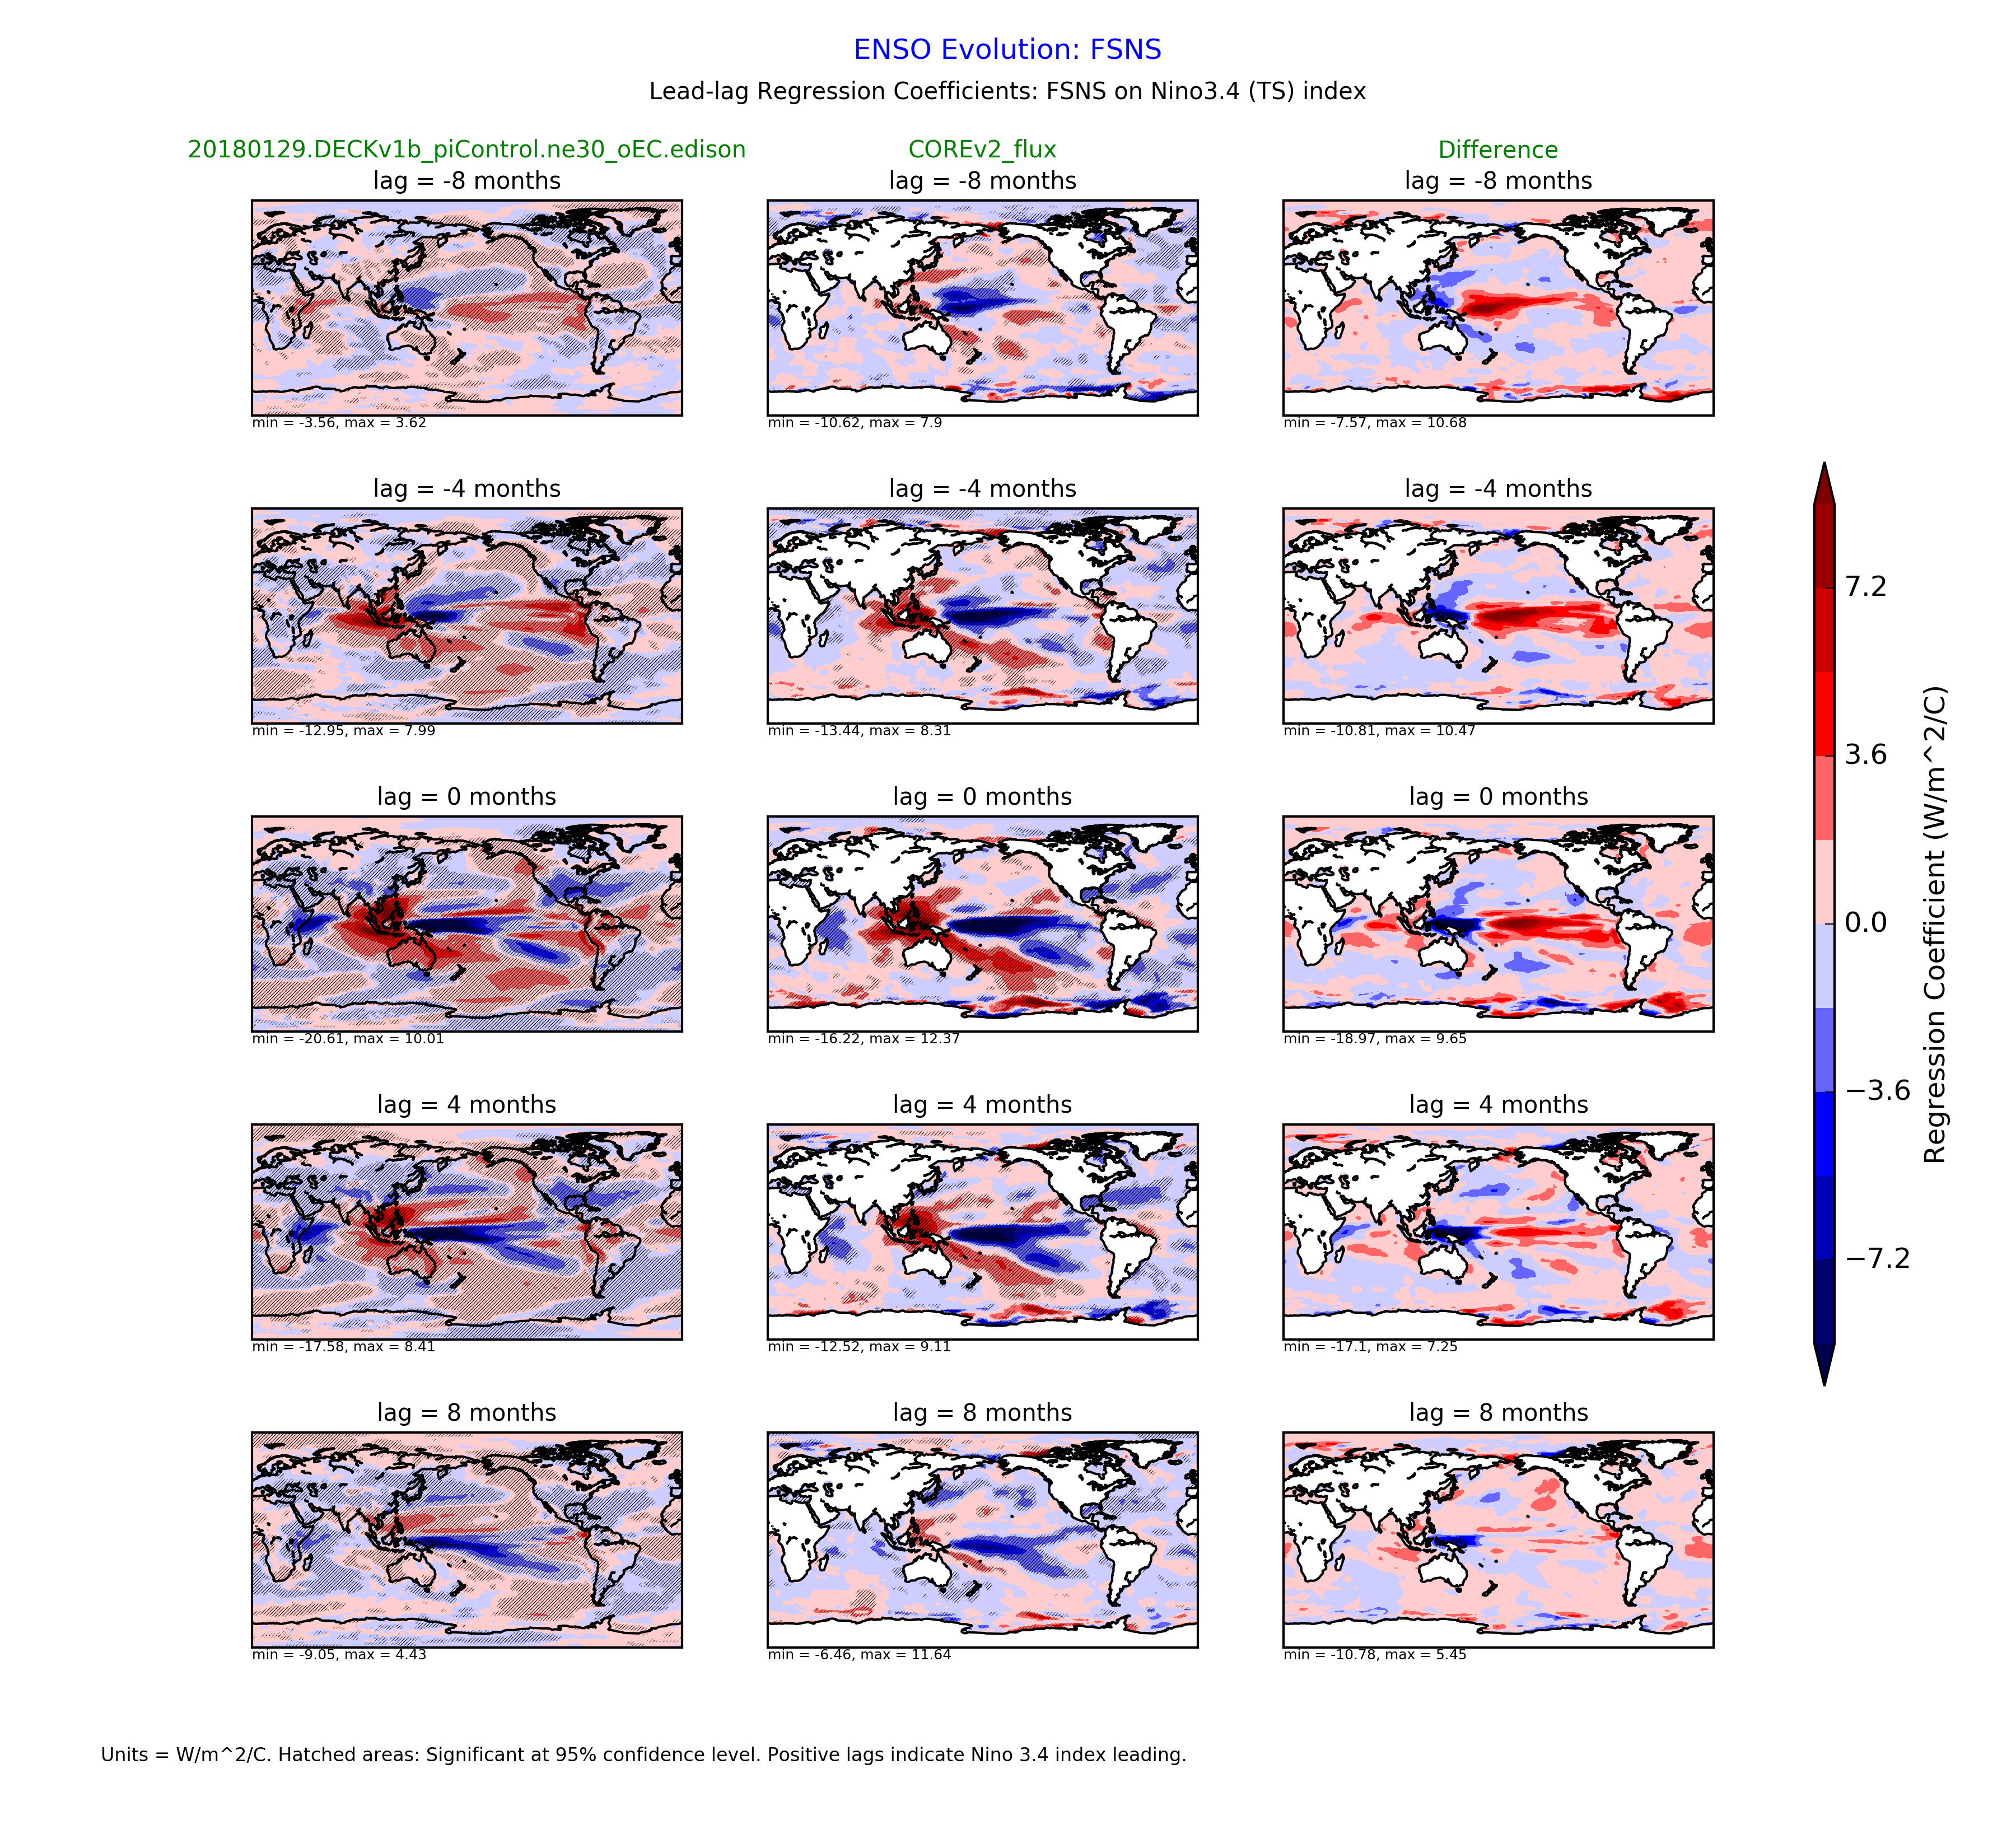
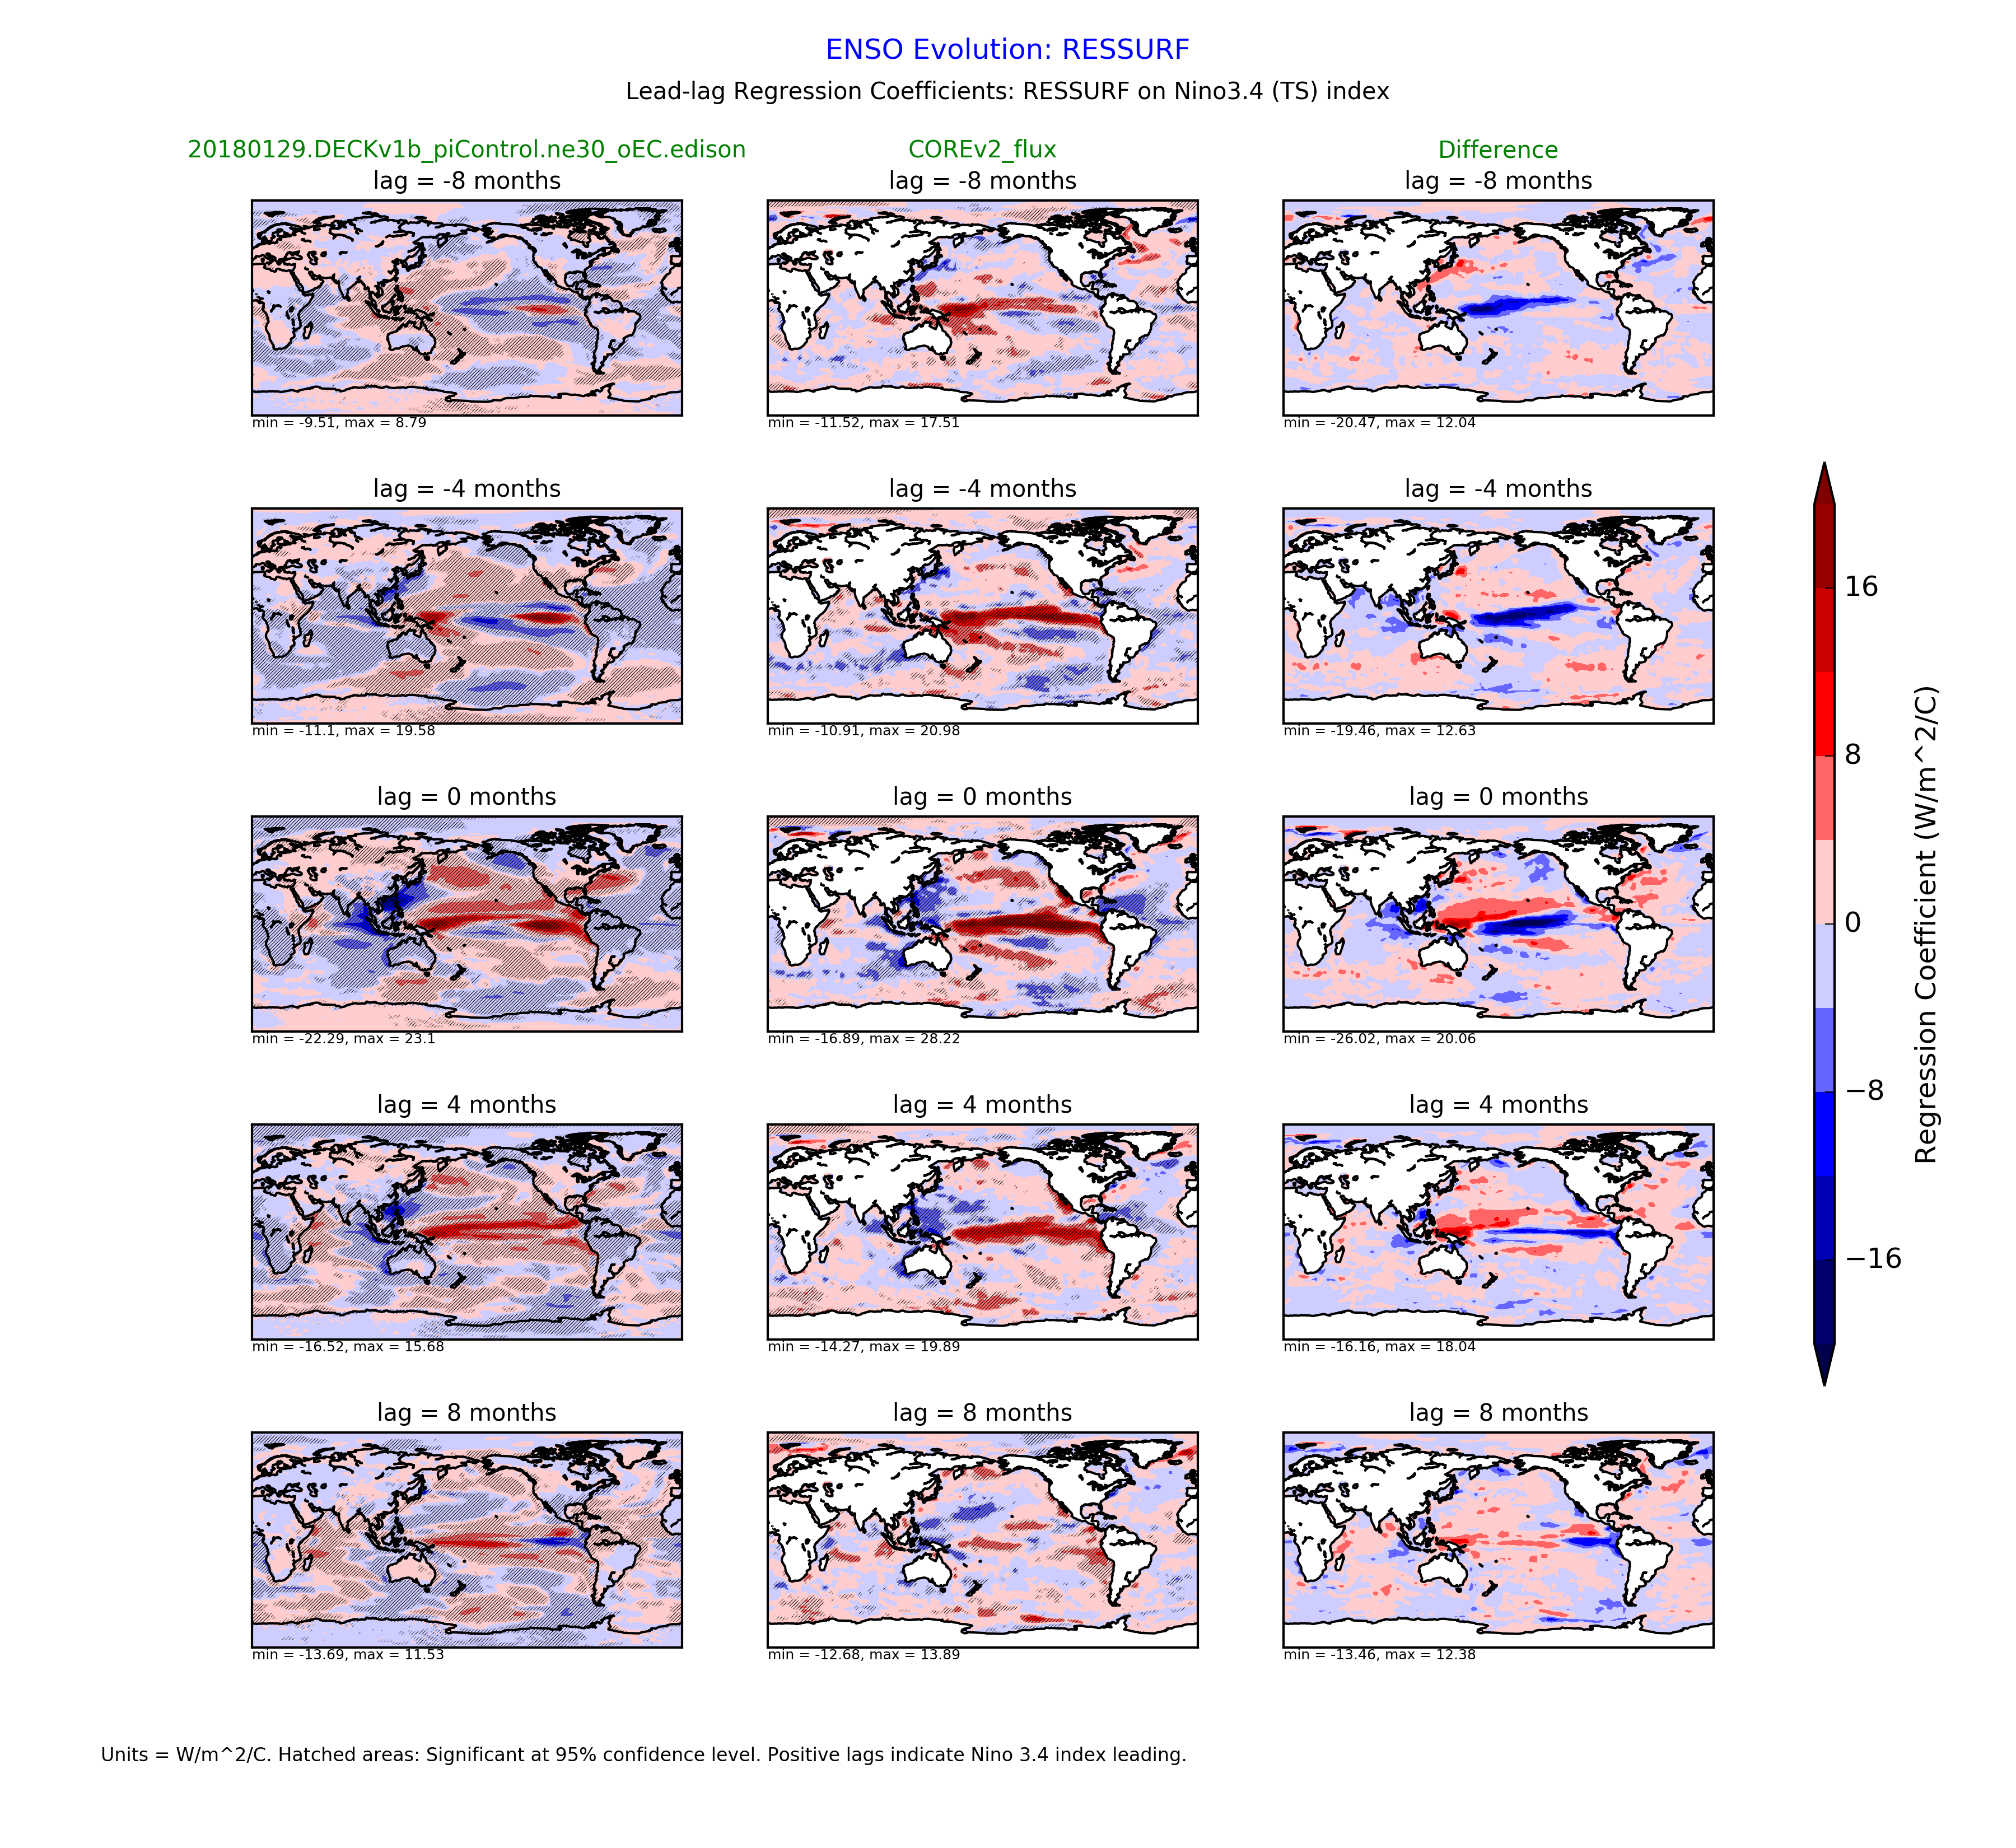
ENSO Evolution: Lead-lag Regression/Correlation on Nino3.4 Index
| Precipitation (COREv2)
| Regression
| Correlation
|
| PRECT
| Precipitation Rate
| plot
| plot
|
|
| Temperature (NCEP2)
| Regression
| Correlation
|
| TS
| Surface Temperature
| plot
| plot
|
|
| Sea Level Pressure (NCEP2_surface)
| Regression
| Correlation
|
| PSL
| Sea Level Pressure
| plot
| plot
|
|
| Wind Stress (COREv2_flux)
| Regression
| Correlation
|
| TAUX
| Ocean Zonal Wind Stress
| plot
| plot
|
|
| Surface Heat Flux (COREv2_flux)
| Regression
| Correlation
|
| LHFLX
| Latent Heat Flux
| plot
| plot
|
| SHFLX
| Sensible Heat Flux
| plot
| plot
|
| FLNS
| Longwave Heat Flux
| plot
| plot
|
| FSNS
| Shortwave Heat Flux
| plot
| plot
|
| RESSURF
| Surface Net Heat Flux
| plot
| plot
|
|
|