Mean State
Download Data |
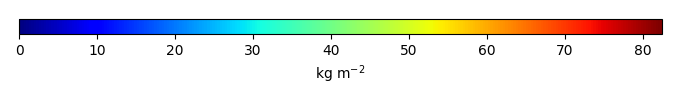
Period Mean (original grids) [Pg] |
Model Period Mean (intersection) [Pg] |
Model Period Mean (complement) [Pg] |
Benchmark Period Mean (intersection) [Pg] |
Benchmark Period Mean (complement) [Pg] |
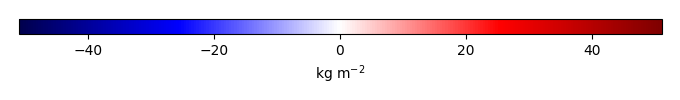
Bias [kg m-2] |
Bias Score [1] |
Spatial Distribution Score [1] |
Overall Score [1] |
|||
|---|---|---|---|---|---|---|---|---|---|---|---|---|
| Benchmark | [-] | 475. | ||||||||||
| cruncepv8 | [-] | 1.42e+03 | 593. | 861. | 465. | 10.5 | 5.80 | 0.57 | 0.72 | 0.64 | ||
| gswp3v2 | [-] | 1.13e+03 | 388. | 746. | 465. | 10.5 | -3.47 | 0.61 | 0.86 | 0.73 | ||
| princeton | [-] | 1.50e+03 | 674. | 910. | 465. | 10.5 | 9.47 | 0.56 | 0.75 | 0.65 |
Temporally integrated period mean