Mean State
Download Data |
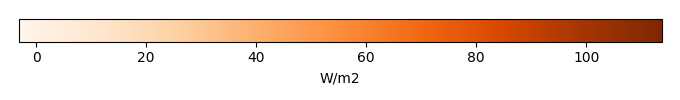
Period Mean (original grids) [W/m2] |
Model Period Mean (intersection) [W/m2] |
Model Period Mean (complement) [W/m2] |
Benchmark Period Mean (intersection) [W/m2] |
Benchmark Period Mean (complement) [W/m2] |
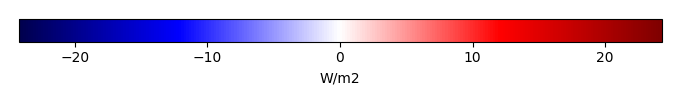
Bias [W/m2] |
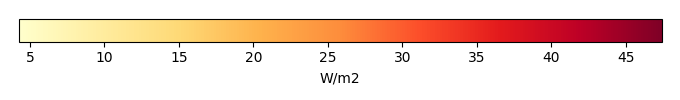
RMSE [W/m2] |
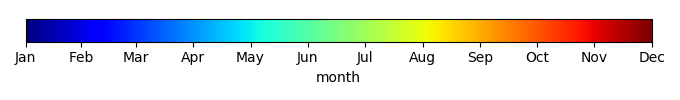
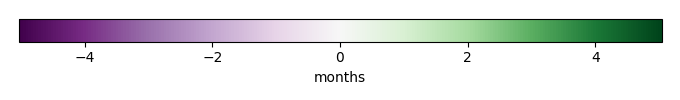
Phase Shift [months] |
Bias Score [1] |
RMSE Score [1] |
Seasonal Cycle Score [1] |
Spatial Distribution Score [1] |
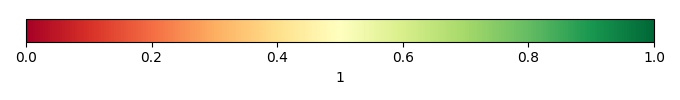
Overall Score [1] |
|||
|---|---|---|---|---|---|---|---|---|---|---|---|---|---|---|---|---|
| Benchmark | [-] | 39.1 | ||||||||||||||
| cruncepv8 | [-] | 43.9 | 45.4 | 9.77 | 40.4 | 7.89 | 5.00 | 16.8 | 0.800 | 0.59 | 0.41 | 0.87 | 0.98 | 0.65 | ||
| gswp3v2 | [-] | 41.2 | 42.5 | 8.99 | 40.4 | 7.89 | 2.09 | 16.4 | 0.924 | 0.60 | 0.39 | 0.85 | 0.99 | 0.64 | ||
| princeton | [-] | 38.7 | 40.1 | 10.3 | 40.4 | 7.89 | -0.323 | 15.4 | 0.869 | 0.58 | 0.42 | 0.84 | 0.98 | 0.65 |
Temporally integrated period mean