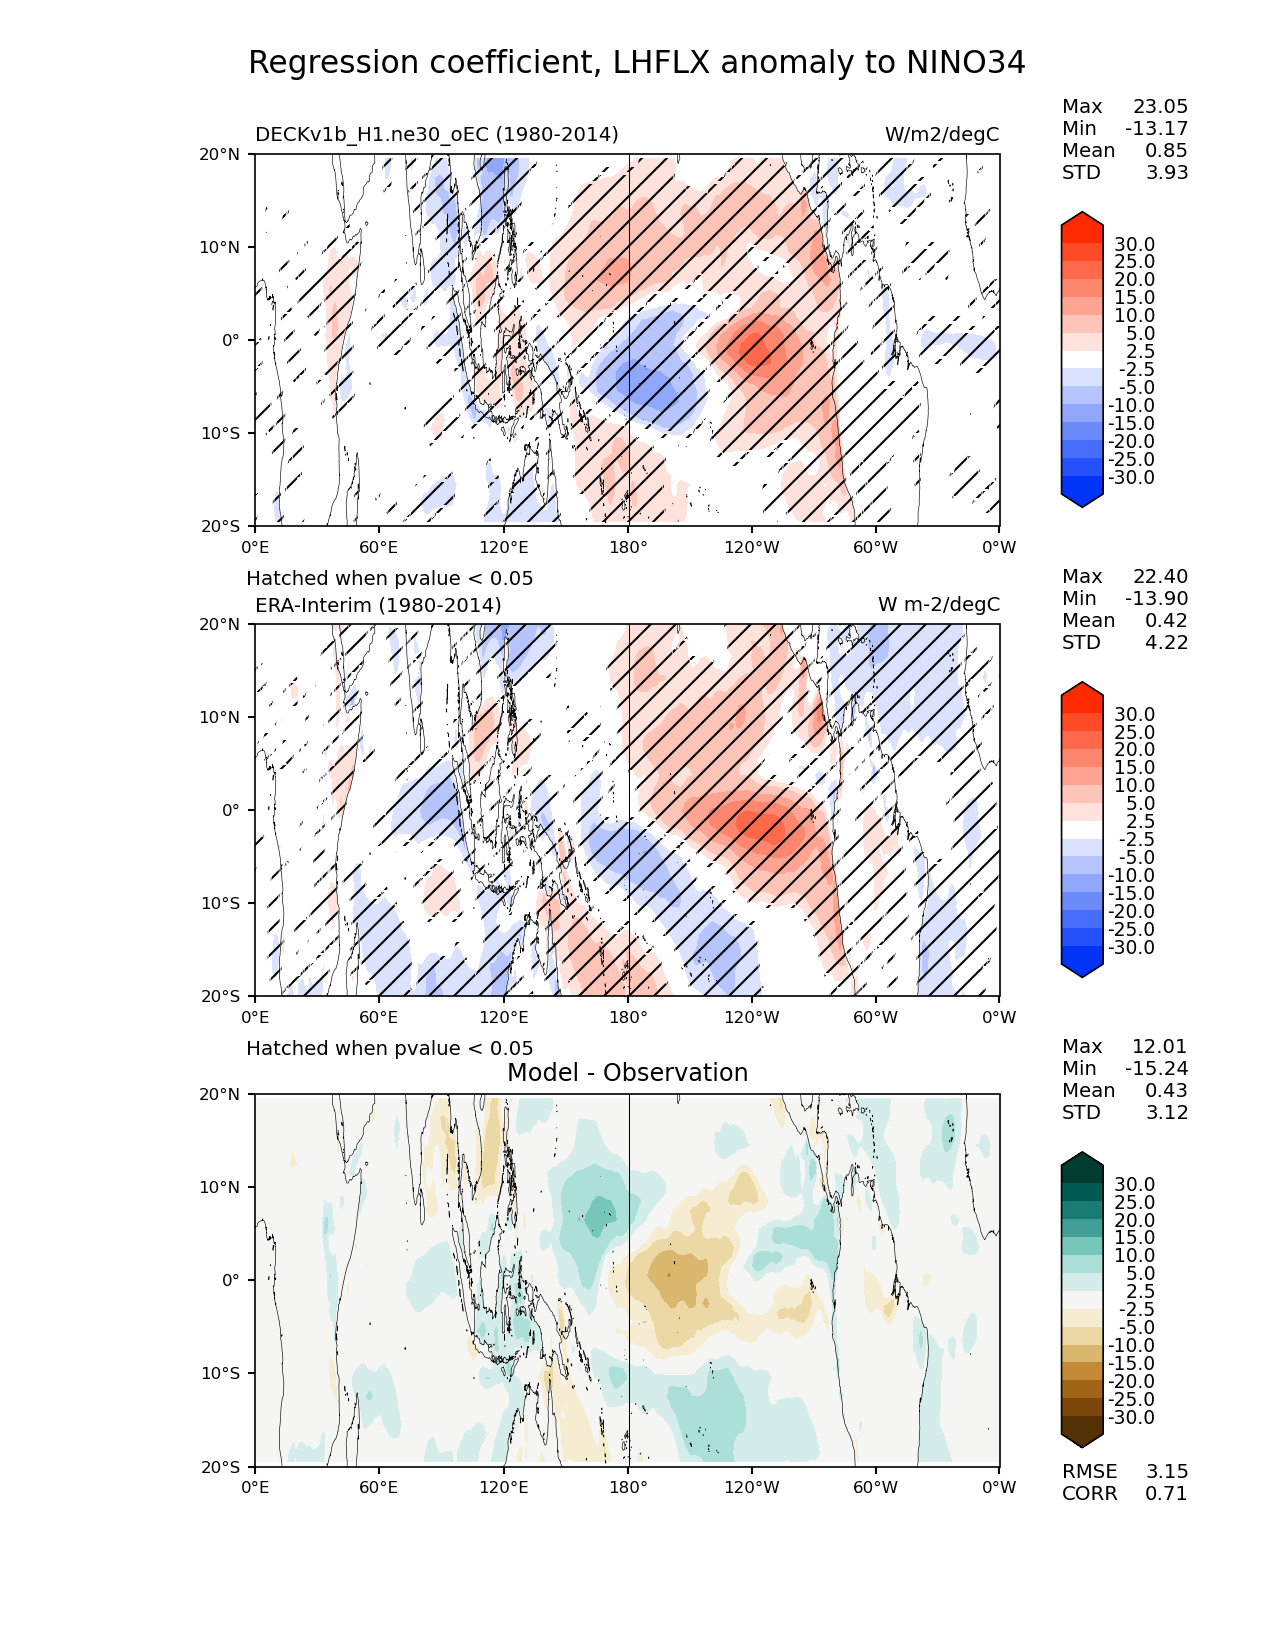
| Use this command to recreate this image: | e3sm_diags enso_diags --no_viewer --case_id 'LHFLX-response' --ref_timeseries_input --test_timeseries_input --sets 'enso_diags' --run_type 'model_vs_obs' --variables 'LHFLX' --seasons 'ANN' --regions '20S20N' --regrid_tool 'esmf' --regrid_method 'conservative' --main_title 'Regression coefficient, LHFLX anomaly to NINO34' --backend 'mpl' --output_format 'png' --canvas_size_w '1212' --canvas_size_h '1628' --figsize '8.5' '11.0' --dpi '150' --arrows --contour_levels '-30' '-25' '-20' '-15' '-10' '-5' '-2.5' '2.5' '5' '10' '15' '20' '25' '30' --test_name 'DECKv1b_H1.ne30_oEC' --test_colormap 'diverging_bwr.rgb' --ref_name 'ERA-Interim' --reference_name 'ERA-Interim' --reference_colormap 'diverging_bwr.rgb' --diff_title 'Model - Observation' --diff_colormap 'BrBG' --diff_levels '-30' '-25' '-20' '-15' '-10' '-5' '-2.5' '2.5' '5' '10' '15' '20' '25' '30' --multiprocessing --num_workers '30' --granulate 'variables' 'plevs' 'regions' --selectors 'sets' 'seasons' --reference_data_path '/global/cfs/cdirs/e3sm/acme_diags/obs_for_e3sm_diags/time-series' --test_data_path '/global/cfs/cdirs/e3sm/zhang40/postprocessing_for_e3sm_diags/monthly_ts/20180215.DECKv1b_H1.ne30_oEC.edison/1980-2014/rgr' --start_yr 1980 --end_yr 2014 --results_dir '/global/cfs/cdirs/e3sm/www/zhang40/tutorials/run_v230_allsets' --test_start_yr 1980 --ref_start_yr 1980 --test_end_yr 2014 --ref_end_yr 2014 |