DDT
Distributed Debugging Tool (DDT), a major component of the tool 'Arm Forge' (formerly called Allinea Forge), is a parallel GUI debugger.
Introduction
DDT is a parallel debugger which can be run with up to 8192 processors. It can be used to debug serial, OpenMP, MPI, Coarray Fortran (CAF), UPC (Unified Parallel C) codes.
Totalview users will find DDT has very similar functionality and an intuitive user interface. All of the primary parallel debugging features from Totalview are available with DDT.
The Arm Forge User Guide available from the Arm Forge web page or $ALLINEA_TOOLS_DOCDIR/userguide-forge.pdf on Cori after loading an allinea-forge module is a good resource for learning more about some of the advanced DDT features.
Loading the Arm Forge Module
To use DDT at NERSC, first load the allinea-forge module to set the correct environment settings:
module load allinea-forge
Compiling Code to Run with DDT
In order to use DDT, code must be compiled with the -g option. Add the -O0 flag with the Intel compiler. We also recommend that you do not run with optimization turned on, flags such as -fast.
Fortran
ftn -g -O0 -o testDDT_ex testDDT.f
C
cc -g -O0 -o testDDT_ex testDDT.c
Starting a Job with DDT
Running an X window GUI application can be painfully slow when it is launched from a remote system over internet. NERSC recommends to use the free NX software because the performance of the X Window-based DDT GUI can be greatly improved. Another way to cope with the problem is to use Arm Forge remote client, which will be discussed in the next section.
You can also start Be sure to log in with an X window forwarding enabled. This could mean using the -X or -Y option to ssh. The -Y option often works better for macOS.
ssh -Y username@cori.nersc.gov
After loading the allinea-forge module and compiling with the -g option, request an interactive session:
salloc -q interactive -N numNodes -C knl
Then launch the debugger with either
ddt ./testDDT_ex
or
forge ./testDDT_ex
where ./testDDT_ex is the name of your program to debug.
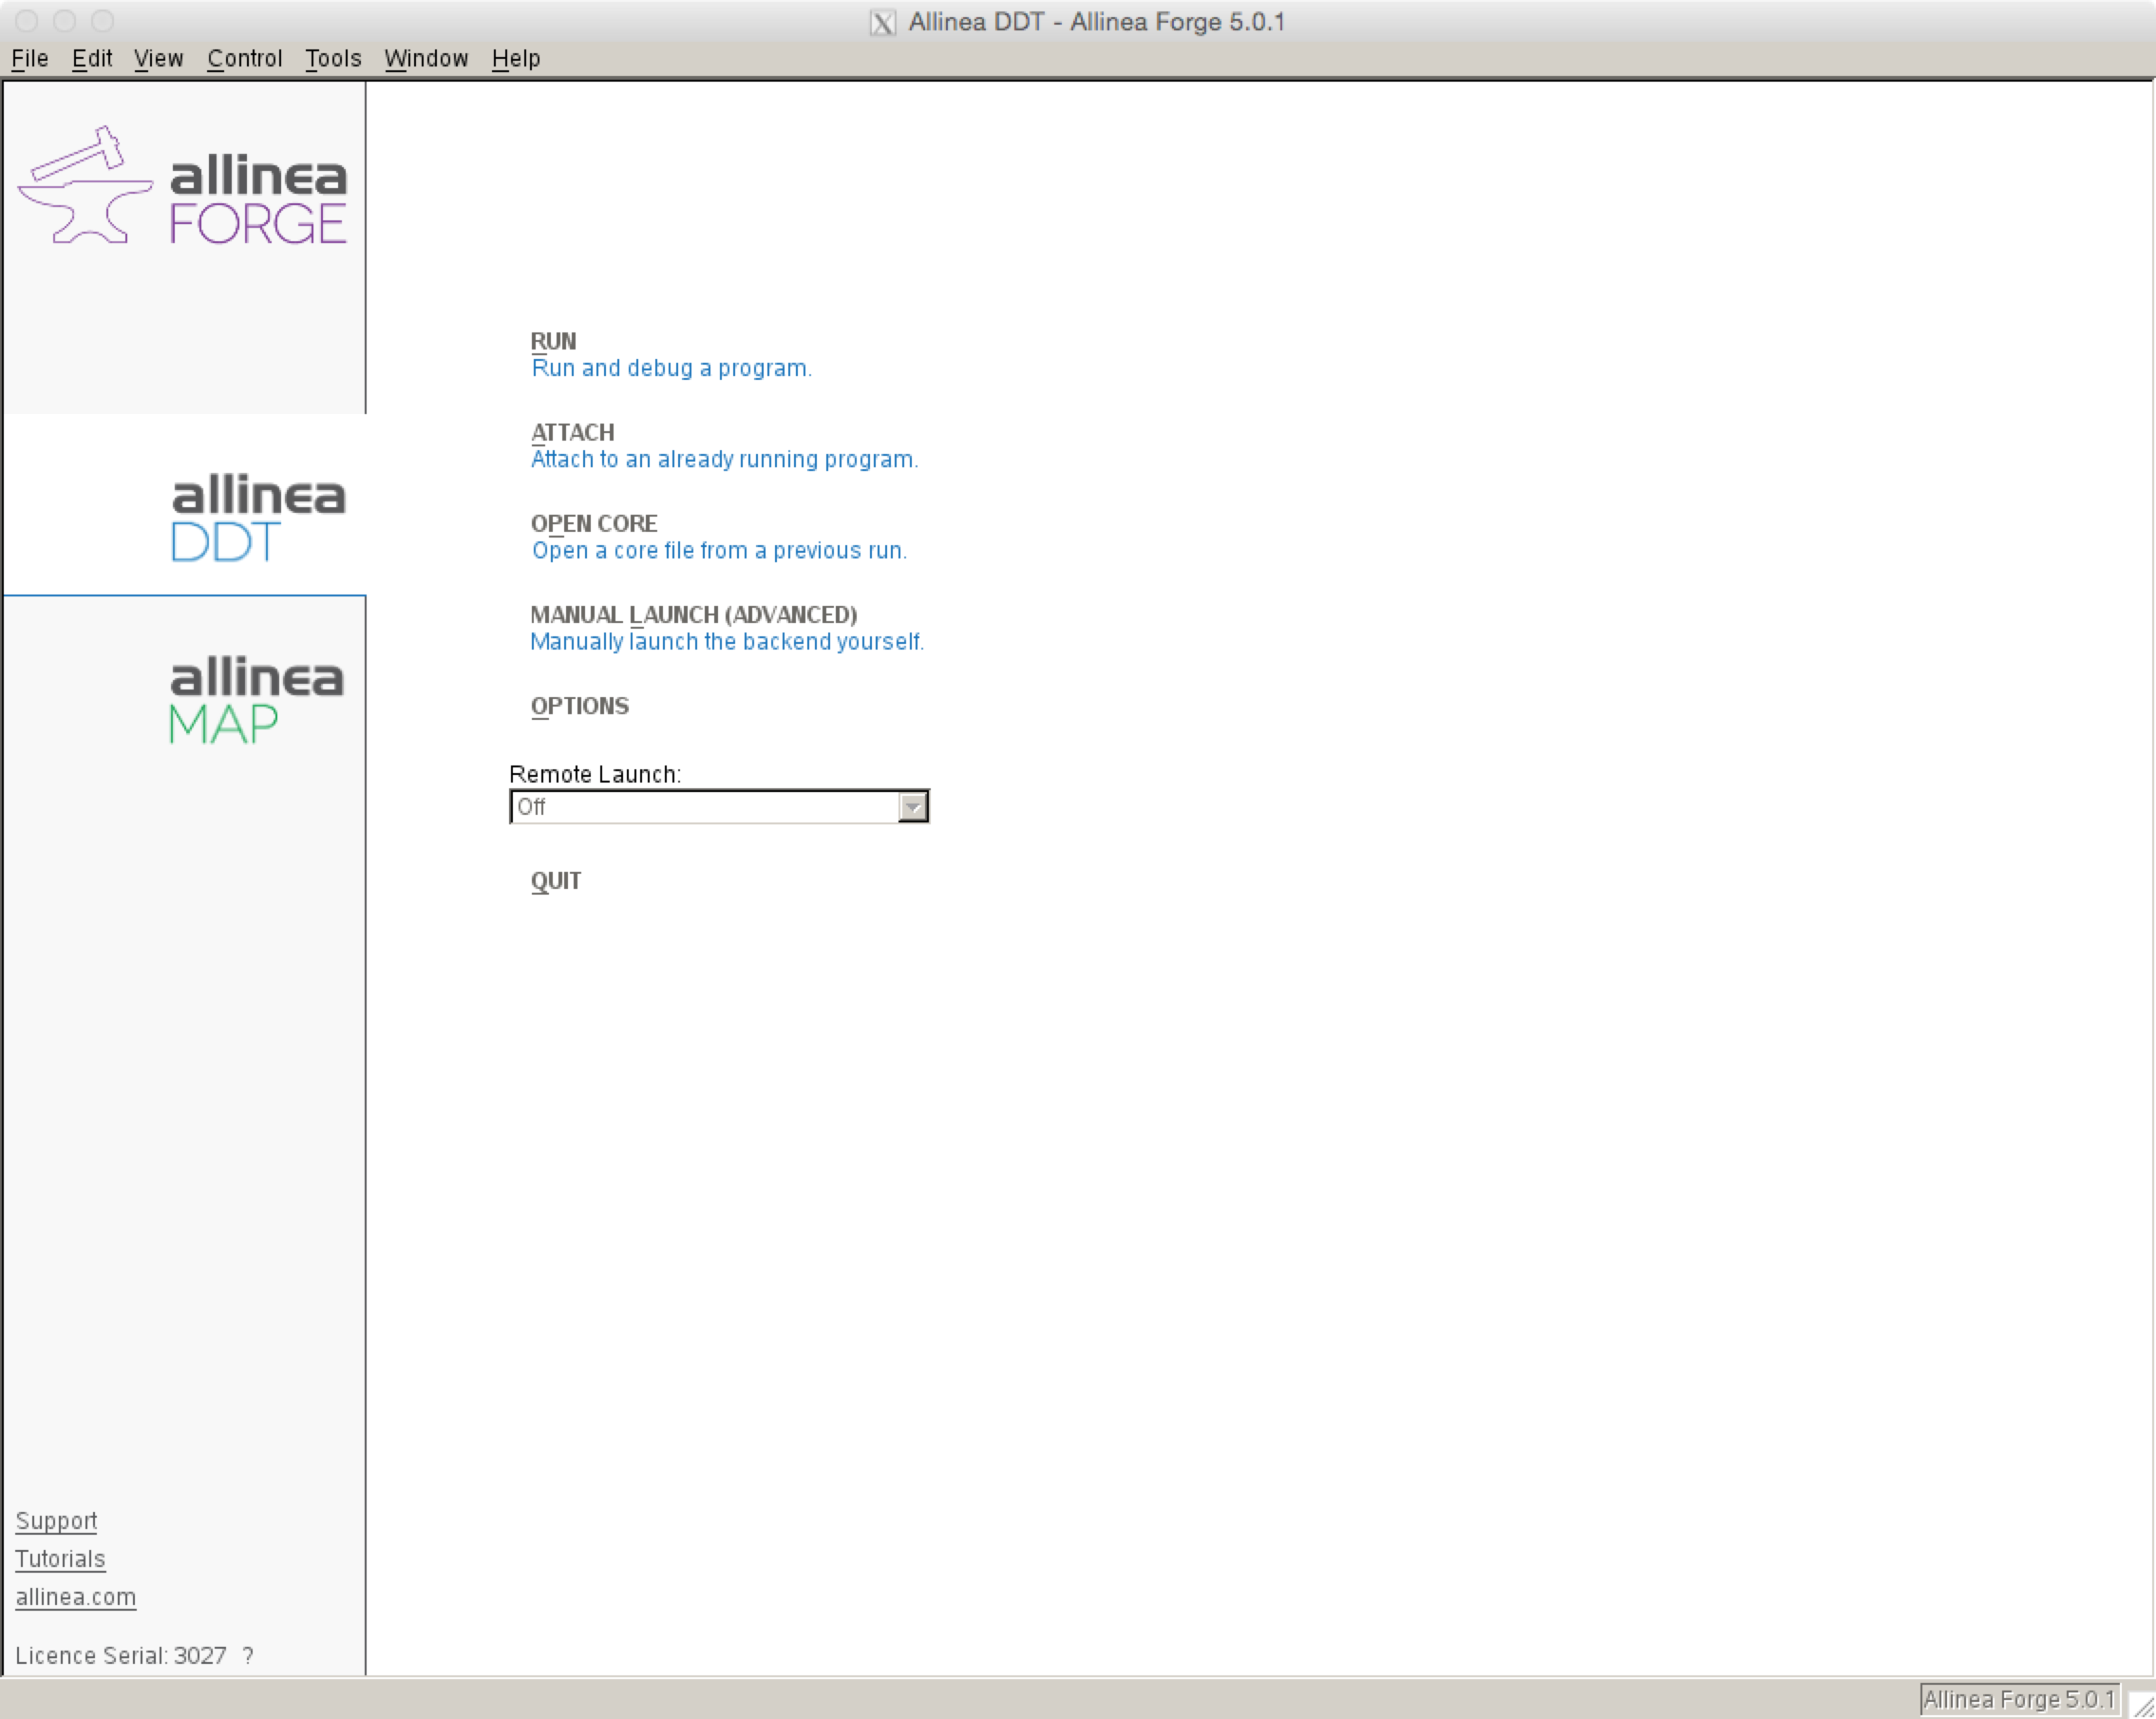
The Arm Forge GUI will pop up, showing a start up menu for you to select what to do. For basic debugging choose the option 'RUN' with the 'arm DDT' tool. A user can also choose 'ATTACH' to attach DDT to an already running program, or 'OPEN CORE' to view a core dump file from a previous job.
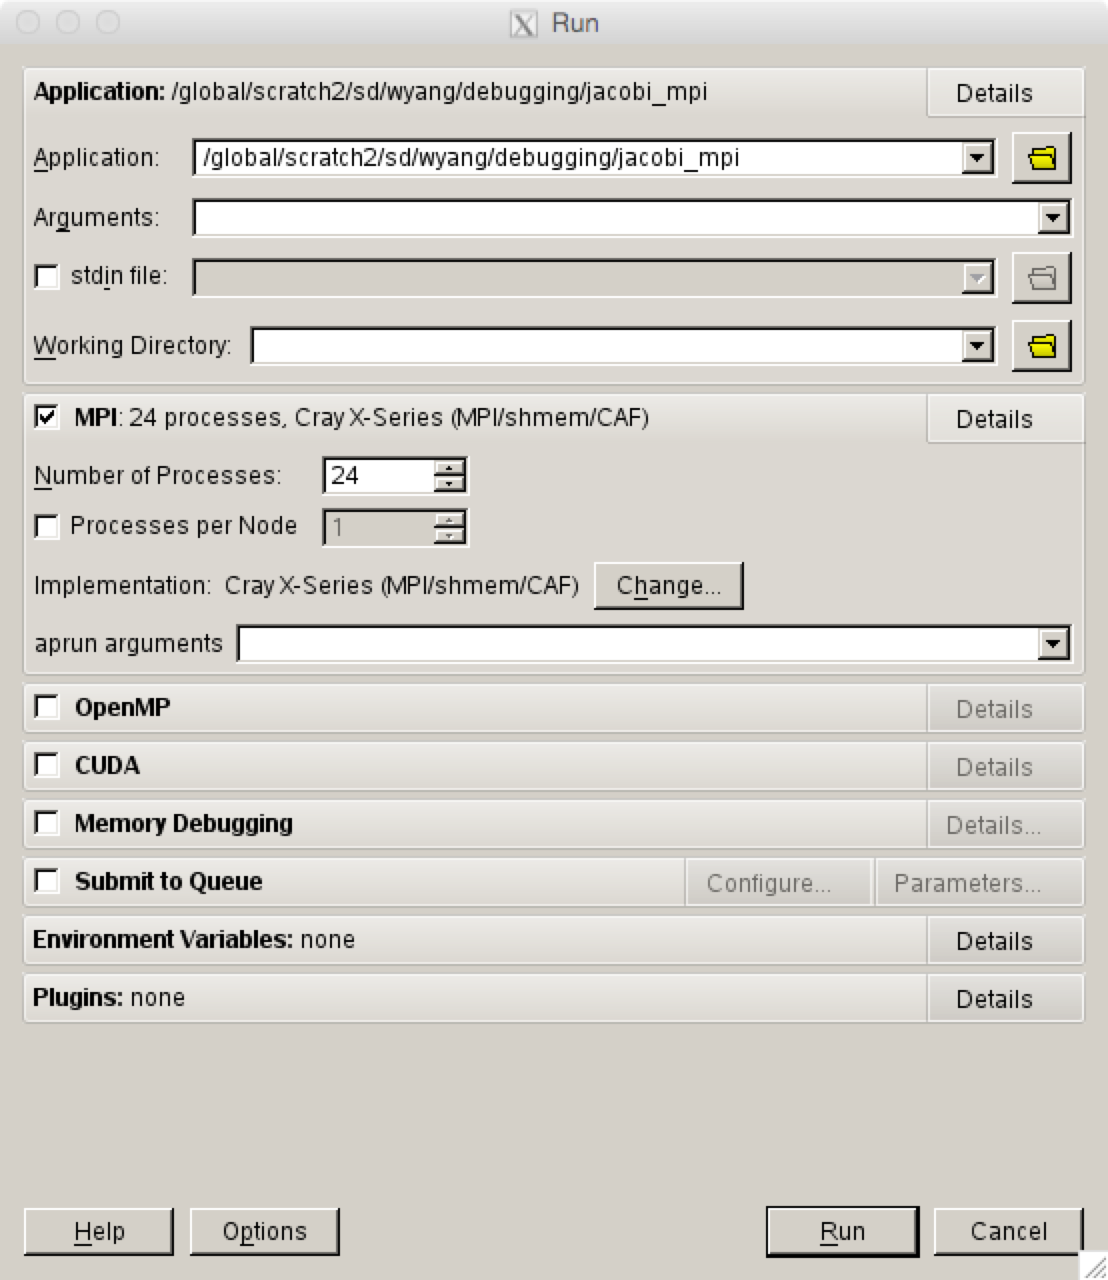
Then a submission window will appear with a prefilled path to the executable to debug. Select the number of processors on which to run and press run. To pass command line arguments to a program enter them in the 'srun arguments' box.
Reverse Connect Using Remote Client
Note: Using the remote client of version 18.3 on a Mac can generate a segmentation fault.
Arm provides remote clients for Windows, macOS and Linux that can run on your local desktop to connect via SSH to NERSC systems to debug, profile, edit and compile files directly on the remote NERSC machine. You can download the clients from Arm Forge download page and install on your laptop/desktop.
Please note that the client version must be the same as the Arm Forge version that you're going to use on the NERSC machines.
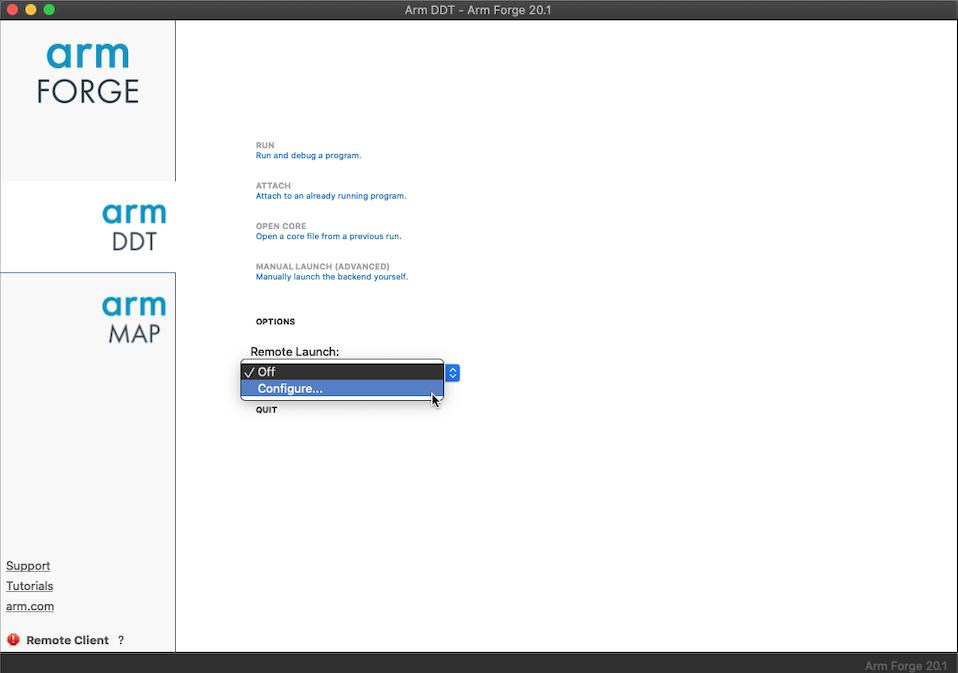
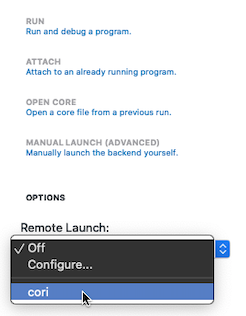
First, we need to configure the client for running a debugging session on a NERSC machine. Start the client, and select 'Configure...' in the 'Remote Launch' pull-down menu.
That will open the 'Configure Remote Connections' window.
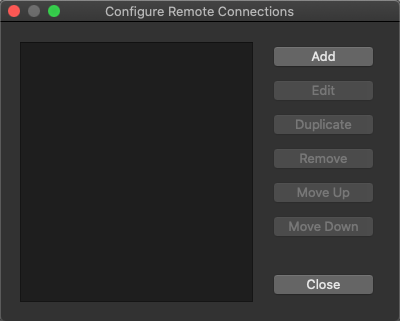
Using the 'Add', 'Edit' and other buttons, create configuration for Cori, as shown in the following example.
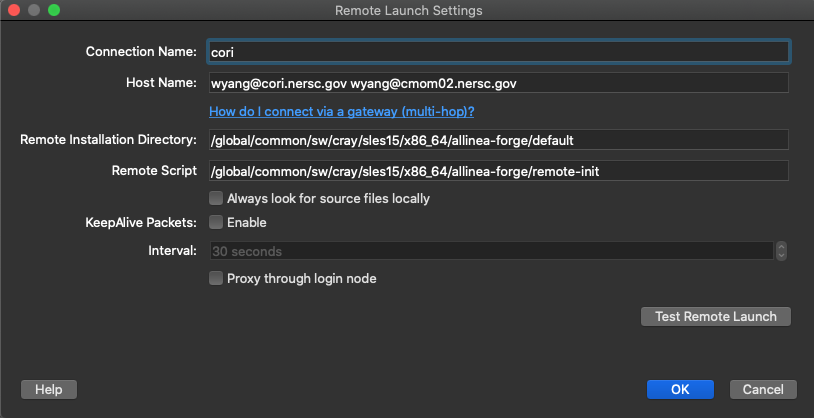
Make sure that you uncheck the 'Proxy through login node' box.
Note
In the Host Name field, we need enter two account entries for the Cray machines, one with the machine name itself and the other with one of its MOM nodes (wyang@cmom02.nersc.gov in the above example).
Note
Cori's MOM node names are cmom02 and cmom05.
For the 'Remote Installation Directory', use the path for the default allinea-forge module. The value for the 'Remote Script' field should be exactly the same as shown above.
The Remote Installation Directory and Remote Script values for Cori for the allinea-forge module are /global/common/sw/cray/sles15/x86_64/allinea-forge/default and /global/common/sw/cray/sles15/x86_64/allinea-forge/remote-init, respectively.
To start a debugging session on a machine, you need to login to the corresponding machine. This chooses the configuration for the machine from the same 'Remote Launch' menu.
You'll be prompted to authenticate with password plus MFA (Multi-Factor Authentication) OTP (One-time password):
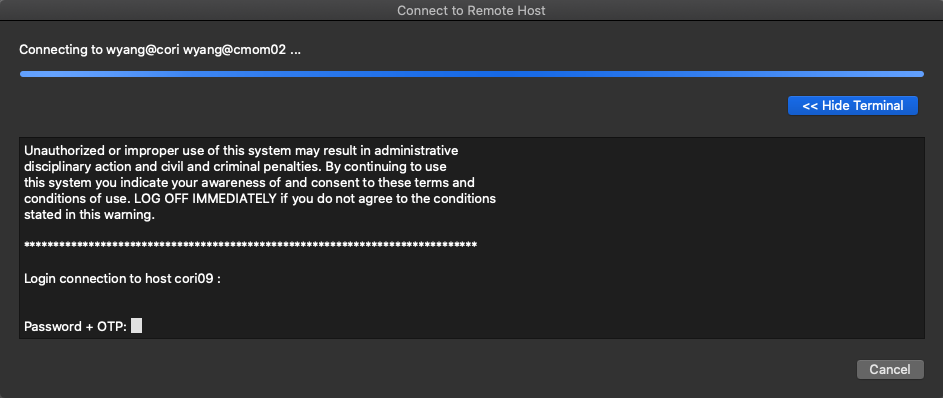
Please note that, if you set up your ssh to use the ssh keys generated by sshproxy as shown here and the keys have not expired, the remote client will connect to Cori without you entering password and OTP.
Arm recommends to use the Reverse Connection method with the remote client. To do this, put aside the remote client window that you have been working with, and login to the corresponding machine from a window on your local machine, as you would normally do.
ssh cori.nersc.gov
Then, start an interactive batch session there,
salloc -N 2 -t 30:00 -q debug -C knl
and run ddt with with the option --connect as follows:
module load allinea-forge
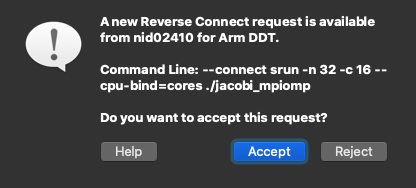
ddt --connect srun -n 32 -c 16 --cpu-bind=cores ./jacobi_mpiomp
The remote client will ask you whether to accept a Reverse Connect request. Click 'Accept'.
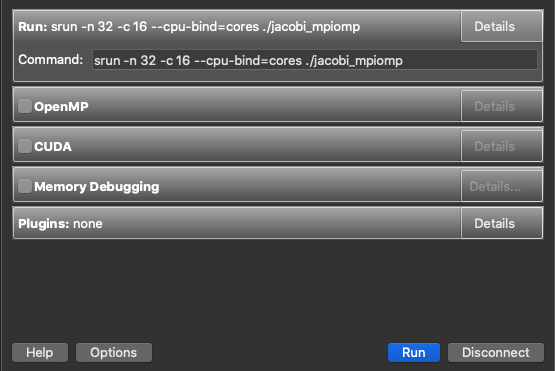
The usual Run window will appear where you can change or set run configurations and debugging options. Click 'Run'.
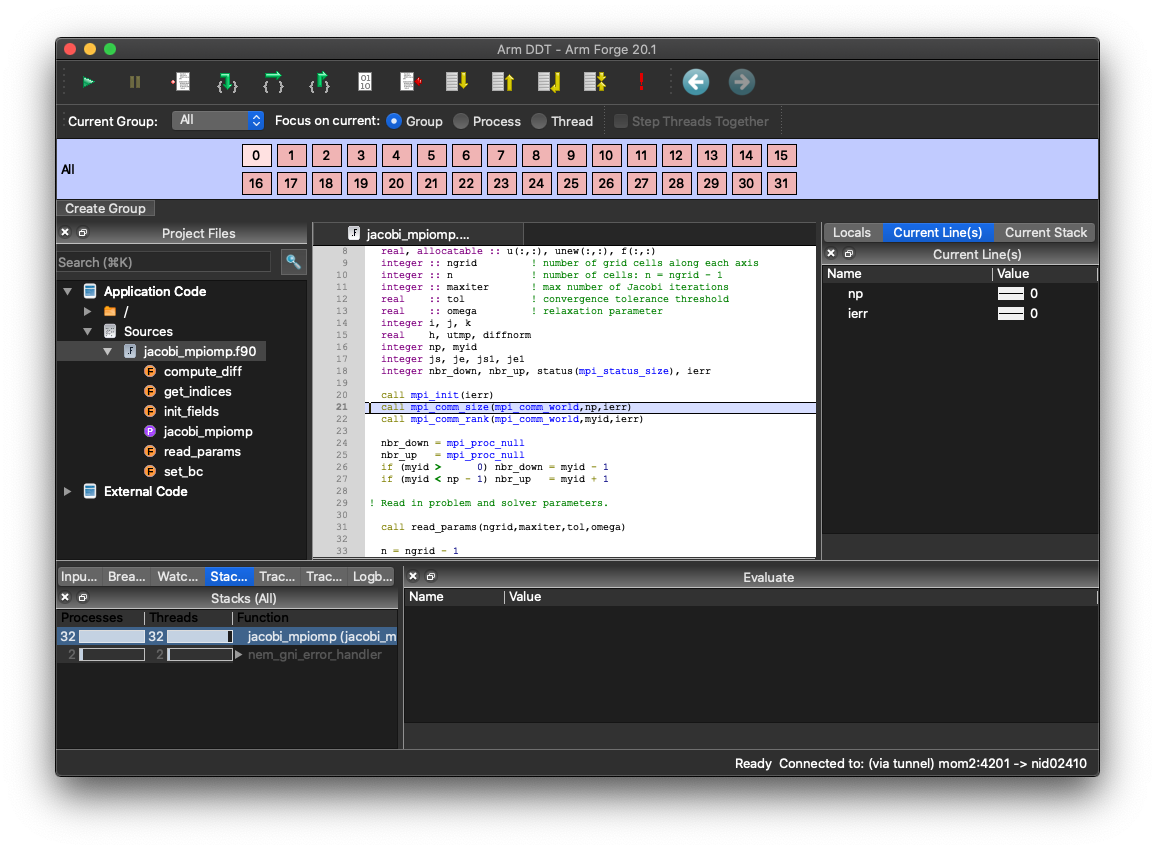
Now, you can start debugging in the remote client:
Troubleshooting
If you are having trouble launching DDT try these steps.
Make sure you have the most recent version of the system.config configuration file. The first time you run DDT, you pick up a master template which then gets stored locally in your home directory in ~/.allinea/${NERSC_HOST}/system.config where ${NERSC_HOST} is the machine name. If you are having problems launching DDT you could be using an older verion of the system.config file and you may want to remove the entire directory:
rm -rf ~/.allinea/${NERSC_HOST}
Remove any stale processes that may have been left by DDT.
rm -rf $TMPDIR/allinea-$USER
In case of a font problem where every character is displayed as a square, please delete the .fontconfig directory in your home directory and restart ddt.
rm -rf ~/.fontconfig
Make sure you are requesting an interactive batch session. NERSC has configured DDT to run from the interactive batch jobs.
salloc -q interactive -N numNodes -C knl
Finally make sure you have compiled your code with -g. A large number of users who are having trouble running with parallel debuggers forget to compile their codes with debugging flags turned on.
Basic Debugging Functionality
The DDT GUI interface should be intuitive to anyone who has used a parallel debugger like Totalview before. Users can set breakpoints, step through code, set watches, examine and change variables, dive into arrays, dereference pointers, view variables across processors, step through processors etc. Please see the Arm Forge User Guide if you have trouble with any of these basic features.
Useful DDT Features
Process Groups
With DDT, the user can easily change the debugger to focus on a single process or group of processes. If Focus on current Processor is chosen, then stepping through the code, setting a breakpoint etc will occur only for a given processor. If Focus on current Group is chosen then the entire group of processors will advance when stepping forward in a program and a breakpoint will be set for all processors in a group.

Similary, when Focus on current Thread is chosen, then all actions are for an OpenMP thread. DDT doesn't allow to create a thread group. However, one can click the Step Threads Together box to make all threads to move together inside a parallel region. In the image shown above, this box is grayed out simply because the code is not an OpenMP code.
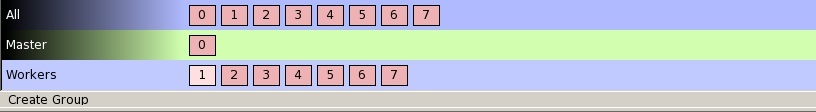
A user can create new sub-groups of processors in several ways. One way is to click on the 'Create Group' button at the bottom of the 'Process Group Window'. Another way is to right-click in the 'Process Group Window' to create a group and then drag the desired processors to the group. Groups can also be created more efficiently using sub-groups from the 'Parallel Stack View' described below. The below image shows 3 different groups of processors, the default All group, a group with only a single master processor 'Master' and a group with the remaining 'Workers' processors.
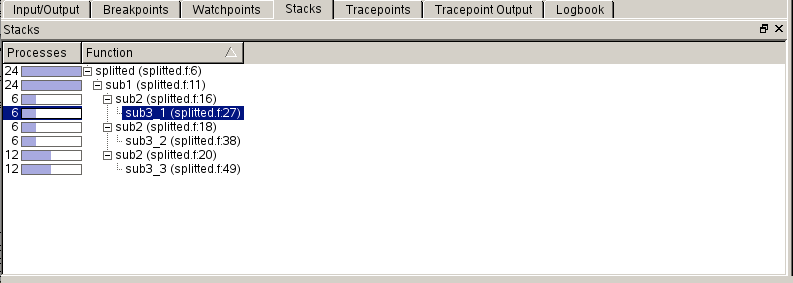
Parallel Stack View
A feature which should help users debug at high concurrencies is DDT's 'Parallel Stack View' window found in the lower left area, which allows the user to see the position of all processors in a code at the same time from the main window. A program is displayed as a branching tree with the number and location of each processor at each point. Instead of clicking through windows to determine where each processor has stopped, the 'Parallel Stack View' presents a quick overview which easily allows users to identify stray processes. Users can also create sub-groups of processors from a branch of the tree by right clicking on the branch. A new group will appear in the 'Process Group Window' at the top of the GUI.
Memory Debugging
DDT has a memory debugging tool that can show heap memory usage across processors.
Dynamic linking has become the default mode of linking on Cori and we explain how to build in case of dynamic linking. For static linking, please check the user manual.
The example is provided for a Fortran code case. Adjustments should be made for C and C++ codes accordingly.
Build as usual, but link with the -zmuldefs flag as follows:
ftn -g -c prog.f
ftn -o prog prog.o -zmuldefs
Next, when DDT starts, you must click the 'Memory Debugging' checkbox in the DDT run menu that first comes up.
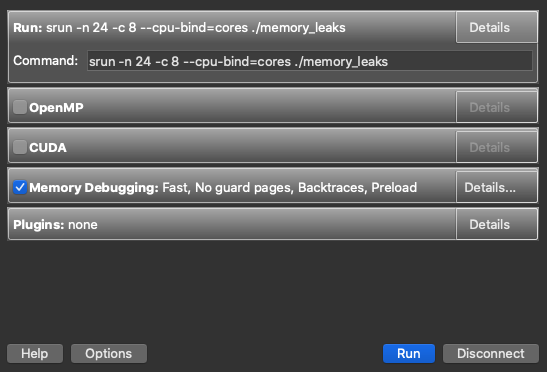
To set detailed memory debugging options, click the 'Details...' button on the far right side, which will open the 'Memory Debugging Options' window. There you can set the heap debugging level, the number of guard pages before or after arrays (but not both) for detection of heap overflow or underflow in the program, etc. The default page size is 4 KB.
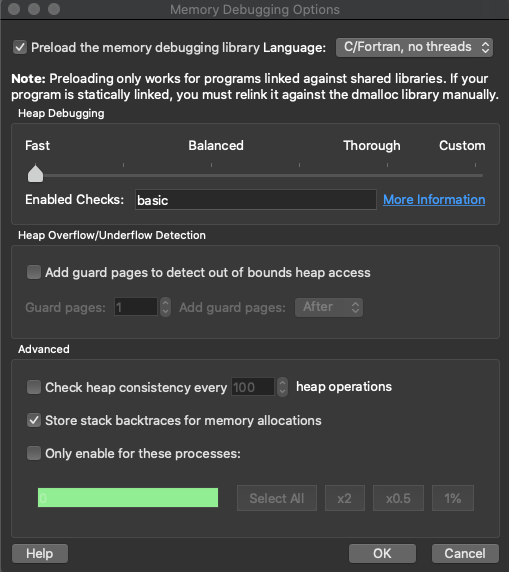
Click the 'Preload the memory debugging library' checkbox at the top for a dynamically-linked executable. When running ddt with a statically built code, please deselect the 'Preload the memory debugging library' item. Otherwise, ddt can hang indefinitely during startup on Cray machines.
Also select the proper language and threading item from the pull-down menu right next to it.
Usage
Several features are enabled with memory debugging. Select 'Current Memory Usage' or 'Memory Statistics' under the 'Tools' menu. With the following buggy code that generates memory leaks:
      program memory_leaks

!...  Buggy code prepared by NERSC User Service Group for a debugging tutorial
!...  February, 2012

      implicit none
      include 'mpif.h'
      integer, parameter :: n = 1000000
      real val
      integer i, ierr
      call mpi_init(ierr)
      val = 0.
      do i=1,10
         call sub_ok(val,n)
      end do
      do i=1,10
         call sub_bad(val,n)
      end do
      do i=1,10
         call sub_badx2(val,n)
      end do
      print *, val
      call mpi_finalize(ierr)
      end

      subroutine sub_ok(val,n)      ! no memory leak
      integer n
      real val
      real, allocatable :: a(:)
      allocate (a(n))
      call random_number(a)
      val = val + sum(a)
!     deallocate(a)                 ! ok not to deallocate
      end

      subroutine sub_bad(val,n)     ! memory leak of 4*n bytes per call
      integer n
      real val
      real, pointer :: a(:)
      allocate (a(n))
      call random_number(a)
      val = val + sum(a)
!     deallocate(a)                 ! not ok not to deallocate
      end

      subroutine sub_badx2(val,n)   ! memory leak of 8*n bytes per call
      integer n
      real val
      real, pointer :: a(:)
      allocate (a(n))
      call random_number(a)
      val = val + sum(a)
      allocate (a(n))               ! not ok to allocate again
      call random_number(a)
      val = val + sum(a)
!     deallocate(a)                 ! not ok not to deallocate
      end
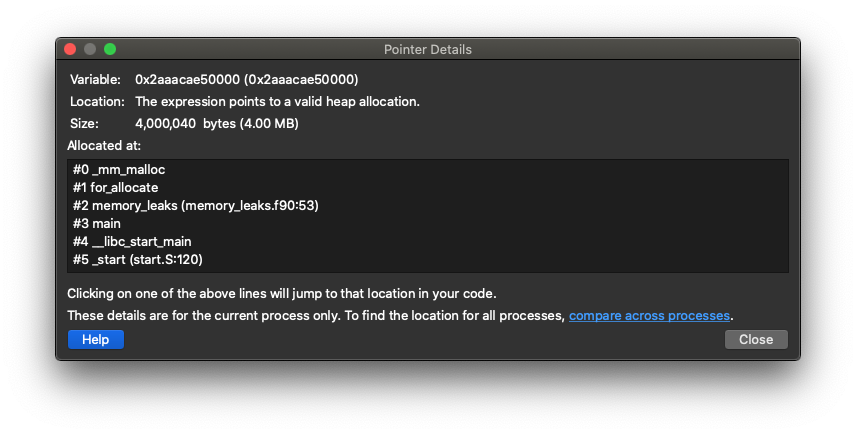
You can easily see heap memory information (such as how much is being used, how much has been allocated, how much is freed, etc.), from which you can deduce where memory leaks occur. Below is a window shown when the 'Current Memory Usage' menu is selected:
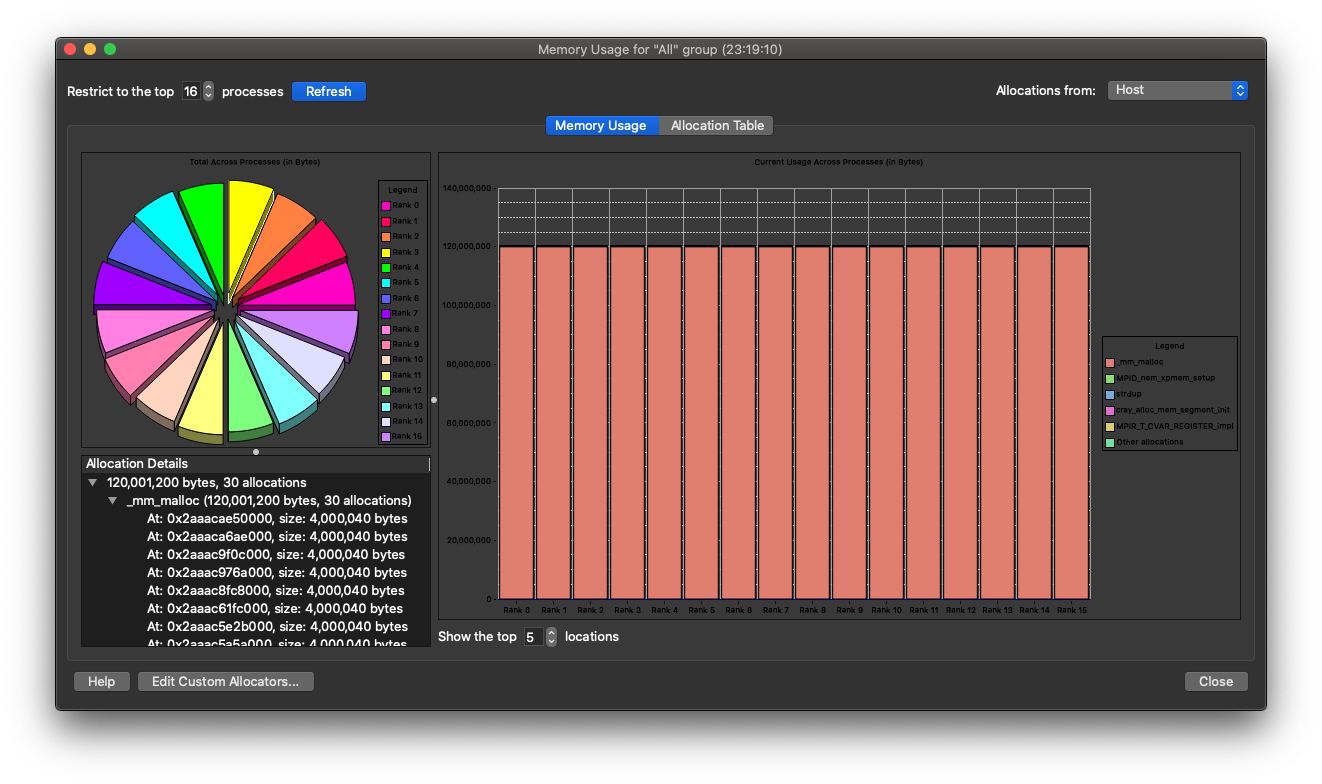
It displays current heap memory usage of the program and the routines where it is allocated. Clicking on a histogram bar on the right, you will see the 'Allocation Details' box on the left filled up with information about where the memory allocation was made. By clicking on one of the pointers in the 'Allocation Details' list you can get information mapped to source code:
It shows how much It is known that memory debugging can fail with the error message 'A tree node closed prematurely. One or more proceses may be unusable.', especially with MPI_Bcast. A workaround is to disable 'store stack backtraces for memory allocations' option in the 'Enable Memory Debugging' setting. This problem will be fixed in the next release.
Offline Debugging
Offline debugging is to run DDT in a command-line mode, without using GUI. This mode may be useful if all you want is to get tracepoint (a specified location in the code where requested values are printed) output or stack backtraces without directly interacting with DDT. This can be good for a "parameter study" where you want to check for an error condition for a range of a parameter value, which would become a tedious task if GUI is used.
To run DDT in this mode, you submit a batch job using a batch script ("runit") that looks like:
#!/bin/bash
#SBATCH ...

module load allinea-forge
ddt --offline -o filename.html --np=4 myprogram arg1 ... # to get HTML output file
ddt --offline -o filename      --np=4 myprogram arg1 ... # to get plain text output file
Which is submitted via sbatch:
sbatch runit
Please note that we are using ddt -offline ... in place of srun or mpirun for launching an application. Output of the debugging session is saved in the specified file (filename.html or filename in the above example).
Some options can be used for the ddt command:
-
--session=sessionfile: run using settings saved using the 'Save Session' option during a previous GUI run session -
--np=numTasks: run withnumTasks(MPI) tasks -
--mem-debug: enable memory debugging -
--trace-at=LOCATION[,N:M,P],VAR1,VAR2,... [if CONDITION]: set a tracepoint at locationLOCATION(given by either 'filename:linenumber' orfunctionnameas inmain.c:22ormyfunction), beginning recording after the N-th visit of each process to the location, and recording every M-th subsequent pass until it has been triggered P times; record the value of variableVAR1,VAR2, ...; the if clause allows to specify a booleanCONDITIONthat must be satisfied to trigger the tracepoint -
--break-at=LOCATION[,N:M:P] [if CONDITION]: set a breakpoint at a location using the format explained above; the stack back traces of pausing processes will be recorded at the breakpoint before they are then made to continue
An example using the following simple code is shown below:
      program offline
!...  Prepared for a debugger tutorial by NERSC
      include 'mpif.h'
      integer, parameter :: n = 24
      real, allocatable :: a(:)
      integer i, me
      call mpi_init(ierr)
      call mpi_comm_rank(mpi_comm_world,me,ierr)
      allocate (a(n))
      call random_number(a)
      do i=1,n
      if (mod(i,2) == 1) call sub(i,n,a)      ! 'sub' called when i=1,3,5,...
      end do
      print *, me, sum(a)
      deallocate(a)
      call mpi_finalize(ierr)
      end

      subroutine sub(i,n,a)
      integer n, i, j
      real a(n)
      do j=1,n
      a(j) = cos(a(j))
      end do
      end
The following is to set a tracepoint at the beginning of the routine sub where values of i and a(1) are to be printed; and to set a breakpoint at line 23, using the activation scheme of '5:3:2':
ddt --offline -o offline.html --np=4 --trace-at=sub,i,a\(1\) --break-at=offline.f:23,5:3:2 ./offline
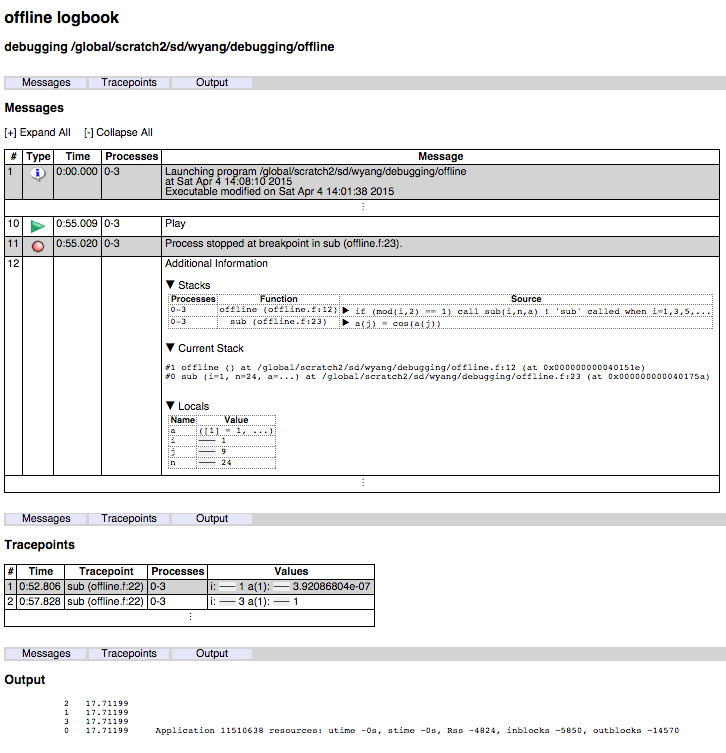
The output file is broken into three sections: 'Messages' (showing process activities such as startup and termination etc., as well as call backtrace at breakpoints), 'Tracepoints' (showing output from activated tracepoints), and 'Output' (program output).