STAT and ATP
STAT
Note
The tool may fail to work properly without loading the cray-cti module. Until this is added automatically by the system, please load the module, too.
STAT (the Stack Trace Analysis Tool) is a highly scalable, lightweight tool that gathers and merges stack traces from all of the processes of a parallel application. The results are then presented graphically as a call tree showing the location that each process is executing.
This is a useful tool for debugging an application that hangs because collected call backtraces can quickly tell you where each process is executing at the moment in the code, providing a hint on where to look further for more detailed analysis.
It supports distributed-memory parallel programming only such as MPI, Coarray Fortran and UPC (Unified Parallel C).
One way to collect backtraces under Slurm is explained below.
-
Start an interactive batch job and launch an application in background. Keep the process ID (PID).
nersc$ salloc -N 1 -t 30:00 -q debug [...other flags...]
...
nersc$ srun -n 4 [...other flags...] ./jacobi_mpi &
[1] 95298
You can also see the PID by running the 'ps' command:
nersc$ ps PID TTY TIME CMD 95018 pts/0 00:00:00 bash 95298 pts/0 00:00:00 srun 95302 pts/0 00:00:00 srun 95325 pts/0 00:00:00 ps -
Load the module stat
nersc$ module load stat -
Run the
stat-clcommand on this process. You may want to use the-iflag to gather source line numbers, too:nersc$ stat-cl -i 95298 STAT started at 2016-11-30-07:33:37 Attaching to job launcher (null):95298 and launching tool daemons... Tool daemons launched and connected! Attaching to application... Attached! Application already paused... ignoring request to pause Sampling traces... Traces sampled! ... Resuming the application... Resumed! Merging traces... Traces merged! Detaching from application... Detached! Results written to /global/cscratch1/sd/wyang/parallel_jacobi/stat_results/jacobi_mpi.0004stat-cltakes several backtrace samples after attaching to the running processes. The result file is created in thestat_resultssubdirectory under the current working directory. This subdirectory contains another subdirectory whose name is based on your parallel application's executable name that contains the merged stack trace file in DOT format. -
Then, run the GUI command,
STATview, with the file above to visualize the generated*.dotfiles for stack backtrace information.nersc$ STATview stat_results/jacobi_mpi.0004/00_jacobi_mpi.0004.3D.dotPlease note that, if you're running on Cori KNL nodes, you have to go to a login node for this step (after loading the stat module there). Otherwise, fonts will not be shown correctly.
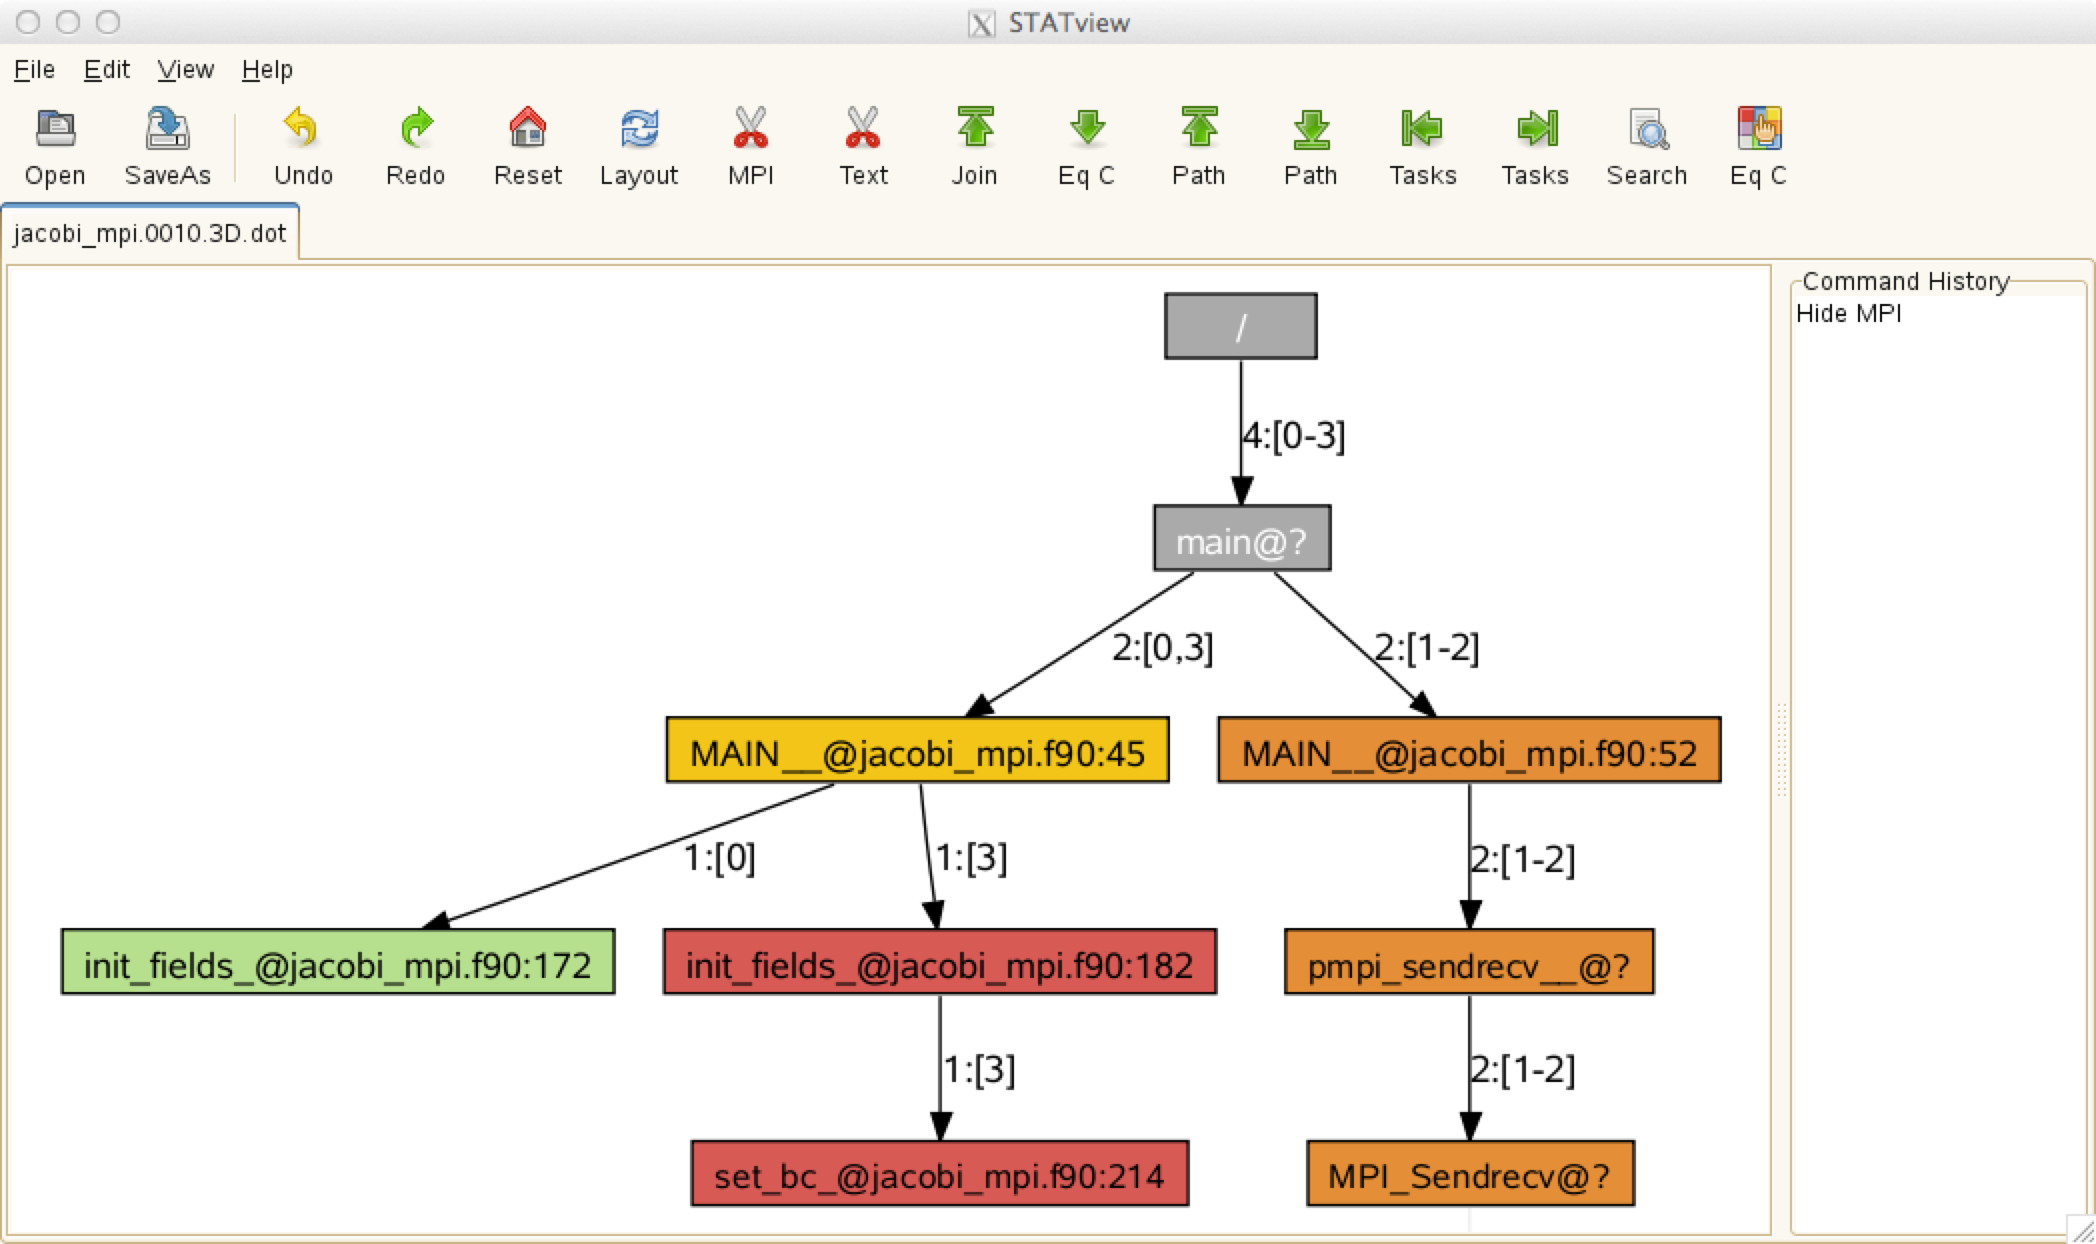
The above call tree diagram reveals that rank 0 is in the 'init_fields' routine (line 172 of jacobi_mpi.f90), rank 3 in the 'set_bc' routine (line 214 of the same source file), and the other ranks (1 and 2) are in the MPI_Sendrecv function. If this pattern persists, it means that the code hangs in these locations. With this information, you may want to use a full-fledged parallel debugger such as DDT or TotalView to find out why your code is stuck in these places.
ATP
Note
The tool may fail to work properly without loading the cray-cti module. Until this is added automatically by the system, please load the module, too.
Another useful tool in the same vein is ATP (Abnormal Termination Processing) that Cray has developed. ATP gathers stack backtraces when the code crashes, by running STAT before it exits.
The 'atp' module is load by default on Cray systems, but it is not enabled. To enable it so that it generates stack backtrace info upon a failure, set the following environment variable before your aprun command in your batch script:
setenv ATP_ENABLED 1          # for csh/tcsh

export ATP_ENABLED=1          # for bash/sh/ksh
In addition, you need to set the FOR_IGNORE_EXCEPTIONS environment variable if you're using Fortran and you have built with the Intel compiler:
setenv FOR_IGNORE_EXCEPTIONS true   # for csh/tcsh

export FOR_IGNORE_EXCEPTIONS=true   # for bash/sh/ksh
If your Fortran code is built with the GNU compiler, you will need to link with the -fno-backtrace option.
When atp is loaded no core file will be generated. However, you can get core dumps (core.atp.<apid>.<rank>) if you set coredumpsize to unlimited:
unlimit coredumpsize   # for csh/tcsh

ulimit -c unlimited    # for bash/sh/ksh
More information can be found in the man page: type man intro_atp or, simply, man atp.
The following is to test ATP using an example code available in the ATP distribution package:
nersc$ cp $ATP_HOME/demos/testMPIApp.c .
nersc$ cc -o testMPIApp testMPIApp.c

nersc$ cat runit
#!/bin/bash
#SBATCH -N 1
#SBATCH -t 5:00
#SBATCH -q debug

export ATP_ENABLED=1
srun -n 8 ./testMPIApp 1 4

nersc$ sbatch runit
Submitted batch job 3044170

nersc$ cat slurm-3044710.out
[snip]
testApp: (31929) starting up...
testApp: (31932) starting up...
testApp: (31930) starting up...
testApp: (31933) starting up...
Application 3044170 is crashing. ATP analysis proceeding...

ATP Stack walkback for Rank 3 starting:
  _start@start.S:122
  __libc_start_main@libc-start.c:285
  main@testMPIApp.c:76
  raise@pt-raise.c:37
ATP Stack walkback for Rank 3 done
Process died with signal 4: 'Illegal instruction'
View application merged backtrace tree with: STATview atpMergedBT.dot
You may need to: module load stat

srun: error: nid00009: tasks 0-3: Killed
srun: Terminating job step 3044170.0
srun: Force Terminated job step 3044170.0
[snip]
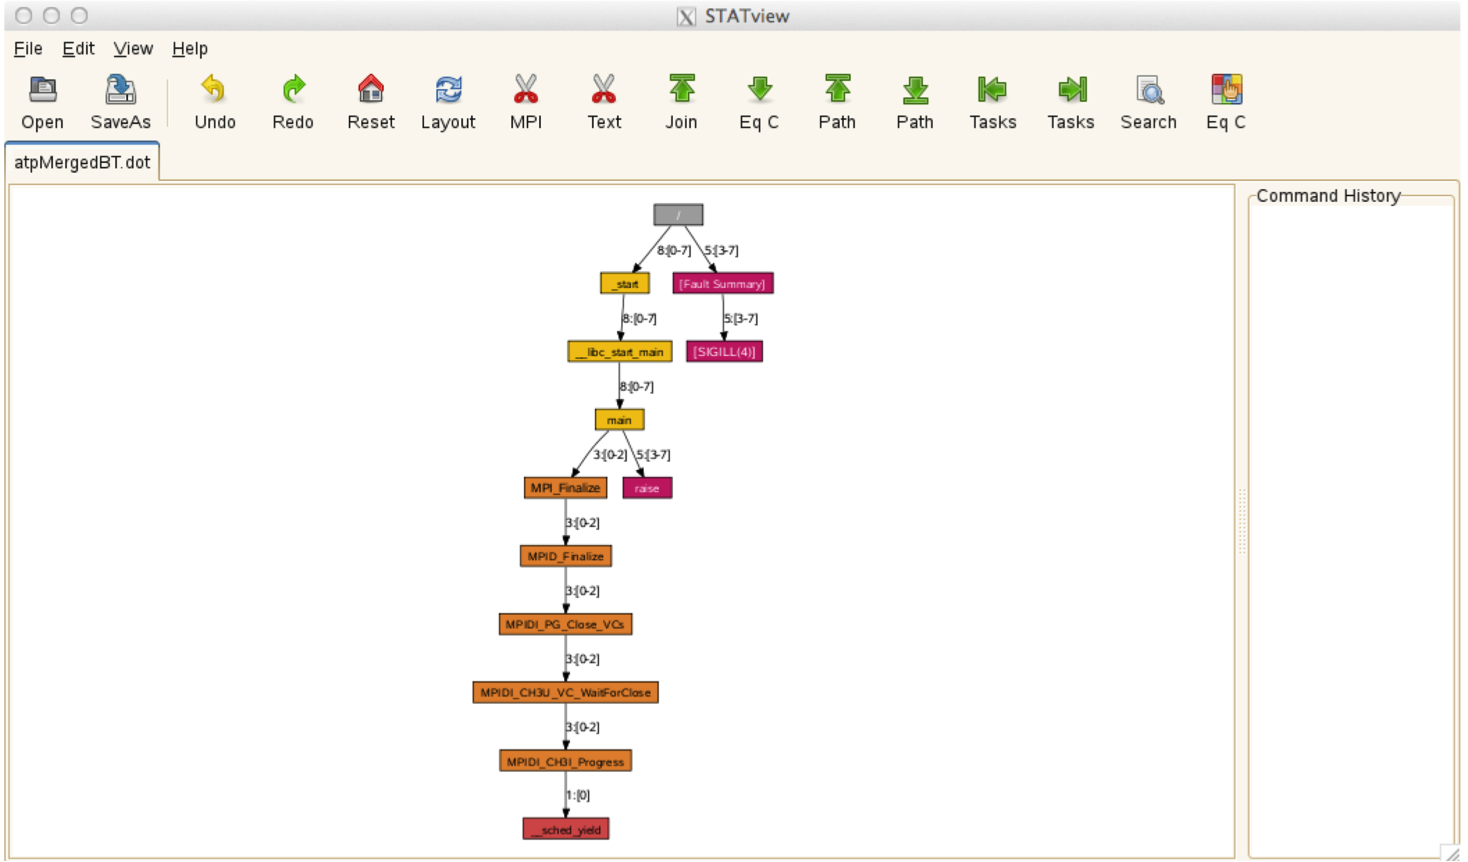
ATP creates a merged backtrace files in DOT fomat in atpMergedBT.dot and atpMergedBT_line.dot. The latter shows source line numbers, too. To view the collected backtrace result, you need to load the stat module and run STATview:
nersc$ module load stat
nersc$ STATview atpMergedBT.dot
Note
The following feature doesn't work at the moment (as of March 22, 2018). Cray is working on the issue.
ATP can be a useful tool in debugging a hung application, too. You can force ATP to generate backtraces for a hung application by killing the application. To do that, you should have done necessary preparational work such as setting the ATP_ENABLED environment variable, etc. in the batch script for the job in question.
nersc$ sacct -j 3169879 # find job step id for the application - it's 3169879.0
JobID JobName Partition Account AllocCPUS State ExitCode
------------ ---------- ---------- ---------- ---------- ---------- --------
3169879 runit knl mpccc 544 RUNNING 0:0
3169879.ext+ extern mpccc 544 RUNNING 0:0
3169879.0 jacobi_mp+ mpccc 4 RUNNING 0:0
3169879.1 cti_dlaun+ mpccc 2 RUNNING 0:0
nersc$ ssh cmom02 # You have to be on a MOM node
nersc$ scancel -s ABRT 3169879.0 # Kill the application
nersc$ exit # Back to the login node
nersc$ cat slurm-3169879.out
Application 3169879 is crashing. ATP analysis proceeding...
ATP Stack walkback for Rank 0 starting:
_start@start.S:122
__libc_start_main@libc-start.c:285
main@0x40a59d
MAIN__@jacobi_mpi.f90:174
ATP Stack walkback for Rank 0 done
Process died with signal 6: 'Aborted'
View application merged backtrace tree with: STATview atpMergedBT.dot
You may need to: module load stat
[snip]
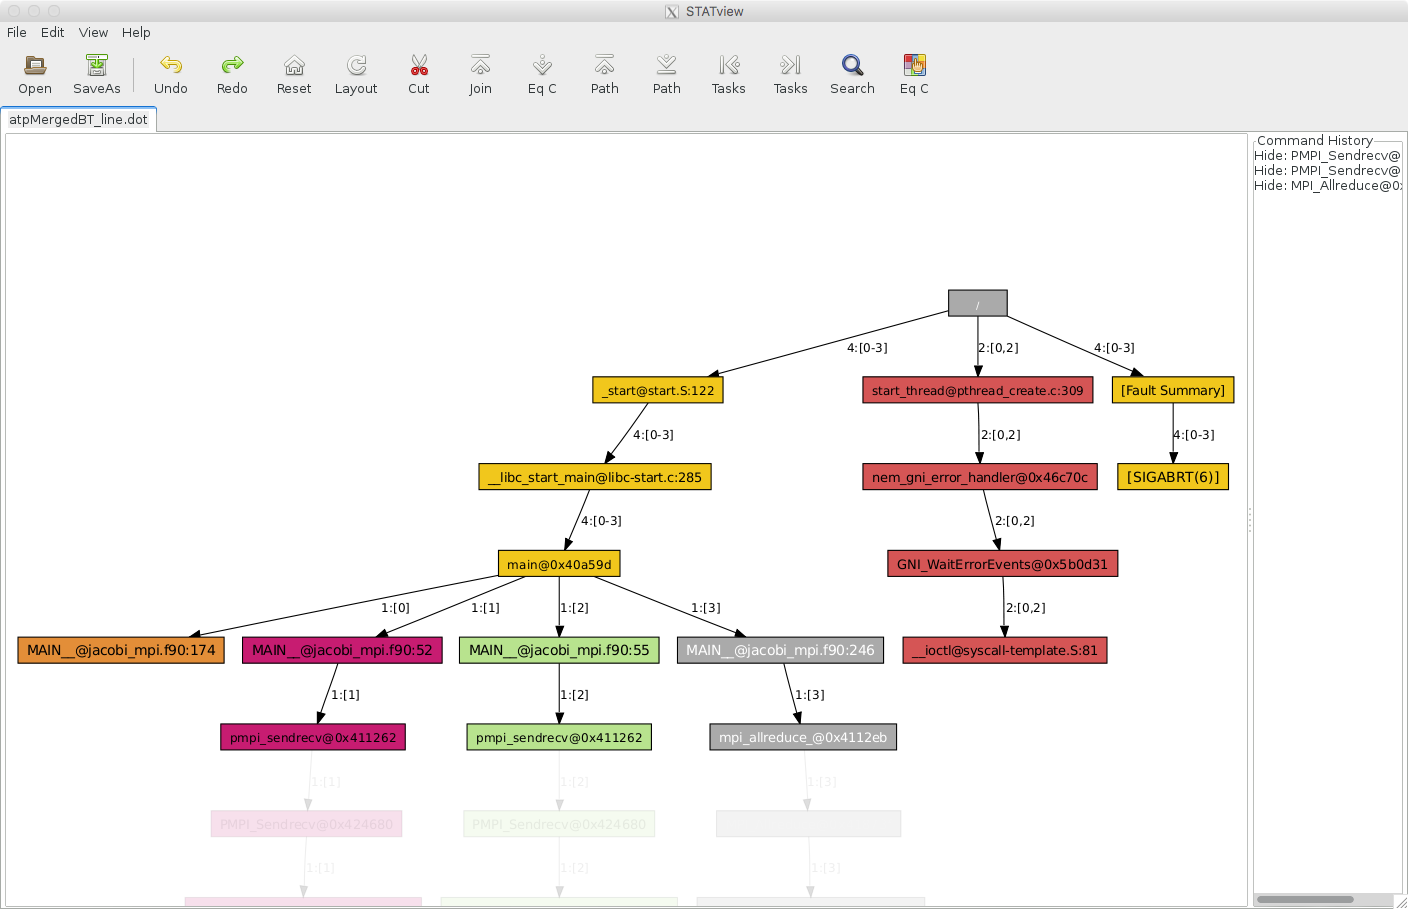
nersc$ STATview atpMergedBT_line.dot
Note
Cori's MOM node names are cmom02 and cmom05.
The above example is to use SIGABRT in killing the application. There are other signals accepted by ATP. For info, please read the atp man page.