HPCToolkit
Description
HPCToolkit is an integrated suite of tools for measurement and analysis of application performance on both CPUs and GPUs. HPCToolkit’s measurements provide support for analyzing a program execution cost, inefficiency, and scaling characteristics both within and across nodes of a parallel system.
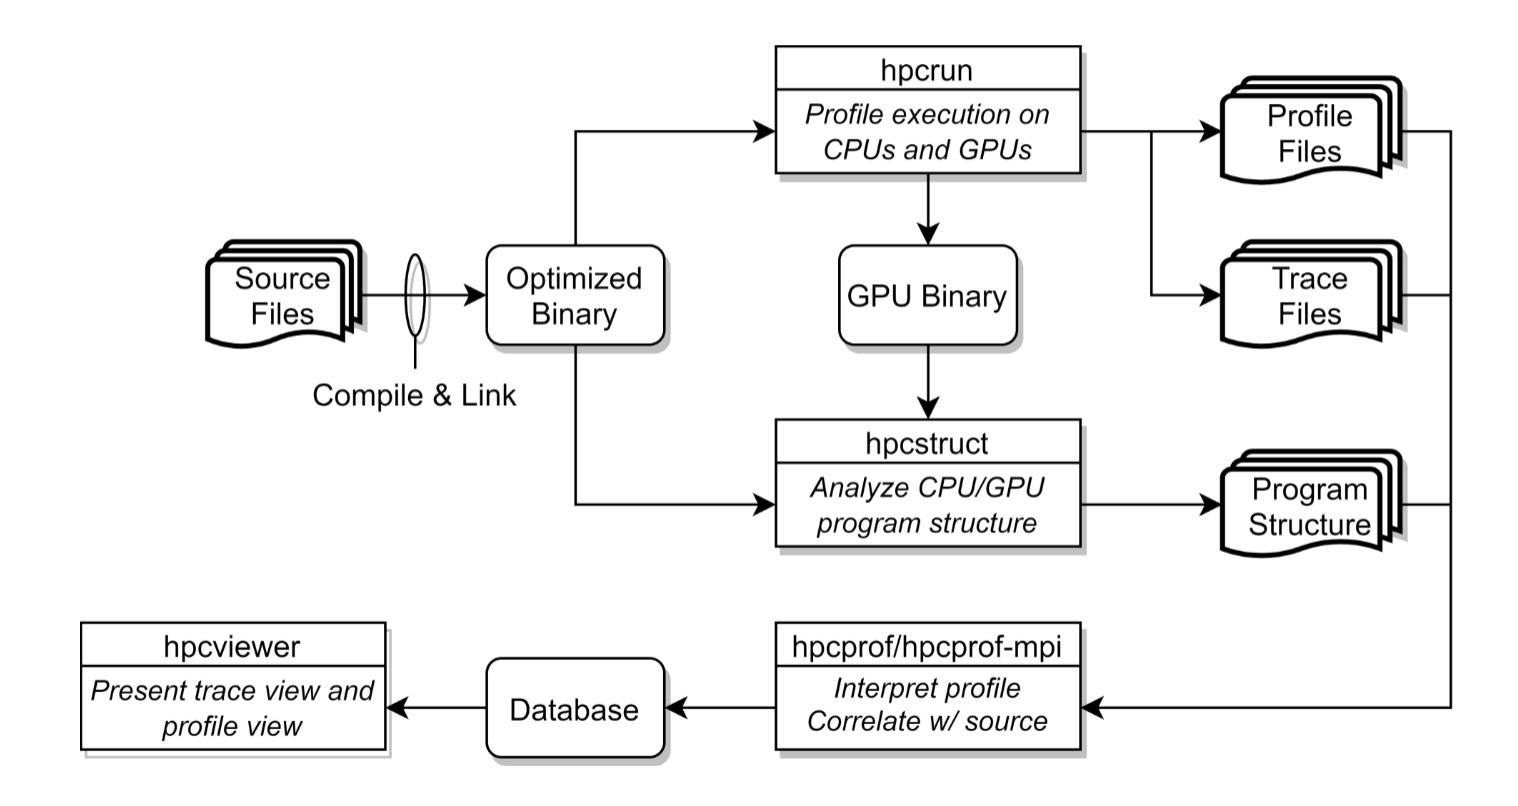
HPCToolkit’s work flow is organized around four principal capabilities:
- measurement of context-sensitive performance metrics using call-stack unwinding while an application executes (
hpcrun); - binary analysis to recover program structure from application binaries (
hpcstruct); - attribution of performance metrics by correlating dynamic performance metrics with static program structure (
hpcproforhpcprof-mpi); and - presentation of performance metrics and associated source code (
hpcviewer).
Loading the HPCToolkit Module on Cori
Note
The tool may fail to work properly with the darshan module. Until this is auto unloaded when hpctoolkit is loaded, please unload the module before proceeding to the next step.
To use HPCToolkit, first load the hpctoolkit module to set the correct environment settings:
module load hpctoolkit
If you are working on a GPU-accelerated application and using the Cori-GPU system, one must first load the cgpu module before loading the toolkit to get the user environment on Cori-GPU:
module purge
module load cgpu
module load hpctoolkit
Note
There are two versions of HPCToolkit on our system. One for Cori and a separate installation for Cori-GPU. The GPU version supports -e gpu=nvidia and -e gpu=nvidia,pc for fine-grain measurements using PC sampling. You must load the cgpu module to access the GPU enabled HPCToolkit.
Compiling your application on Cori
For the most detailed attribution of application performance data using HPCToolkit, code must be compiled with line map information (such as -g -O3). Check compiler documentation for right set of options for mapping without compromising optimization.
For GPU-accelerated application one must compile / build and run on the Cori-GPU and add -gpu=lineinfo in order to generate line-number information for device code. When using the NVIDIA compiler in addition to the above please use the -gopt -fast to map your application without compromising performance.
Measuring performance using hpcrun
Measurement of your application performance using hpcrun will be different based on whether your program is dynamically or statically linked.
For dynamically linked applications:
srun [srun-options] hpcrun [hpcrun-options] <your_application> [app-arguments]
For statically linked application: One must first link hpcrun’s monitoring code into app, using hpclink:
hpclink <linker> -o <your_application> <linker-arguments>
and then monitoring the application by passing hpcrun options through environment variables:
export [hpcrun-options]
srun [srun-options] <your_application> [app-arguments]
To get a list of environment variables that affect monitoring one can use the hpclink’s --help option:
hpclink --help
...
To control HPCToolkit's performance measurement library during an
application's execution, use the following environment variables:
  HPCRUN_EVENT_LIST=<event1>[@<period1>];...;<eventN>[@<periodN>]
                             : Sampling event list; hpcrun -e/--event
  HPCRUN_TRACE=1             : Enable tracing; hpcrun -t/--trace
  HPCRUN_PROCESS_FRACTION=<f>: Measure only a fraction <f> of the execution's
                               processes; hpcrun -f/-fp/--process-fraction
  HPCRUN_OUT_PATH=<outpath>  : Set output directory; hpcrun -o/--output
 ...
Recovering the program structure with hpcstruct
In this step the toolkit analyzes the application's binary and computes a representation of its static source code structure.
One can either run hpcstruct single threaded or accelerate using the -j n parameter where n is the number of threads:
hpstruct <your_application>
hpcstruct saves this program structure in a file named <your application>.hpcstruct which is then passed to hpcprof in the next step.
On Cori-GPU in addition to the above step for GPU-accelerated applications to enable detailed analysis of GPU functions, one must add an additional step to obtain compute program structure information for the application machine code (or cubins for CUDA).
Use --gpucfg <yes|no> to compute loop nesting structure for GPU machine code. Loop nesting structure is only useful when measurements are collected with PC sampling (-e gpu=nvidia,pc). Default is set to --gpucfg no, and sampling is not enabled.
#analyze CPU binaries
hpstruct <your_application>

#analyze all the GPU binaries in the measurements directory
hpstruct --gpucfg <yes/no> <your_application>-measurements directory
Warning
If your measurements directory contains fine-grain measurements collected using PC sampling, the version of nvdisasm is very slow and fails to compute control flow graphs for some GPU functions. As recommended by the toolkit, before using the --gpucfg yes option, please refer to the notes in Section 12.5 of the HPCToolkit documentation.
Analyzing the profiles and mapping to the source code with hpcprof or hpcprof-mpi
Once you have the call path profile (dynamic measurement using hpcrun) and your static program structure (using hpcstruct), HPCToolkit combines them to interpret the profile and co-relate with the source code using either hpcprof or hpcprof-mpi. Both commands are designed to generate same set of summary metrics over all threads and processes in an execution; hpcprof-mpi is designed to process (in parallel) the measurements from large-scale executions.
Note
hpcprof-mpi must be run as batch job with access to multiple MPI ranks either on a single Cori node or multiple nodes across the system.
To analyze the profile and generate a performance database :
hpcprof -S <your_application>.hpcstruct -I <your_application src>/+ \
hpctoolkit-<your_application>-measurements1  [hpctoolkit-<your_application>-measurements2 ...]
hpcprof is capable of combining multiple measurement databases, as long as they are gathered against the same binary.
Parameters passed to the hpcprof command:
| Parameter | Function |
|---|---|
| -S/--structure | takes a program structure file; generated using hpcstruct |
| -I/--include | directory to application source code; + suffix requests directory be searched recursively |
| -O/--output | output database directory path. Default is ./hpctoolkit-<your_application>-database |
Presenting the performance profile using hpcviewer
To interactively view and analyze an HPCToolkit performance database generated in the previous step one must use the hpcviewer:
Note
hpcviewer is a GUI tool, we recommend you use the NoMachine / NX on Cori or ssh -Y when logging in to the system.
module load hpcviewer
hpcviewer hpctoolkit-<your_application>-database
To use the hpcviewer utility to view the trace of sample events as part of a measurement database in addition to a profile, one must add -t/--trace flag to enable tracing with hpcrun. Follow the steps to generate the performance database using hpcprof or hpcprof-mpi and feed that into the hpcviewer as shown above.
One can also install hpcviewer on their local system (download instructions); transfer the performance database to your machine and interactively view the profile.
Tip
If you have large performance database(s) in the O(100) MBs that you're trying to view it is highly recommended that one downloads the database to your local system and use the local version of hpcviewer to prevent any performance lags. See here for NERSC recommended file transfer option(s).