Intel Trace Analyzer and Collector
Intel Trace Analyzer and Collector (ITAC) are two tools used for analyzing MPI behavior in parallel applications. ITAC identifies MPI load imbalance and communication hotspots in order to help developers optimize MPI parallelization and minimize communication and synchronization in their applications. Using Trace Collector on Cori must be done with a command line interface, while Trace Analyzer supports both a command line and graphical user interface which analyzes the data from Trace Collector.
Trace Collector and Trace Analyzer are provided by the itac module on Cori.
Compiler wrappers
Although Trace Collector and Trace Analyzer are Intel tools, on Cori they work properly only with codes compiled with the Cray MPI compiler wrappers, not the Intel MPI compiler wrappers provided in the impi modules.
Performing a collection with Trace Collector
To perform a collection with Trace Collector, one should compile her application as normal, using dynamic linking, and then set the LD_PRELOAD environment variable at runtime in order to instrument the executable with Trace Collector. E.g.,
module load itac
cc -g -O2 -dynamic -o foo.ex foo.c
export LD_PRELOAD=$VT_ROOT/intel64/slib/libVT.so
srun -n 128 -c 2 --cpu-bind=cores ./foo.ex
where the environment variable VT_ROOT is defined by the itac module. Trace Collector supports several different collection types, which are stored in different libraries; to perform a different collection, one can replace the libVT.so library with a different library, e.g., libVTim.so for tracing MPI load imbalance. The available collections are listed here.
Upon completion of the code execution, Trace Collector will generate a collection database in the directory from which the application was launched. This database can then be viewed with Trace Analyzer.
Some features of Trace Collector currently do not work with the Cray MPI wrappers. Please see the known issues section below for a description of these.
Following code completion, Trace Collector will produce several files in the directory from which the job was launched, including a file named <executable>.stf, which is the primary collection database. Steps for analyzing this database are provided below.
Additional options for trace collections
Trace Collector supports a few non-default collection options.
Consolidating collection database files
By default, Trace Collector will produce a large number of files along with the .stf file, which is the primary collection database. However, Trace Collector can consolidate the entire database into a single .stf file by using the following environment variable:
export VT_LOGFILE_FORMAT=STFSINGLE
Capturing OpenMP behavior
Trace Collector can also capture an application's OpenMP behavior, if the application is compiled dynamically with the Intel compilers. To do so, one should set the following environment variables at run time:
export INTEL_LIBITTNOTIFY64=$VT_ROOT/intel64/slib/libVT.so
export KMP_FORKJOIN_FRAMES_MODE=0
where libVT.so should match the same collection library used in LD_PRELOAD.
Analyzing a trace collection with Trace Analyzer
One can analyze the contents of a trace collection with Trace Analyzer, which is included in the itac module. To launch the GUI on a login node:
traceanalyzer /path/to/collection/database/foo.stf
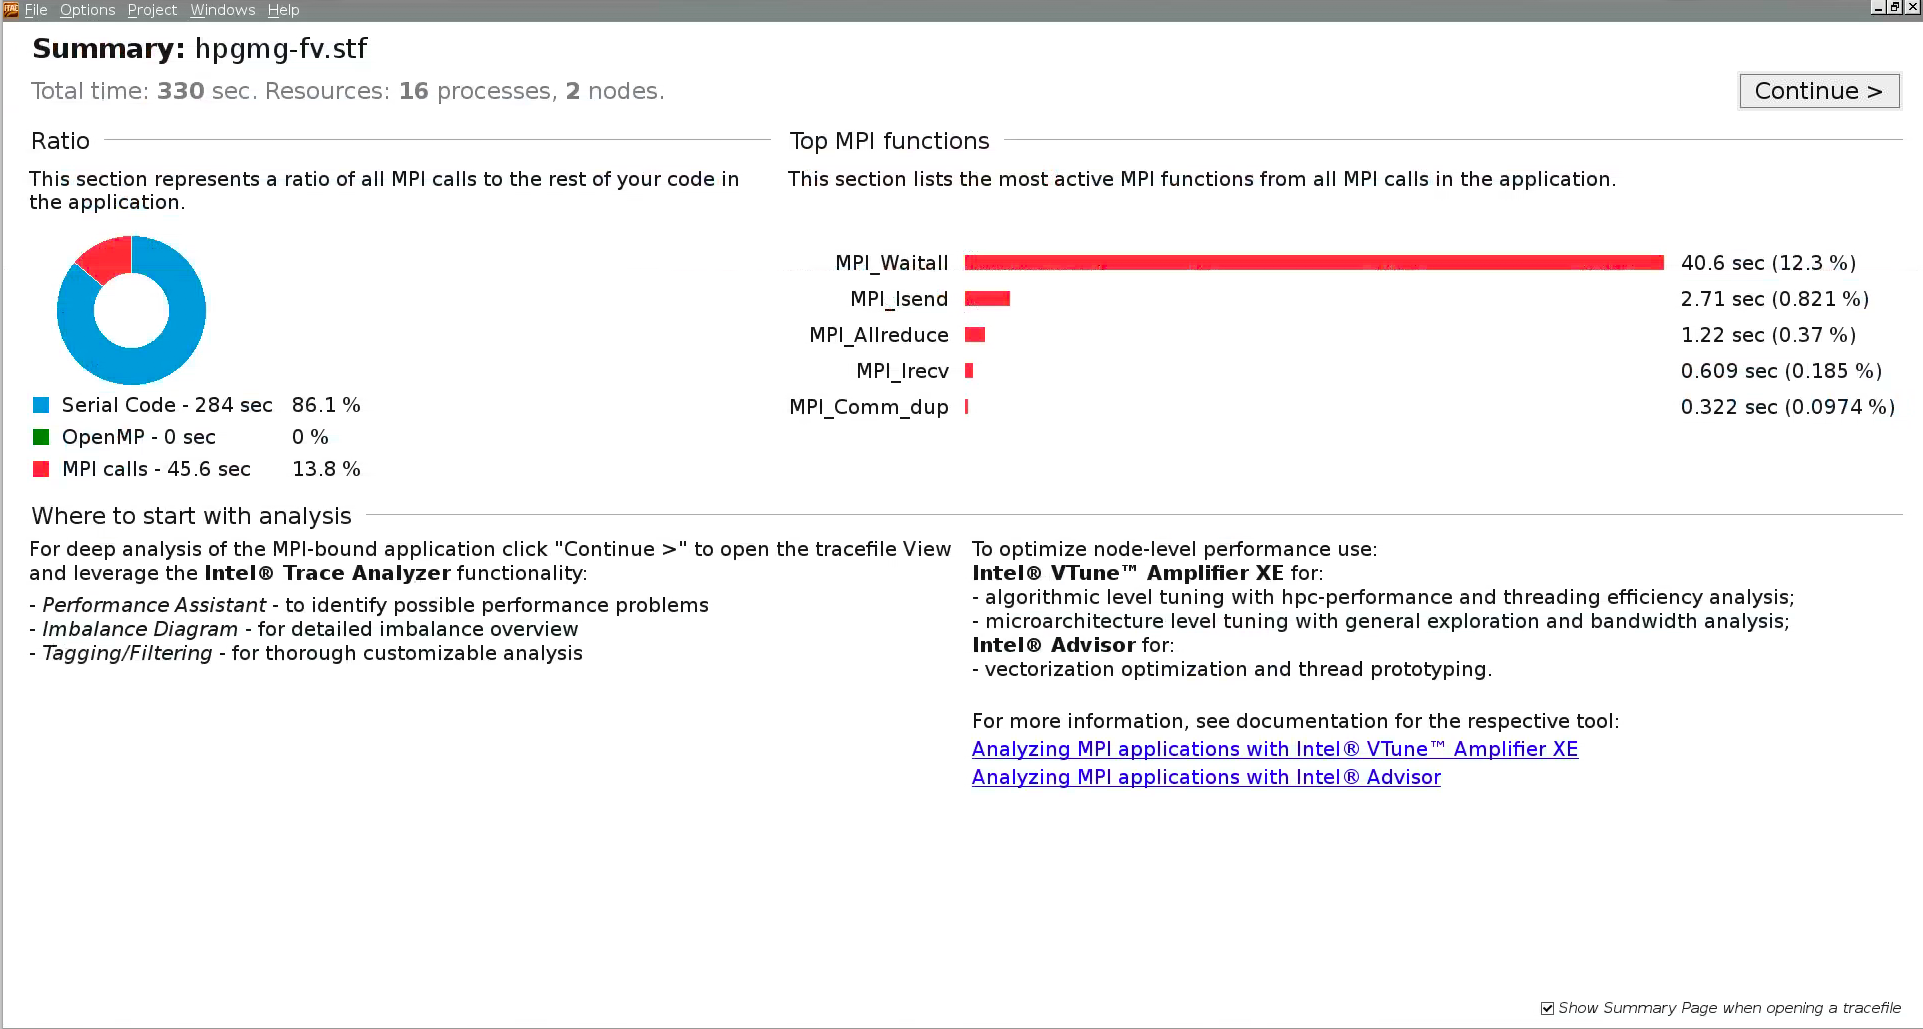
Trace Analyzer will begin by showing a summary page indicating what fraction of the run time the application spent in user code vs MPI calls. If the application was traced without OpenMP tracing support (see above), then Trace Analyzer will report that the total time spent in OpenMP regions is zero, even if the application was compiled and run with OpenMP threading enabled.
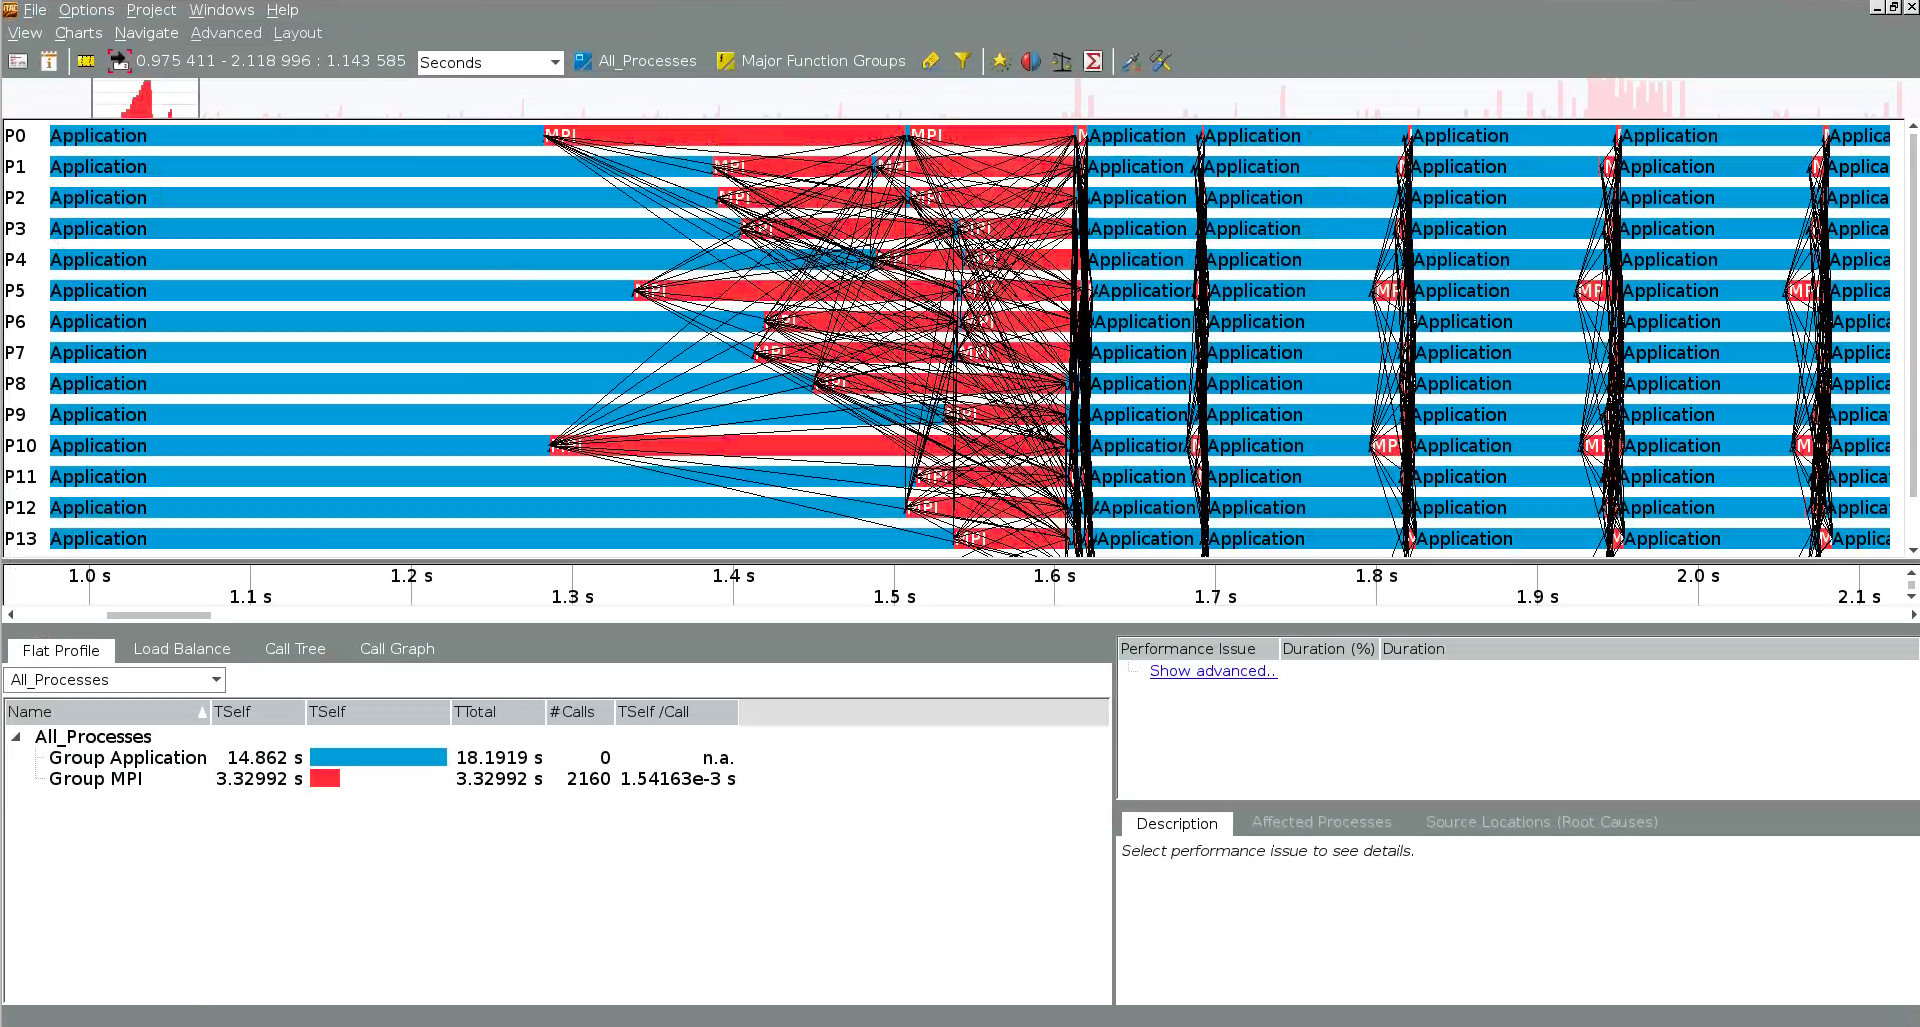
From here one can navigate to various windows which display detailed information about the MPI communication in the application. For example, the "event timeline" depicts the MPI traffic over time among all process, which can help with identifying regions where the application experiences load imbalance or a communication hotspot among MPI processes.
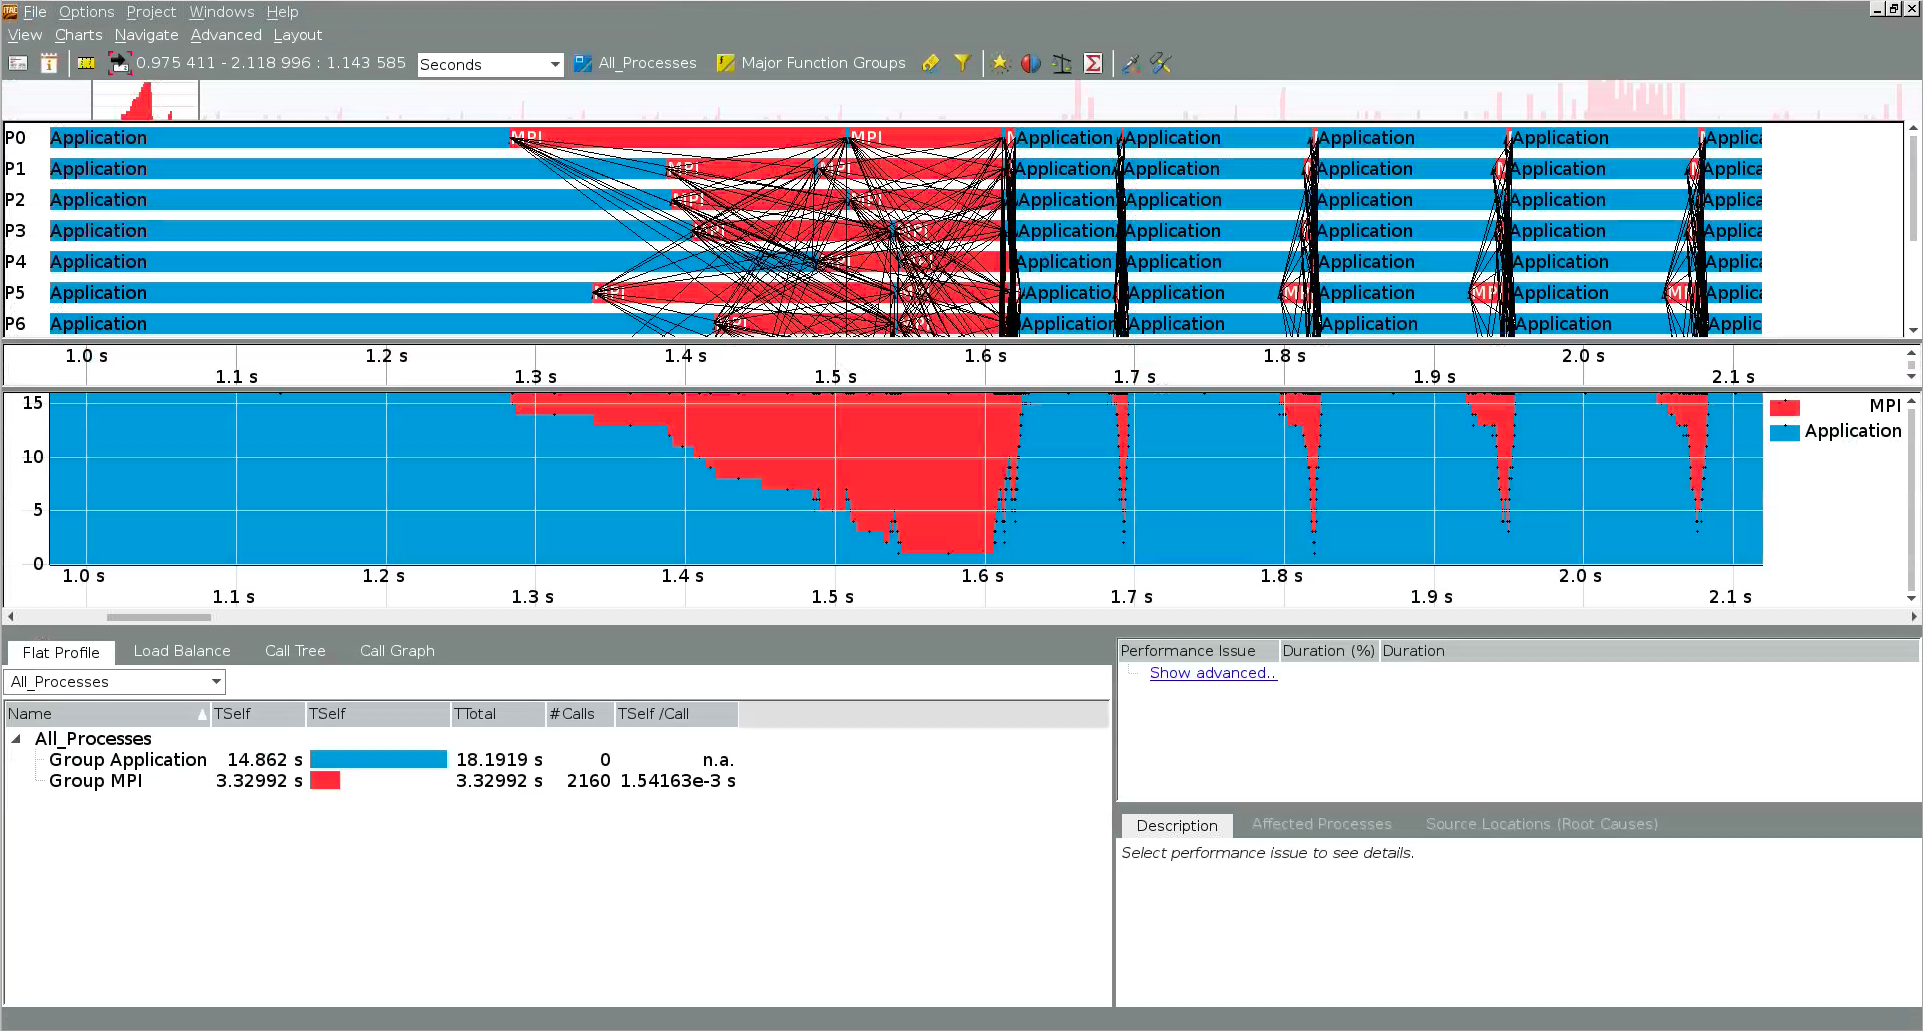
Similarly, the "quantitative timeline" shows the fraction of time spent in MPI vs user code over the duration of the run:
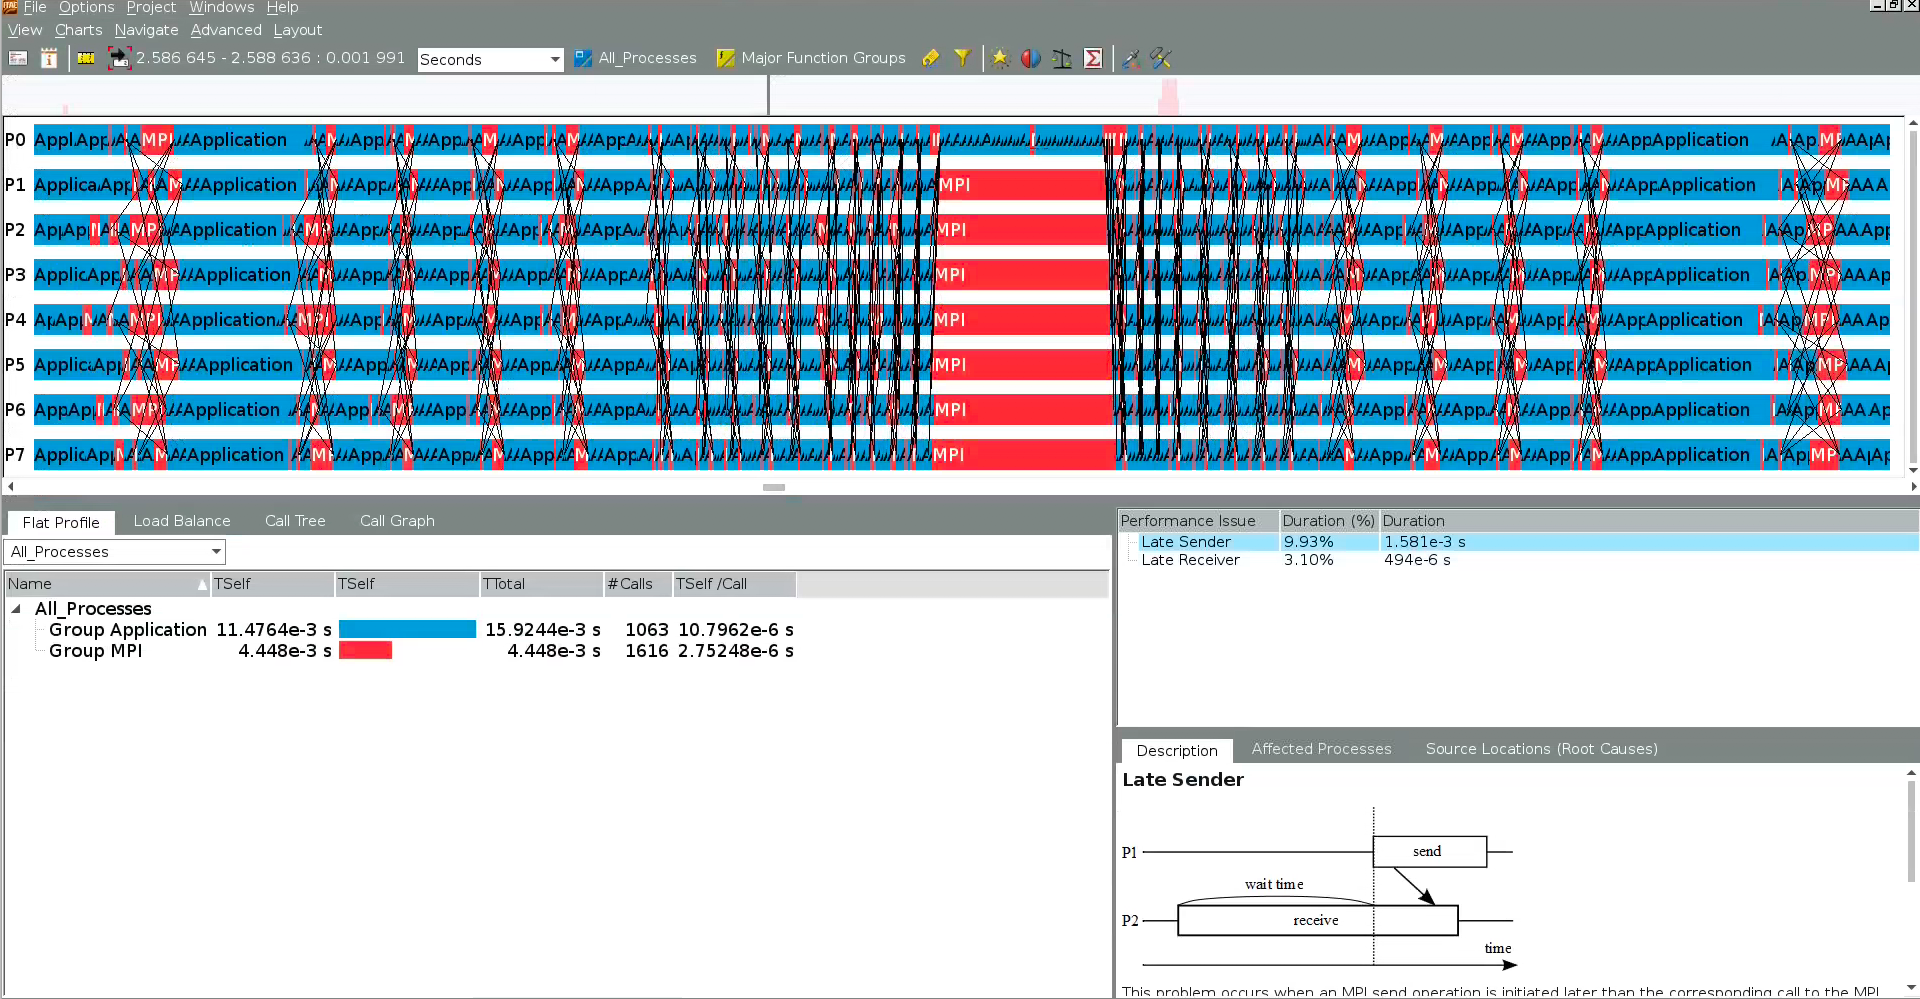
Clicking "Show advanced ..." in the pane on the right expands the description of MPI bottlenecks in the application (e.g., late sender, early receiver), and also provides an illustration and explanation of how that particular bottleneck tends to occur:
Trace Analyzer also supports a command line interface, which can produce machine-readable text files from a .stf collection file for further analysis. For example, one can compute statistics regarding messages, collectives, and functions via
traceanalyzer --cli --messageprofile -o message.txt ./foo.stf    # point-to-point messages
traceanalyzer --cli --collopprofile -o collop.txt ./foo.stf      # collective operations
traceanalyzer --cli --functionprofile -o function.txt ./foo.stf  # functions
More information about using the Trace Analyzer CLI can be found here.
Known issues
Currently ITAC has a few issues when running on Cori:
-
While the tracing itself typically slows down application execution only mildly, the conclusion of the tracing collection - writing the data to the
.stffile(s) can be extremely slow, and can take much longer than the application itself. It can also produce extremely large.stffiles if the application runs with a large number of MPI ranks and/or runs for a relatively long time (several minutes or more). If possible, consider tracing a small, representative problem, in order to keep the.stffile generation short. -
OpenMP behavior can be captured only if the application is compiled with the Intel compilers and if the environment variables shown above are set.