Arm Performance Reports
Introduction
Arm Performance Reports is a low-overhead tool that produces one-page text and HTML reports summarizing and characterizing both scalar and MPI application performance. The report intends to answer a range of vital questions:
-
Is this application optimized for the system it is running on?
-
Does it benefit from running at this scale?
-
Are there I/O or networking bottlenecks affecting performance?
-
Which hardware, software or configuration changes can be made to improve performance further?
The tool is based on MAP's low-overhead adaptive sampling technology that keeps data volumes collected and application overhead low.
The Arm Performance Reports User Guide available from the Arm Forge web page or $ALLINEA_TOOLS_DOCDIR/userguide-forge.pdf on Cori after loading an allinea-forge module is a good resource for learning more about its features.
Loading the Arm Forge Module
Starting from version 20.1, Arm Forge now includes the Performance Reports tool, too. To use the Performance Reports tool, simply load the allinea-forge module to set the correct environment settings:
nersc$ module load allinea-forge
Compiling Code to Run with Arm Performance Reports
To collect performance data, Arm Performance Reports uses the same sampling libraries that MAP uses: MAP sampler (map-sampler) and MPI wrapper (map-sampler-pmpi) libraries. The same build and link rules as with MAP apply here. For info, please read the User Guide or the MAP web page.
Just as with MAP, your program must be compiled with the -g option to keep debugging symbols, together with optimization flags that you would normally use. If you use the Cray compiler on the Cray machines, we recommend the -G2 option.
Below we show build instructions using a Fortran case, but the C or C++ usage is the same.
On Cray Machines
Dynamic linking has become the default mode of linking on Cori. To build a dynamically-linked executable, you don't have to build the MAP libraries. You build your executable as you would normally do, but with the -g compile flag:
nersc$ ftn -c -g jacobi_mpi.f90
nersc$ ftn -o jacobi_mpi jacobi_mpi.o -Wl,--eh-frame-hdr
Building an statically-linked executable for MAP is more complicated on Cray machines. You need to first explicitly build the static MAP sampler and MPI wrapper libraries using make-profiler-libraries, and then link your executable against them. For details, please check the user guide.
Starting a Job with Arm Performance Reports
In order to use this tool, you do not have to run your application in an interactive batch job session. Just make sure that the module is still loaded in the batch session (that is, in your batch job script if you use the tool in a non-interactie batch job):
module load allinea-forge
Add a command that launches the tool:
perf-report srun <usual srun flags> ./jacobi_mpi
where ./jacobi_mpi is the name of a program to profile.
Profiling Results
After completing the run, Arm Performance Reports prepares performance summary results in two files, one plain-text file and a HTML file: executablename_#p_#n_yyyy-mm-dd_HH-MM.txt and executablename_#p_#n_yyyy-mm-dd_HH-MM.html where # before the letter p is for the process count, # before the letter n is for the node count, and yyyy-mm-dd_HH-MM is the time stamp. For example:
$ ls -lrt jacobi_mpi*
...
-rw-r--r--   1 xxxxx xxxxx   476702 Jun 28 08:40 jacobi_mpi_8p_2n_2019-06-28_08-39.html
-rw-r--r--   1 xxxxx xxxxx     3092 Jun 28 08:40 jacobi_mpi_8p_2n_2019-06-28_08-39.txt
The performance results in both files are basically the same. If you want to use a web browser for a better display, download the HTML file to your local workstation and view it with your favorite browser.
The top portion of the report shows the command that was run and info about the compute nodes, followed by a performance characterization of the application run - whether it is a compute, MPI-communication or I/O bound:
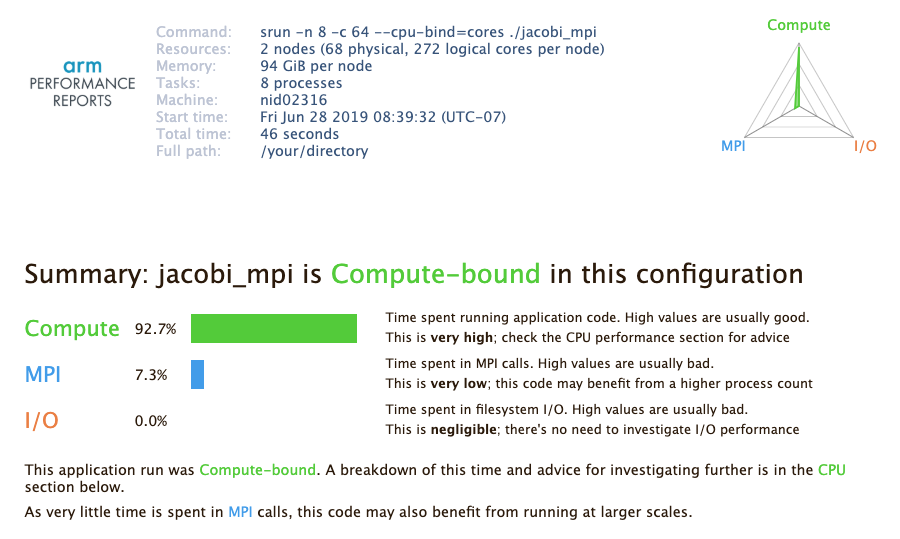
The triangular radar chart in the top-right corner of the report reflects the values of the three key measurement.
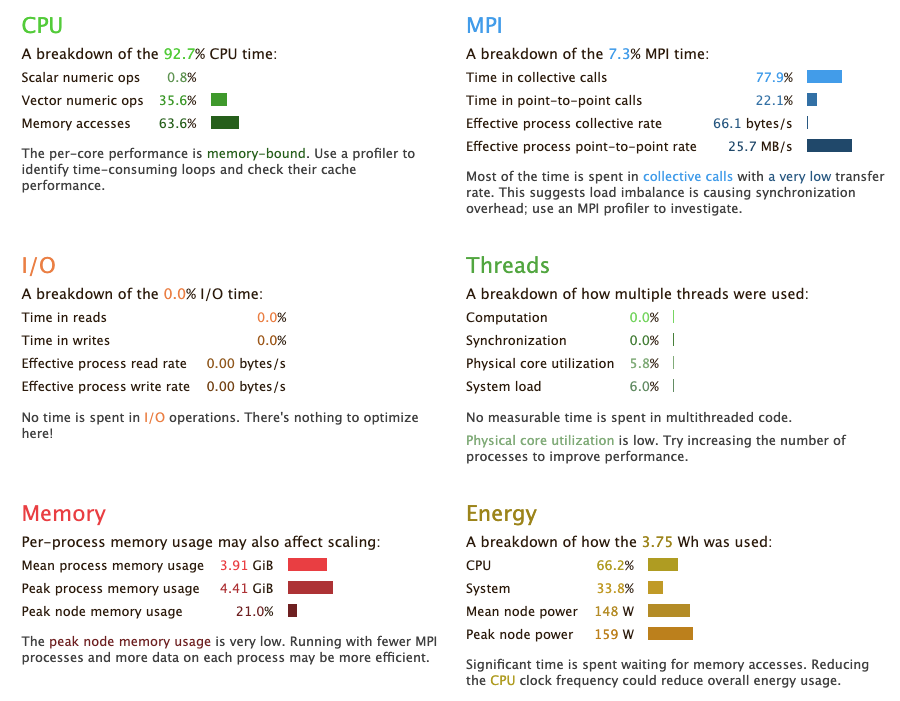
Then, the report shows more detailed info in each category, by breaking down relevant performance metrics into subcategories. For example, The 'CPU' component shows how much time was spent on scalar numeric operations, vector onumeric operations and memory access. Simlar breakdowns are done for MPI, I/O, threading, etc.
Summarizing an existing MAP file
If you have performance data collected with MAP before, you can get a performance summary report from the MAP file, too. To get a report, simply run the perf-report command on the MAP file:
nersc$ ls -l
...
-rw-r--r--   1 xxxxx xxxxx   475005 Jun 21 17:16 jacobi_mpi_8p_2n_2019-06-21_17-16.map
...

nersc$ perf-report jacobi_mpi_8p_2n_2019-06-28_08-49.map

nersc$ ls -l
...
-rw-r--r--   1 xxxxx xxxxx   476414 Jun 28 08:52 jacobi_mpi_8p_2n_2019-06-21_17-16.html
-rw-r--r--   1 xxxxx xxxxx     3078 Jun 28 08:52 jacobi_mpi_8p_2n_2019-06-21_17-16.txt
...