| Red | Green | Blue | |
| z | 17.64 | ||
| znorm | Inf | ||
| sky | -Inf | -Inf | -Inf |
| S/N | 17.6 | 30.5 | 32.8 |
| S/N(c) | 0.0 | 0.0 | 0.0 |
| SN(E/C) |
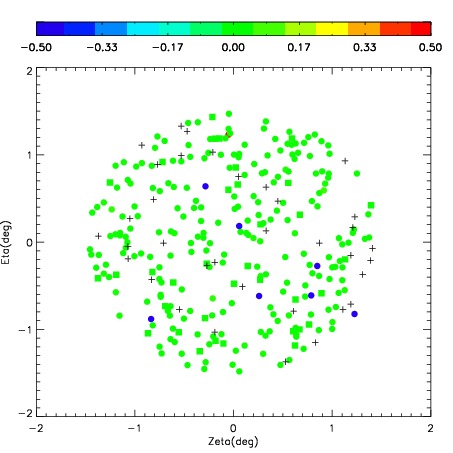


| Frame | Nreads | Zeropoints | Mag plots | Spatial mag deviation | Spatial sky 16325A emission deviations (filled: sky, open: star) | Spatial sky continuum emission | Spatial sky telluric CO2 absorption deviations (filled: H < 10) | |||||||||||||||||||||||
| 0 | 0 |
|
|
|
|
|
|
| IPAIR | NAME | SHIFT | NEWSHIFT | S/N | NAME | SHIFT | NEWSHIFT | S/N |
| 0 | 08220013 | 0.429652 | 0.00000 | 138.632 | 08220015 | -0.0204341 | 0.450086 | 208.253 |
| 1 | 08220016 | 0.394058 | 0.0355940 | 224.034 | 08220018 | -0.0228431 | 0.452495 | 231.907 |
| 2 | 08220017 | 0.411918 | 0.0177340 | 157.014 | 08220011 | 0.00000 | 0.429652 | 219.832 |
| 3 | 08220012 | 0.428432 | 0.00122002 | 152.994 | 08220014 | -0.0206996 | 0.450352 | 212.795 |